Lehi, UT (Utah) Houses and Residents
| Lehi: | $625,900 |
| Utah: | $499,500 |
Mean price in 2022:
Detached houses: $681,758
Here: $681,758 State: $607,750 Townhouses or other attached units: $519,658
Here: $519,658 State: $444,505 In 2-unit structures: $341,663
Here: $341,663 State: $433,540 In 3-to-4-unit structures: $273,501
Here: $273,501 State: $362,850 In 5-or-more-unit structures: $316,013
Here: $316,013 State: $412,810 Mobile homes: $115,144
Here: $115,144 State: $113,475
Total population: 56,275 (Urban population: 18,801, Rural population: 349 (17 farm, 332 nonfarm))
Houses: 24,166 (23,586 occupied: 18,522 owner occupied, 5,064 renter occupied)
| % of renters here: | 21% |
| State: | 29% |
Housing density: 1,189 houses/condos per square mile
Median price asked for vacant for-sale houses and condos in 2022: $1,111,532.
Median contract rent in 2022: $1,602 (lower quartile is $1,121, upper quartile is $1,905)
Median rent asked for vacant for-rent units in 2022: $1,925
Median gross rent in Lehi, UT in 2022: $1,745
Housing units in Lehi with a mortgage: 13,699 (2,307 second mortgage, 64 home equity loan, 2,147 both second mortgage and home equity loan)
Houses without a mortgage: 269
Median household income for houses/condos with a mortgage: $141,441
Median household income for apartments without a mortgage: $100,046
Median monthly housing costs: $1,747
Compare current foreclosures in Lehi, UT:
| Photo | Address | Area | Beds / Baths | Price | Details |
|---|---|---|---|---|---|

|
#1
W Pointe Meadow Loop
Lehi, UT 84043
|
2,088 sq. feet
|
2 baths 3 beds |
show details | |

|
#2
W Haven Cv
Lehi, UT 84043
|
1,578 sq. feet
|
2 baths 3 beds |
show details | |

|
#3
S 1610 W
Lehi, UT 84043
|
1,326 sq. feet
|
2 baths 3 beds |
show details | |

|
#4
N 40 E
Lehi, UT 84043
|
1,688 sq. feet
|
2 baths 3 beds |
show details | |

|
#5
N Newland Loop Unit 3
Lehi, UT 84043
|
1,316 sq. feet
|
2 baths 3 beds |
show details | |

|
#6
W 1870 N
Lehi, UT 84043
|
1,190 sq. feet
|
1 baths 3 beds |
show details | |

|
#7
Sunset Dr
Lehi, UT 84043
|
1,901 sq. feet
|
4 baths 4 beds |
show details | |

|
#8
Woodview Dr
Lehi, UT 84043
|
2,282 sq. feet
|
3 baths 4 beds |
show details | |

|
#9
N 2300 W
Lehi, UT 84043
|
1,536 sq. feet
|
2 baths 3 beds |
show details | |

|
#10
W Newland Loop
Lehi, UT 84043
|
2,254 sq. feet
|
2 baths 3 beds |
show details |
| Photo | Address | Area | Beds / Baths | Price | Details |
|---|---|---|---|---|---|

|
#11
W 1300 N
Lehi, UT 84043
|
1,672 sq. feet
|
2 baths 3 beds |
show details | |

|
#12
Fox Hollow Way
Lehi, UT 84043
|
2,184 sq. feet
|
2 baths 4 beds |
show details | |

|
#13
N 1325 E
Lehi, UT 84043
|
3,914 sq. feet
|
4 baths 6 beds |
show details | |

|
#14
W Fox Hunters Loop
Lehi, UT 84043
|
2,463 sq. feet
|
2 baths 4 beds |
show details | |

|
#15
N 300 W
Lehi, UT 84043
|
1,271 sq. feet
|
2 baths 3 beds |
show details | |

|
#16
E Clubview Ln
Lehi, UT 84043
|
2,037 sq. feet
|
3 baths 4 beds |
show details | |

|
#17
N 800 E
Lehi, UT 84043
|
1,125 sq. feet
|
2 baths 3 beds |
show details | |

|
#18
E 2900 N
Lehi, UT 84043
|
3,059 sq. feet
|
3 baths 4 beds |
show details | |

|
#19
E 100 S
Lehi, UT 84043
|
672 sq. feet
|
1 baths 2 beds |
show details | |

|
#20
S 1700 W
Lehi, UT 84043
|
1,072 sq. feet
|
2 baths 3 beds |
show details |
| Photo | Address | Area | Beds / Baths | Price | Details |
|---|---|---|---|---|---|

|
#21
S Perth St
Lehi, UT 84043
|
1,924 sq. feet
|
2 baths 3 beds |
show details | |

|
#22
Shadow Wood Dr
Lehi, UT 84043
|
3,114 sq. feet
|
2 baths 3 beds |
show details | |

|
#23
S 1700 W
Lehi, UT 84043
|
2,855 sq. feet
|
2 baths 4 beds |
show details | |

|
#24
N 600 W
Lehi, UT 84043
|
1,645 sq. feet
|
2 baths 3 beds |
show details | |

|
#25
W Fox Hunters Loop
Lehi, UT 84043
|
2,286 sq. feet
|
2 baths 4 beds |
show details | |

|
#26
E 800 N
Lehi, UT 84043
|
1,972 sq. feet
|
3 baths 5 beds |
show details | |

|
#27
W 875 S
Lehi, UT 84043
|
1,177 sq. feet
|
2 baths 3 beds |
show details | |

|
#28
N 1200 E
Lehi, UT 84043
|
1,218 sq. feet
|
2 baths 3 beds |
show details | |

|
#29
N 500 W
Lehi, UT 84043
|
2,025 sq. feet
|
3 baths 3 beds |
show details | |

|
#30
N 900 W
Lehi, UT 84043
|
- sq. feet
|
- baths - beds |
show details |
| Photo | Address | Area | Beds / Baths | Price | Details |
|---|---|---|---|---|---|

|
#31
Summer Crest Dr
Lehi, UT 84043
|
- sq. feet
|
- baths - beds |
show details | |

|
#32
N 1230 W
Lehi, UT 84043
|
- sq. feet
|
- baths - beds |
show details | |

|
#33
W Desert Merigold Way
Lehi, UT 84043
|
- sq. feet
|
- baths - beds |
show details | |

|
#34
W Barley Bnd
Lehi, UT 84043
|
- sq. feet
|
- baths - beds |
show details | |

|
#35
N 4000 W
Lehi, UT 84043
|
- sq. feet
|
- baths - beds |
show details | |

|
#36
N 3830 W
Lehi, UT 84043
|
- sq. feet
|
- baths - beds |
show details | |

|
#37
W Prairie Grass Dr
Lehi, UT 84043
|
- sq. feet
|
- baths - beds |
show details | |

|
#38
N 830 E
Lehi, UT 84043
|
- sq. feet
|
- baths - beds |
show details | |

|
#39
E Main St Ste 345
Lehi, UT 84043
|
- sq. feet
|
- baths - beds |
show details | |

|
#40
W Morning View Way # P177
Lehi, UT 84043
|
- sq. feet
|
- baths - beds |
show details |
| Photo | Address | Area | Beds / Baths | Price | Details |
|---|---|---|---|---|---|

|
#41
N Center St
Lehi, UT 84043
|
- sq. feet
|
- baths - beds |
show details | |

|
#42
W 1530 N, Unit 202
Lehi, UT 84043
|
- sq. feet
|
- baths - beds |
show details | |

|
#43
W 2280 N, Unit D203
Lehi, UT 84043
|
- sq. feet
|
- baths - beds |
show details | |

|
#44
W Orinda Dr
Lehi, UT 84043
|
- sq. feet
|
- baths - beds |
show details | |

|
#45
W Dixon Way
Lehi, UT 84043
|
- sq. feet
|
- baths - beds |
show details | |

|
#46
N 150 W
Lehi, UT 84043
|
- sq. feet
|
- baths - beds |
show details | |

|
#47
S 250 W
Lehi, UT 84043
|
- sq. feet
|
- baths - beds |
show details | |

|
#48
W 4050 N
Lehi, UT 84043
|
- sq. feet
|
- baths - beds |
show details | |

|
#49
W Jefferson St
Lehi, UT 84043
|
- sq. feet
|
- baths - beds |
show details | |

|
Check over 1 million property listings on Foreclosure.com!
|
browse all offers | |||

Latest news about housing in Lehi, UT collected exclusively by city-data.com from local newspapers, TV, and radio stations

 | Where Are Non-community Houses For Rent Near Lehi (2 replies) |
| Another Moving thread...Denver to Lehi (14 replies) |
| Finding a school--Lehi area (11 replies) |
| Move to Lehi? (8 replies) |
| Looking for thoughts on Lehi area (7 replies) |
| Lehi questions (3 replies) |

Median year apartment built: 2006
Household type by relationship:
Households: 84,368- Male householders: 12,221 (1,306 living alone), Female householders: 11,365 (2,320 living alone)
16,271 spouses (16,216 opposite-sex spouses), 821 unmarried partners, (821 opposite-sex unmarried partners), 37,356 children (35,521 natural, 832 adopted, 1,003 stepchildren), 1,475 grandchildren, 545 brothers or sisters, 474 parents, 0 foster children, 1,209 other relatives, 2,498 non-relatives
- In group quarters: 133
Size of family households: 4,342 2-persons, 3,393 3-persons, 4,158 4-persons, 3,728 5-persons, 2,112 6-persons, 1,604 7-or-more-persons.
Size of nonfamily households: 3,626 1-person, 324 2-persons, 115 3-persons, 100 4-persons, 84 6-persons.
27,982 married couples with children.
1,895 single-parent households (812 men, 1,083 women).
88.5% of residents of Lehi speak English at home.
5.7% of residents speak Spanish at home (71% speak English very well, 18% speak English well, 5% speak English not well, 5% don't speak English at all).
2.2% of residents speak other Indo-European language at home (91% speak English very well, 7% speak English well, 2% speak English not well).
2.8% of residents speak Asian or Pacific Island language at home (74% speak English very well, 12% speak English well, 12% speak English not well, 2% don't speak English at all).
0.2% of residents speak other language at home (76% speak English very well, 24% speak English well).
Foreign born population: 4,921 (5.8%)
(59.2% of them are naturalized citizens)
| Here: | 8.2 |
| State: | 7.6 |
| Here: | 5.4 |
| State: | 4.3 |

- Bedrooms in owner-occupied houses and condos in Lehi, Utah
- 0no bedroom
- 571 bedroom
- 1,1332 bedrooms
- 4,0823 bedrooms
- 5,7824 bedrooms
- 7,4685+ bedrooms

- Bedrooms in renter-occupied apartments in Lehi, Utah
- 52no bedroom
- 4971 bedroom
- 7892 bedrooms
- 2,6153 bedrooms
- 7424 bedrooms
- 3695+ bedrooms

- Cars and other vehicles available in Lehi in owner-occupied houses/condos
- 31no vehicle
- 3,3451 vehicle
- 8,3642 vehicles
- 3,8083 vehicles
- 1,5914 vehicles
- 1,3835+ vehicles

- Cars and other vehicles available in Lehi in renter-occupied apartments
- 130no vehicle
- 1,5231 vehicle
- 2,2512 vehicles
- 7443 vehicles
- 3474 vehicles
- 695+ vehicles

- Rooms in owner-occupied houses in Lehi, Utah
- 01 room
- 02 rooms
- 443 rooms
- 1,6564 rooms
- 9515 rooms
- 2,5716 rooms
- 2,3267 rooms
- 2,4668 rooms
- 8,5089+ rooms

- Rooms in renter-occupied apartments in Lehi, Utah
- 521 room
- 1932 rooms
- 4953 rooms
- 6964 rooms
- 1,2585 rooms
- 1,3556 rooms
- 2907 rooms
- 2108 rooms
- 5159+ rooms


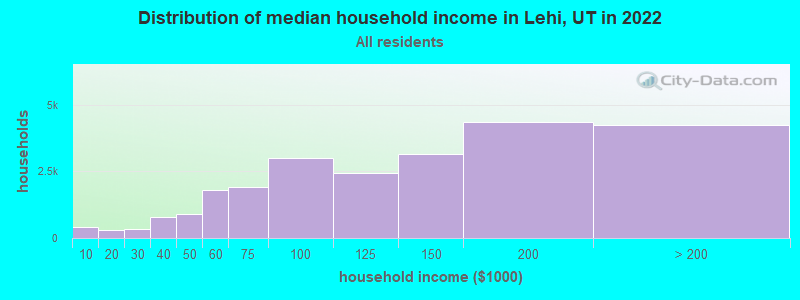
Lehi, UT household income distribution

- 398Less than $10,000
- 317$10,000 to $19,999
- 337$20,000 to $29,999
- 772$30,000 to $39,999
- 885$40,000 to $49,999
- 1,814$50,000 to $59,999
- 1,928$60,000 to $74,999
- 2,986$75,000 to $99,999
- 2,444$100,000 to $124,999
- 3,142$125,000 to $149,999
- 4,347$150,000 to $199,999
- 4,216$200,000 or more
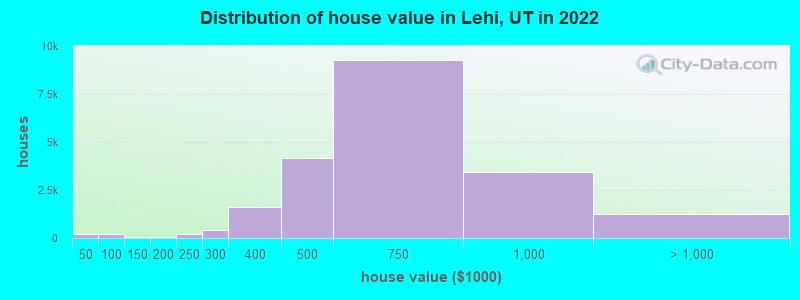
Home value of owner - occupied houses in 2022 in Lehi, UT
-
- 106Less than $10,000
- 18$15,000 to $19,999
- 12$25,000 to $29,999
- 10$30,000 to $34,999
- 13$35,000 to $39,999
- 34$40,000 to $49,999
- 39$50,000 to $59,999
- 74$60,000 to $69,999
- 19$70,000 to $79,999
- 37$80,000 to $89,999
- 5$90,000 to $99,999
- 50$100,000 to $124,999
- 6$125,000 to $149,999
- 37$150,000 to $174,999
- 23$175,000 to $199,999
- 228$200,000 to $249,999
- 428$250,000 to $299,999
- 1,608$300,000 to $399,999
- 4,163$400,000 to $499,999
- 9,295$500,000 to $749,999
- 3,417$750,000 to $999,999
- 989$1,000,000 to $1,499,999
- 84$1,500,000 to $1,999,999
- 158$2,000,000 or more
Rent paid by renters in 2022 in Lehi, UT
-
- 25$300 to $349
- 13$350 to $399
- 16$400 to $449
- 96$450 to $499
- 102$500 to $549
- 11$550 to $599
- 19$650 to $699
- 12$700 to $749
- 190$750 to $799
- 87$800 to $899
- 207$900 to $999
- 584$1,000 to $1,249
- 584$1,250 to $1,499
- 2,285$1,500 to $1,999
- 959$2,000 to $2,499
- 116$2,500 to $2,999
- 203No cash rent


Percentage of workers working in this county: 74.9%
Number of people working at home: 10,160 (26.0% of all workers)
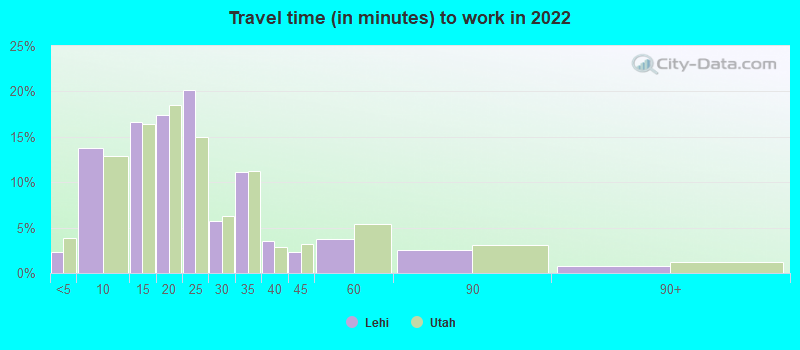
Travel time to work (commute)
- Less than 5 minutes: 936
- 5 to 9 minutes: 3,896
- 10 to 14 minutes: 5,822
- 15 to 19 minutes: 4,840
- 20 to 24 minutes: 4,322
- 25 to 29 minutes: 2,901
- 30 to 34 minutes: 4,332
- 35 to 39 minutes: 1,396
- 40 to 44 minutes: 1,211
- 45 to 59 minutes: 1,355
- 60 to 89 minutes: 464
- 90 or more minutes: 129
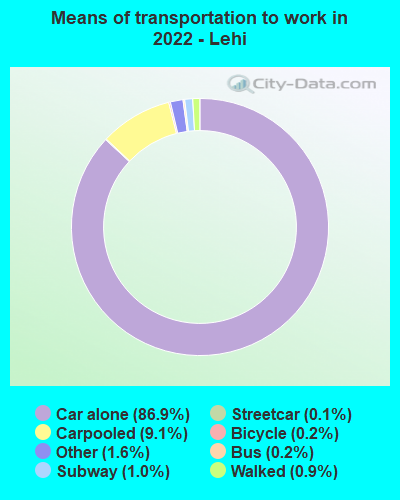
Means of transportation to work:
- Drove a car alone: 29,195 (67.9%)
- Carpooled: 3,017 (7.0%)
- Bus: 63 (0.1%)
- Subway or elevated rail: 46 (0.1%)
- Long-distance train or commuter rail: 166 (0.4%)
- Light rail, streetcar or trolley: 8 (0.0%)
- Taxi: 571 (1.3%)
- Bicycle: 60 (0.1%)
- Walked: 222 (0.5%)
- Worked at home: 10,160 (23.6%)

- Unemployment by race in 2022
- Unemployment rate for White non-Hispanic residents
- 3.2%Males
- 2.7%Females
- Unemployment rate for Black residents
- 1.4%Females
- Unemployment rate for American Indian and Alaska Native residents
- 25.1%Females
- Unemployment rate for Asian residents
- 1.3%Males
- Unemployment rate for other race residents
- 1.0%Males
- 2.5%Females
- Unemployment rate for two or more race residents
- 0.7%Males
- 12.9%Females
- Unemployment rate for Hispanic or Latino residents
- 0.5%Males
- 5.6%Females

- Year of entry for the foreign-born population in Lehi, Utah
- 2,5302010 or later
- 7372000 to 2009
- 1,0631990 to 1999
- 2091980 to 1989
- 391970 to 1979
- 94Before 1970
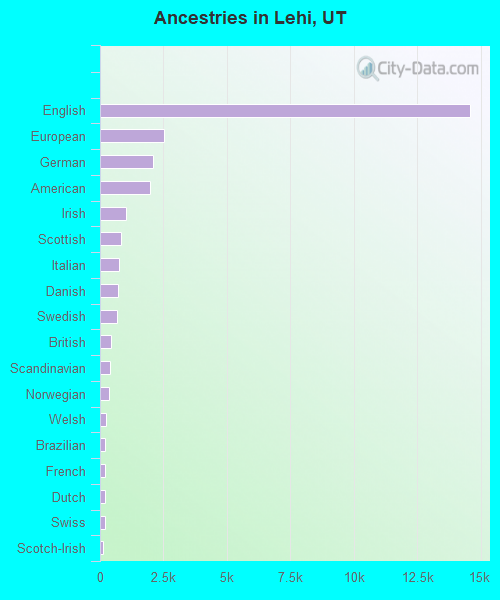
First ancestries reported:
- English: 14,595 (41.8%)
- European: 2,502 (7.2%)
- German: 2,076 (5.9%)
- American: 1,967 (5.6%)
- Irish: 1,021 (2.9%)
- Scottish: 824 (2.4%)
- Italian: 745 (2.1%)
- Danish: 719 (2.1%)
- Swedish: 686 (2.0%)
- British: 439 (1.3%)
- Scandinavian: 401 (1.1%)
- Norwegian: 339 (1.0%)
- Welsh: 225 (0.6%)
- Brazilian: 215 (0.6%)
- French: 212 (0.6%)
- Dutch: 210 (0.6%)
- Swiss: 182 (0.5%)
- Scotch-Irish: 135 (0.4%)
- Egyptian: 110 (0.3%)
- Ukrainian: 92 (0.3%)
- Polish: 75 (0.2%)
- Greek: 75 (0.2%)
- Northern European: 72 (0.2%)
- French Canadian: 67 (0.2%)
- Russian: 52 (0.1%)
- Canadian: 43 (0.1%)
- Portuguese: 26 (0.07%)
- Romanian: 24 (0.07%)
- Lebanese: 24 (0.07%)
- Cajun: 20 (0.06%)
- Iraqi: 20 (0.06%)
- Armenian: 19 (0.05%)
- Belgian: 15 (0.04%)
- Basque: 11 (0.03%)
- Yugoslavian: 11 (0.03%)
- Hungarian: 10 (0.03%)
- Lithuanian: 7 (0.02%)
- African: 7 (0.02%)
- Eastern European: 3 (0.01%)
Most common places of birth for foreign-born residents (%):
| Lehi: | 19.7% (885) |
| Utah: | 36.1% (99,740) |
| Lehi: | 8.3% (374) |
| Utah: | 3.0% (8,294) |
| Lehi: | 8.0% (359) |
| Utah: | 2.8% (7,644) |
| Lehi: | 7.6% (340) |
| Utah: | 3.2% (8,804) |
| Lehi: | 6.4% (286) |
| Utah: | 2.9% (8,017) |
| Lehi: | 4.8% (216) |
| Utah: | 2.6% (7,211) |
| Lehi: | 4.2% (187) |
| Utah: | 3.0% (8,341) |
| Lehi: | 3.7% (165) |
| Utah: | 0.2% (547) |
| Lehi: | 3.7% (164) |
| Utah: | 0.5% (1,280) |
| Lehi: | 3.5% (155) |
| Utah: | 2.3% (6,468) |
| Lehi: | 3.4% (154) |
| Utah: | 1.3% (3,479) |
| Lehi: | 2.6% (116) |
| Utah: | 0.3% (896) |
| Lehi: | 2.2% (98) |
| Utah: | 0.4% (996) |
| Lehi: | 2.1% (94) |
| Utah: | 0.4% (977) |
| Lehi: | 2.0% (90) |
| Utah: | 1.3% (3,570) |
| Lehi: | 1.8% (79) |
| Utah: | 0.3% (808) |
Place of birth for U.S.-born residents:
- This state: 52,711
- Other state: 26,024
- Northeast: 1,823
- Midwest: 2,214
- South: 4,044
- West: 17,943
87.7% of Lehi residents lived in the same house 1 years ago.
Out of people who lived in different houses, 30.0% lived in this county.
Out of people who lived in different counties, 70.5% lived in Utah.
| Lehi: | 87.7% |
| State average: | 85.7% |
Education attainment for males 25 years and older:
- No schooling: 546
- Nursery to 4th grade: 52
- 5th and 6th grade: 0
- 7th and 8th grade: 0
- 9th grade: 0
- 10th grade: 34
- 11th grade: 103
- 12th grade, no diploma: 336
- High school graduate (or equivalency): 2,611
- Less than 1 year of college: 1,037
- Some college more than 1 year, no degree: 3,970
- Associate degree: 1,807
- Bachelor's degree: 6,799
- Master's degree: 3,388
- Professional school degree: 735
- Doctorate degree: 650

Education attainment for females 25 years and older:
- No schooling: 239
- Nursery to 4th grade: 186
- 5th and 6th grade: 0
- 7th and 8th grade: 0
- 9th grade: 0
- 10th grade: 0
- 11th grade: 80
- 12th grade, no diploma: 259
- High school graduate (or equivalency): 2,652
- Less than 1 year of college: 1,745
- Some college more than 1 year, no degree: 3,776
- Associate degree: 2,661
- Bachelor's degree: 8,570
- Master's degree: 1,363
- Professional school degree: 99
- Doctorate degree: 156


Housing units in structures:
- One, detached: 17,377
- One, attached: 2,883
- Two: 710
- 3 or 4: 567
- 5 to 9: 338
- 10 to 19: 1,668
- 20 to 49: 166
- 50 or more: 342
- Mobile homes: 115
House/condo owner moved in on average 6 years ago
Renter moved in on average 0 years ago

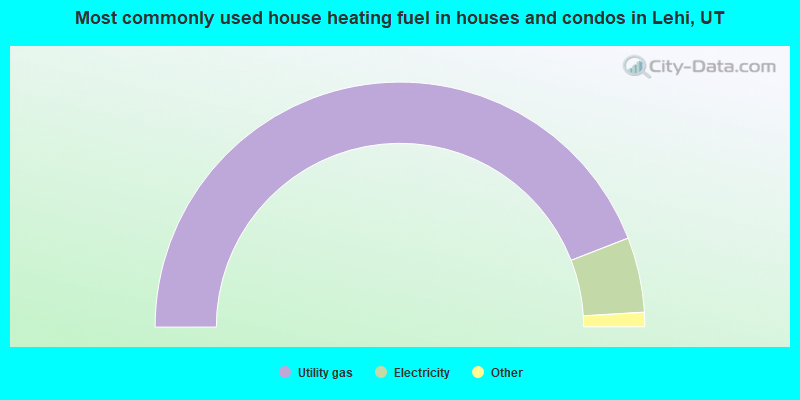
- 88.2%Utility gas
- 9.9%Electricity
- 1.3%Bottled, tank, or LP gas
- 0.2%Solar energy
- 0.1%Wood
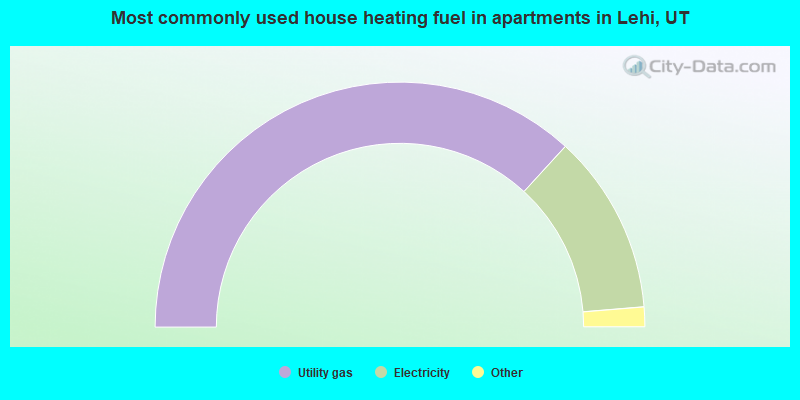
- 73.6%Utility gas
- 23.8%Electricity
- 1.7%Bottled, tank, or LP gas
- 0.7%Fuel oil, kerosene, etc.
Private vs. public school enrollment:
| Here: | 4.5% |
| Utah: | 7.2% |
| Here: | 5.1% |
| Utah: | 5.3% |
| Here: | 33.9% |
| Utah: | 26.7% |