Leland, IL (Illinois) Houses and Residents
| Leland: | $179,908 |
| Illinois: | $251,600 |
Mean price in 2022:
Detached houses: $186,165
Here: $186,165 State: $310,164
Total population: 951 (Urban population: 0, Rural population: 972 (all nonfarm))
Houses: 500 (462 occupied: 376 owner occupied, 86 renter occupied)
| % of renters here: | 19% |
| State: | 33% |
Housing density: 922 houses/condos per square mile
Median price asked for vacant for-sale houses and condos in 2022: $175,434.
Median contract rent in 2022: $1,039 (lower quartile is $810, upper quartile is $1,269)
Median rent asked for vacant for-rent units in 2022: $2,031
Median gross rent in Leland, IL in 2022: $1,240
Housing units in Leland with a mortgage: 272 (24 second mortgage, 0 home equity loan, 13 both second mortgage and home equity loan)
Houses without a mortgage: 0
Median household income for houses/condos with a mortgage: $77,574
Median household income for apartments without a mortgage: $55,162
Median monthly housing costs: $1,321
Compare current foreclosures near Leland, IL:
| Photo | Address | Area | Beds / Baths | Price | Details |
|---|---|---|---|---|---|

|
#1
N 4750th Rd
Leland, IL 60531
|
- sq. feet
|
- baths - beds |
show details | |

|
#2
E Kross St
Leland, IL 60531
|
- sq. feet
|
- baths - beds |
show details | |

|
#3
N 46th Rd
Leland, IL 60531
|
- sq. feet
|
- baths - beds |
show details | |

|
#4
W Hall St
Leland, IL 60531
|
- sq. feet
|
- baths - beds |
show details | |

|
#5
N Wolfe St
Sandwich, IL 60548
|
1,120 sq. feet
|
1 baths 3 beds |
show details | |

|
#6
Stoneridge Ct
Yorkville, IL 60560
|
- sq. feet
|
2 baths 3 beds |
show details | |

|
#7
Kristen Ct
Plano, IL 60545
|
2,500 sq. feet
|
3 baths 4 beds |
show details | |

|
#8
Tamaira St
Plano, IL 60545
|
2,072 sq. feet
|
2 baths 4 beds |
show details | |

|
#9
Big Rock Ave
Plano, IL 60545
|
2,021 sq. feet
|
2 baths 3 beds |
show details | |

|
#10
N 3739th Rd
Sheridan, IL 60551
|
- sq. feet
|
2 baths 4 beds |
show details |
| Photo | Address | Area | Beds / Baths | Price | Details |
|---|---|---|---|---|---|

|
#11
S Cherry St
Somonauk, IL 60552
|
- sq. feet
|
2 baths 3 beds |
show details | |

|
#12
4th Ave
Mendota, IL 61342
|
- sq. feet
|
- baths - beds |
show details | |

|
#13
Woodwind Dr
Plano, IL 60545
|
- sq. feet
|
- baths - beds |
show details | |

|
#14
E 2601st Rd
Sheridan, IL 60551
|
- sq. feet
|
- baths - beds |
show details | |

|
#15
E 6th St
Sandwich, IL 60548
|
- sq. feet
|
- baths - beds |
show details | |

|
#16
Whitetail Ln
Sandwich, IL 60548
|
- sq. feet
|
- baths - beds |
show details | |

|
#17
N Birch St
Waterman, IL 60556
|
- sq. feet
|
- baths - beds |
show details | |

|
#18
E 2089th Rd
Serena, IL 60549
|
- sq. feet
|
- baths - beds |
show details | |

|
#19
N State Route 23
Ottawa, IL 61350
|
- sq. feet
|
- baths - beds |
show details | |

|
#20
E Liberty St
Newark, IL 60541
|
- sq. feet
|
- baths - beds |
show details |
| Photo | Address | Area | Beds / Baths | Price | Details |
|---|---|---|---|---|---|

|
#21
E 2250th Rd
Ottawa, IL 61350
|
- sq. feet
|
- baths - beds |
show details | |

|
#22
E 2250th Rd
Ottawa, IL 61350
|
- sq. feet
|
- baths - beds |
show details | |

|
#23
W South St
Plano, IL 60545
|
- sq. feet
|
- baths - beds |
show details | |

|
#24
E Clark St Apt 308
Plano, IL 60545
|
- sq. feet
|
- baths - beds |
show details | |

|
#25
N 3959th Rd
Sheridan, IL 60551
|
- sq. feet
|
- baths - beds |
show details | |

|
#26
N 35th Rd
Seneca, IL 61360
|
- sq. feet
|
- baths - beds |
show details | |

|
#27
E Nissen Stigen
Lee, IL 60530
|
- sq. feet
|
- baths - beds |
show details | |

|
#28
N 46th Rd
Somonauk, IL 60552
|
- sq. feet
|
- baths - beds |
show details | |

|
#29
Pratt St
Plano, IL 60545
|
- sq. feet
|
- baths - beds |
show details | |

|
#30
E Stevenson Rd
Ottawa, IL 61350
|
- sq. feet
|
- baths - beds |
show details |
| Photo | Address | Area | Beds / Baths | Price | Details |
|---|---|---|---|---|---|

|
#31
Carolyn Ct
Yorkville, IL 60560
|
- sq. feet
|
- baths - beds |
show details | |

|
#32
2nd Ave
Mendota, IL 61342
|
- sq. feet
|
- baths - beds |
show details | |

|
#33
N 4645th Rd # B
Somonauk, IL 60552
|
- sq. feet
|
- baths - beds |
show details | |

|
#34
6th Ave
Mendota, IL 61342
|
- sq. feet
|
- baths - beds |
show details | |

|
#35
4th Ave
Mendota, IL 61342
|
- sq. feet
|
- baths - beds |
show details | |

|
#36
Bender St
Sandwich, IL 60548
|
- sq. feet
|
- baths - beds |
show details | |

|
#37
W Us Highway 34 # C
Plano, IL 60545
|
- sq. feet
|
- baths - beds |
show details | |

|
#38
Wentworth Dr Apt 2
Sandwich, IL 60548
|
- sq. feet
|
- baths - beds |
show details | |

|
#39
E. 26th 19th Rd.
Sandwich, IL 60548
|
- sq. feet
|
- baths - beds |
show details | |

|
#40
N 41st Rd
Sheridan, IL 60551
|
- sq. feet
|
- baths - beds |
show details |
| Photo | Address | Area | Beds / Baths | Price | Details |
|---|---|---|---|---|---|

|
#41
N 4251st Rd
Sheridan, IL 60551
|
- sq. feet
|
- baths - beds |
show details | |

|
#42
W 5th St
Sandwich, IL 60548
|
- sq. feet
|
- baths - beds |
show details | |

|
#43
E 2370th Rd
Sheridan, IL 60551
|
- sq. feet
|
- baths - beds |
show details | |

|
#44
Cedar Ln
Sandwich, IL 60548
|
- sq. feet
|
- baths - beds |
show details | |

|
#45
W 2nd St
Sandwich, IL 60548
|
- sq. feet
|
- baths - beds |
show details | |

|
#46
N 42nd Rd
Sheridan, IL 60551
|
- sq. feet
|
- baths - beds |
show details | |

|
#47
Northampton Dr
Sandwich, IL 60548
|
- sq. feet
|
- baths - beds |
show details | |

|
#48
N Gage St
Somonauk, IL 60552
|
- sq. feet
|
- baths - beds |
show details | |

|
#49
W Railroad St
Earlville, IL 60518
|
- sq. feet
|
- baths - beds |
show details | |

|
Check over 1 million property listings on Foreclosure.com!
|
browse all offers | |||

Latest news about housing in Leland, IL collected exclusively by city-data.com from local newspapers, TV, and radio stations

 | How is Uptown currently? (15 replies) |
| What a day in Chicago! (29 replies) |
| Buying a condo in Albany Park...opinions? (34 replies) |
| Barrington(s), Tower Lake, Wheaton, Inverness, and ? (55 replies) |
| Is Chicago Underpopulated? (426 replies) |
| Leland and Malden? (5 replies) |

Median year apartment built: 1938
Household type by relationship:
Households: 1,141- Male householders: 247 (42 living alone), Female householders: 208 (67 living alone)
232 spouses (232 opposite-sex spouses), 42 unmarried partners, (42 opposite-sex unmarried partners), 379 children (349 natural, 5 adopted, 23 stepchildren), 10 grandchildren, 0 brothers or sisters, 13 parents, 0 foster children, 4 other relatives, 0 non-relatives
Size of family households: 144 2-persons, 109 3-persons, 60 4-persons, 10 5-persons, 5 6-persons, 5 7-or-more-persons.
Size of nonfamily households: 113 1-person, 8 2-persons.
167 married couples with children.
73 single-parent households (18 men, 55 women).
92.3% of residents of Leland speak English at home.
3.5% of residents speak Spanish at home (66% speak English very well, 29% speak English well, 5% speak English not well).
2.9% of residents speak other Indo-European language at home (72% speak English very well, 28% speak English well).
0.2% of residents speak other language at home (100% speak English not well).
Foreign born population: 51 (4.5%)
(29.4% of them are naturalized citizens)
| Here: | 6.4 |
| State: | 6.4 |
| Here: | 5.1 |
| State: | 4.1 |

- Bedrooms in owner-occupied houses and condos in Leland, Illinois
- 0no bedroom
- 01 bedroom
- 602 bedrooms
- 2333 bedrooms
- 394 bedrooms
- 445+ bedrooms

- Bedrooms in renter-occupied apartments in Leland, Illinois
- 1no bedroom
- 31 bedroom
- 412 bedrooms
- 153 bedrooms
- 264 bedrooms
- 05+ bedrooms

- Cars and other vehicles available in Leland in owner-occupied houses/condos
- 32no vehicle
- 951 vehicle
- 1822 vehicles
- 313 vehicles
- 334 vehicles
- 35+ vehicles

- Cars and other vehicles available in Leland in renter-occupied apartments
- 4no vehicle
- 331 vehicle
- 392 vehicles
- 103 vehicles
- 04 vehicles
- 05+ vehicles

- Rooms in owner-occupied houses in Leland, Illinois
- 01 room
- 02 rooms
- 63 rooms
- 204 rooms
- 895 rooms
- 816 rooms
- 847 rooms
- 298 rooms
- 679+ rooms

- Rooms in renter-occupied apartments in Leland, Illinois
- 11 room
- 22 rooms
- 03 rooms
- 244 rooms
- 225 rooms
- 176 rooms
- 117 rooms
- 28 rooms
- 79+ rooms


Leland, IL household income distribution

- 42Less than $10,000
- 19$10,000 to $19,999
- 32$20,000 to $29,999
- 34$30,000 to $39,999
- 27$40,000 to $49,999
- 14$50,000 to $59,999
- 55$60,000 to $74,999
- 65$75,000 to $99,999
- 62$100,000 to $124,999
- 56$125,000 to $149,999
- 32$150,000 to $199,999
- 13$200,000 or more

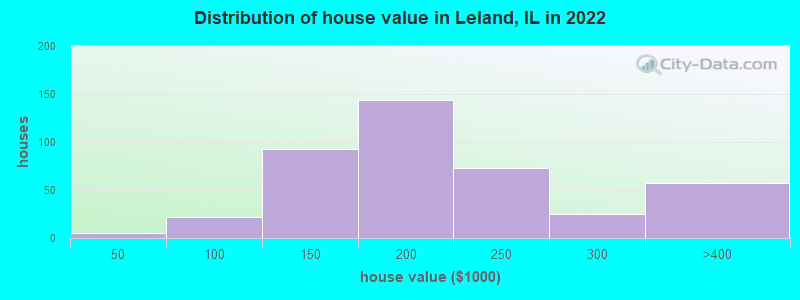
Home value of owner - occupied houses in 2022 in Leland, IL
-
- 4Less than $10,000
- 2$50,000 to $59,999
- 13$60,000 to $69,999
- 1$80,000 to $89,999
- 4$90,000 to $99,999
- 32$100,000 to $124,999
- 59$125,000 to $149,999
- 124$150,000 to $174,999
- 19$175,000 to $199,999
- 73$200,000 to $249,999
- 25$250,000 to $299,999
- 56$300,000 to $399,999
- 1$400,000 to $499,999
Rent paid by renters in 2022 in Leland, IL
-
- 1$400 to $449
- 0$450 to $499
- 18$700 to $749
- 16$750 to $799
- 3$800 to $899
- 5$900 to $999
- 11$1,000 to $1,249
- 21$1,250 to $1,499
- 9No cash rent


Percentage of workers working in this county: 32.2%
Number of people working at home: 40 (7.6% of all workers)
Travel time to work (commute)
- Less than 5 minutes: 41
- 5 to 9 minutes: 2
- 10 to 14 minutes: 32
- 15 to 19 minutes: 76
- 20 to 24 minutes: 43
- 25 to 29 minutes: 17
- 30 to 34 minutes: 72
- 35 to 39 minutes: 27
- 40 to 44 minutes: 13
- 45 to 59 minutes: 63
- 60 to 89 minutes: 48
- 90 or more minutes: 28
Means of transportation to work:
- Drove a car alone: 378 (84.8%)
- Carpooled: 41 (9.2%)
- Walked: 25 (5.6%)
- Worked at home: 2 (0.4%)

- Unemployment by race in 2022
- Unemployment rate for White non-Hispanic residents
- 9.7%Males
- 3.1%Females

- Year of entry for the foreign-born population in Leland, Illinois
- 82010 or later
- 142000 to 2009
- 141990 to 1999
- 11980 to 1989
- 21970 to 1979
- 9Before 1970

First ancestries reported:
- German: 52 (13.8%)
- Irish: 52 (13.8%)
- Norwegian: 44 (11.7%)
- American: 30 (8.0%)
- English: 30 (8.0%)
- French: 30 (8.0%)
- Italian: 27 (7.2%)
- Polish: 19 (5.1%)
- European: 14 (3.7%)
- Croatian: 7 (1.9%)
- Serbian: 6 (1.6%)
- Swedish: 5 (1.3%)
- Greek: 3 (0.8%)
- Czech: 2 (0.5%)
- Danish: 2 (0.5%)
- French Canadian: 2 (0.5%)
- Austrian: 1 (0.3%)
- Brazilian: 1 (0.3%)
- Dutch: 1 (0.3%)
Most common places of birth for foreign-born residents (%):
| Leland: | 54.8% (23) |
| Illinois: | 34.7% (626,958) |
| Leland: | 16.7% (7) |
| Illinois: | 6.9% (124,474) |
| Leland: | 4.8% (2) |
| Illinois: | 1.0% (18,753) |
| Leland: | 4.8% (2) |
| Illinois: | 0.0% (597) |
| Leland: | 4.8% (2) |
| Illinois: | 0.1% (1,913) |
| Leland: | 2.4% (1) |
| Illinois: | 0.5% (8,778) |
Place of birth for U.S.-born residents:
- This state: 986
- Other state: 103
- Northeast: 10
- Midwest: 53
- South: 29
- West: 6
93.1% of Leland residents lived in the same house 1 years ago.
Out of people who lived in different houses, 33.0% lived in this county.
Out of people who lived in different counties, 87.8% lived in Illinois.
| Leland: | 93.1% |
| State average: | 88.3% |
Education attainment for males 25 years and older:
- No schooling: 0
- Nursery to 4th grade: 0
- 5th and 6th grade: 0
- 7th and 8th grade: 4
- 9th grade: 0
- 10th grade: 0
- 11th grade: 0
- 12th grade, no diploma: 8
- High school graduate (or equivalency): 151
- Less than 1 year of college: 25
- Some college more than 1 year, no degree: 43
- Associate degree: 18
- Bachelor's degree: 75
- Master's degree: 51
- Professional school degree: 0
- Doctorate degree: 0

Education attainment for females 25 years and older:
- No schooling: 7
- Nursery to 4th grade: 0
- 5th and 6th grade: 0
- 7th and 8th grade: 2
- 9th grade: 0
- 10th grade: 0
- 11th grade: 12
- 12th grade, no diploma: 0
- High school graduate (or equivalency): 122
- Less than 1 year of college: 71
- Some college more than 1 year, no degree: 39
- Associate degree: 33
- Bachelor's degree: 121
- Master's degree: 28
- Professional school degree: 0
- Doctorate degree: 0


Housing units in structures:
- One, detached: 463
- Two: 9
- 3 or 4: 17
- 5 to 9: 9
- 10 to 19: 2
Housing units lacking complete kitchen facilities in 2022: 1.6%

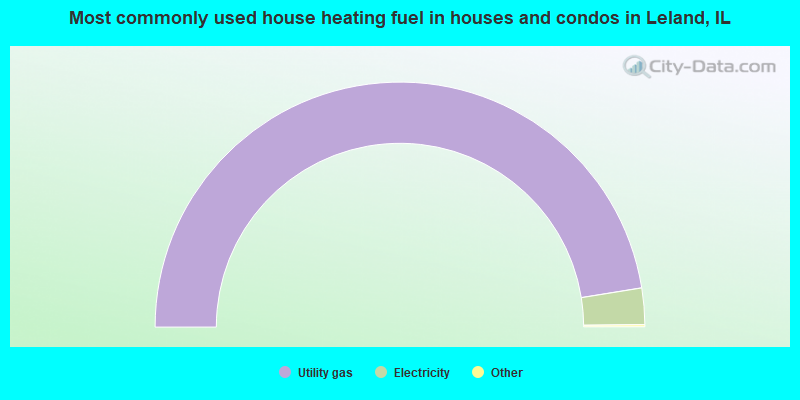
- 95.2%Utility gas
- 4.8%Electricity
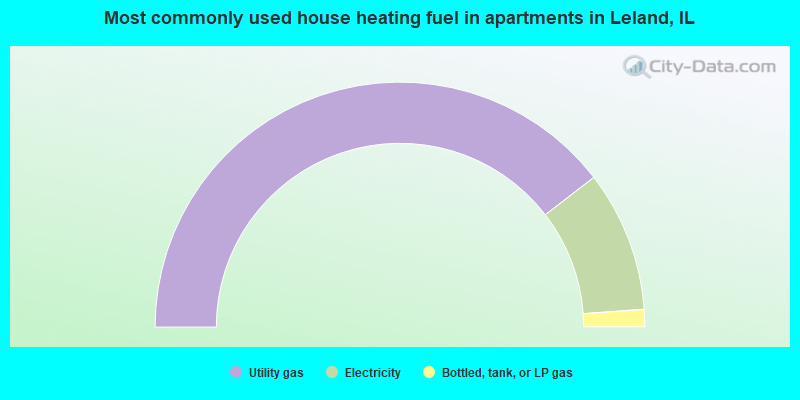
- 79.1%Utility gas
- 18.6%Electricity
- 2.3%Bottled, tank, or LP gas
Private vs. public school enrollment:
| Here: | 12.0% |
| Illinois: | 13.3% |
| Here: | 0.0% |
| Illinois: | 9.9% |
| Here: | 41.7% |
| Illinois: | 27.4% |


