Leland, NC (North Carolina) Houses and Residents
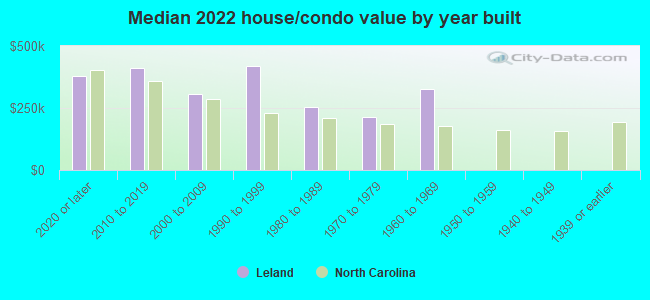
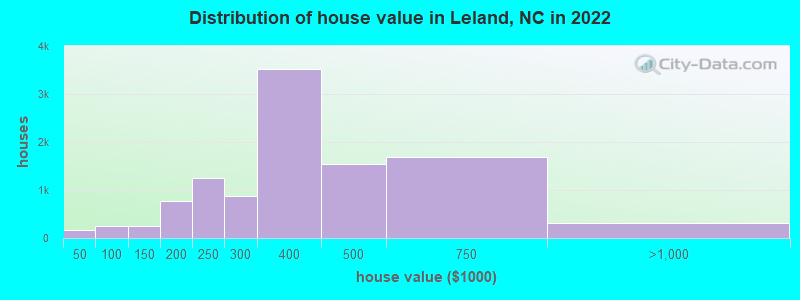
Estimated median house or condo value in 2022: $385,394 (it was $92,700 in 2000 )
Leland:
$385,394North Carolina:
$280,600
Lower value quartile - upper value quartile: $268,758 - $486,596Total population: 17,015 (Urban population: 1,529, Rural population: 387 (all nonfarm) )
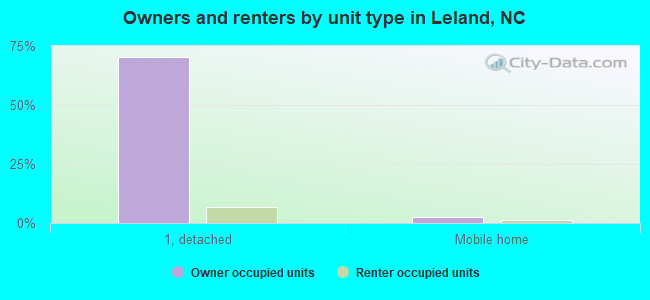
Houses: 12,085 (11,307 occupied: 9,972 owner occupied, 1,916 renter occupied )
% of renters here:
16%State:
33%
Housing density: 3,017 houses/condos per square mile
Median price asked for vacant for-sale houses and condos in 2022: $1,098,589.
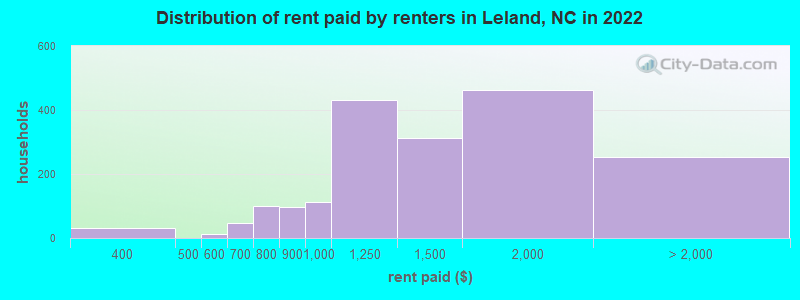
Median contract rent in 2022: $1,308 (lower quartile is $975, upper quartile is $1,877)
Median rent asked for vacant for-rent units in 2022: $3,584
Median gross rent in Leland, NC in 2022: $1,612
Housing units in Leland with a mortgage: 7,189 (492 second mortgage, 0 home equity loan, 487 both second mortgage and home equity loan )Houses without a mortgage: 143
Median household income for houses/condos with a mortgage: $93,708
Median household income for apartments without a mortgage: $79,520
Median monthly housing costs: $1,356
Data:
Median house or condo value ($)
Median house or condo value ($ change since 2000)
Median house or condo value ($) - White
Median house or condo value ($) - Black or African American
Median house or condo value ($) - Asian
Median house or condo value ($) - Hispanic or Latino
Median house or condo value ($) - American Indian and Alaska Native
Median house or condo value ($) - Multirace
Median house or condo value ($) - Other Race
Median price asked for mobile homes ($)
Household density (households per square mile)
Mean house or condo value by units in structure - 1, detached ($)
Mean house or condo value by units in structure - 1, attached ($)
Mean house or condo value by units in structure - 2 ($)
Mean house or condo value by units in structure by units in structure - 3 or 4 ($)
Mean house or condo value by units in structure - 5 or more ($)
Mean house or condo value by units in structure - Boat, RV, van, etc. ($)
Mean house or condo value by units in structure - Mobile home ($)
Median contract rent ($)
Median contract rent - Lower quartile ($)
Median contract rent - Upper quartile ($)
Median gross rent ($)
Urban houses (%)
Rural houses (%)
Houses occupied (%)
Houses occupied (% change since 2000)
Houses owner occupied (%)
Houses owner occupied (% change since 2000)
Houses renter occupied (%)
Houses renter occupied (% change since 2000)
Vacant housing units - For rent (%)
Vacant housing units - For rent (% change since 2000)
Vacant housing units - For sale only (%)
Vacant housing units - For sale only (% change since 2000)
Vacant housing units - Rented or sold, not occupied (%)
Vacant housing units - Rented or sold, not occupied (% change since 2000)
Vacant housing units - For seasonal, recreational, or occasional use (%)
Vacant housing units - For seasonal, recreational, or occasional use (% change since 2000)
Vacant housing units - For migrant workers (%)
Vacant housing units - For migrant workers (% change since 2000)
Vacant housing units - Other vacant (%)
Vacant housing units - Other vacant (% change since 2000)
Median monthly housing costs ($)
Median household income for houses/condos with a mortgage ($)
Median household income for houses/condos without a mortgage ($)
Median household income ($)
Median household income ($) - White
Median household income ($) - Black or African American
Median household income ($) - Asian
Median household income ($) - Hispanic or Latino
Median household income ($) - American Indian and Alaska Native
Median household income ($) - Multirace
Median household income ($) - Other Race
Mortgage status - with mortgage (%)
Mortgage status - with second mortgage (%)
Mortgage status - with home equity loan (%)
Mortgage status - with both second mortgage and home equity loan (%)
Mortgage status - without a mortgage (%)
Median year house/condo built
Median year apartment built
Household type by relationship - Male householder living alone (%)
Household type by relationship - Male householder not living alone (%)
Household type by relationship - Female householder living alone (%)
Household type by relationship - Female householder not living alone (%)
Household type by relationship - Opposite-Sex spouse (%)
Household type by relationship - Same-Sex spouse (%)
Household type by relationship - Opposite-Sex unmarried partner (%)
Household type by relationship - Same-Sex unmarried partner (%)
Household type by relationship - In group quarters (%)
Size of family households - 2-person household (%)
Size of family households - 3-person household (%)
Size of family households - 4-person household (%)
Size of family households - 5-person household (%)
Size of family households - 6-person household (%)
Size of family households - 7-or-more-person household (%)
Size of nonfamily households - 1-person household (%)
Size of nonfamily households - 2-person household (%)
Size of nonfamily households - 3-person household (%)
Size of nonfamily households - 4-person household (%)
Size of nonfamily households - 5-person household (%)
Size of nonfamily households - 6-person household (%)
Size of nonfamily households - 7-or-moreperson household (%)
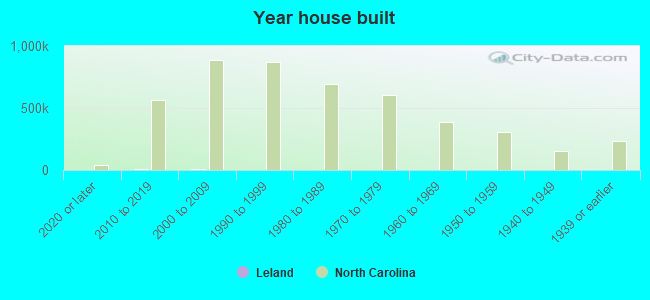
Year house built - Built 2010 or later (%)
Year house built - Built 2000 to 2009 (%)
Year house built - Built 1990 to 1999 (%)
Year house built - Built 1980 to 1989 (%)
Year house built - Built 1970 to 1979 (%)
Year house built - Built 1960 to 1969 (%)
Year house built - Built 1950 to 1959 (%)
Year house built - Built 1940 to 1949 (%)
Year house built - Built 1939 or earlier (%)
Median number of rooms in houses and condos
Median number of rooms in apartments
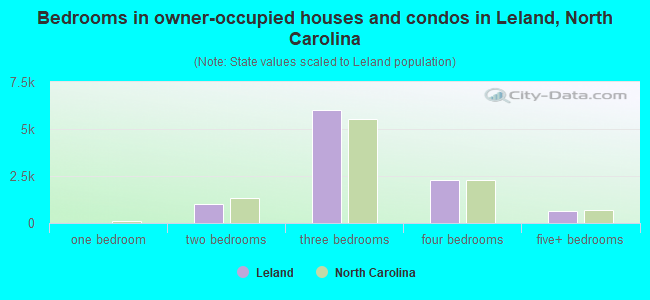
Median number of bedrooms in owner occupied houses
Mean number of bedrooms in owner occupied houses
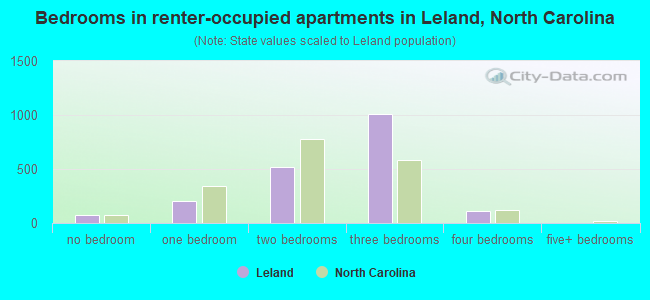
Median number of bedrooms in renter occupied houses
Mean number of bedrooms in renter occupied houses
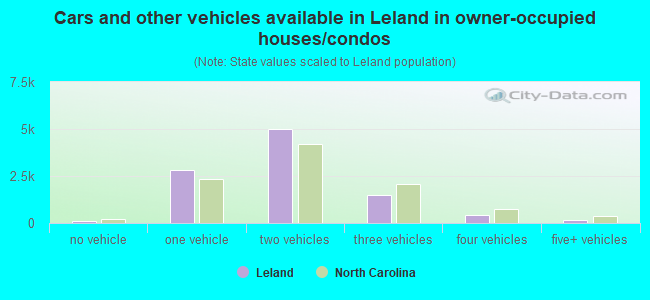
Median number of vehichles in owner occupied houses
Mean number of vehichles in owner occupied houses
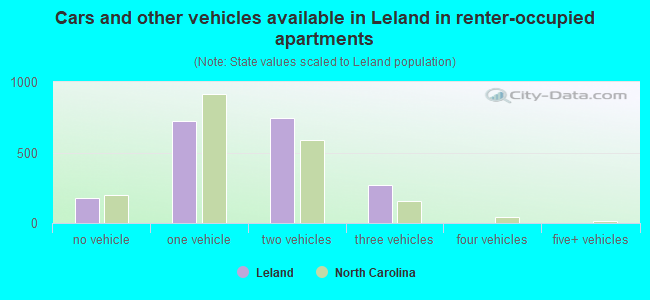
Median number of vehichles in renter occupied houses
Mean number of vehichles in renter occupied houses
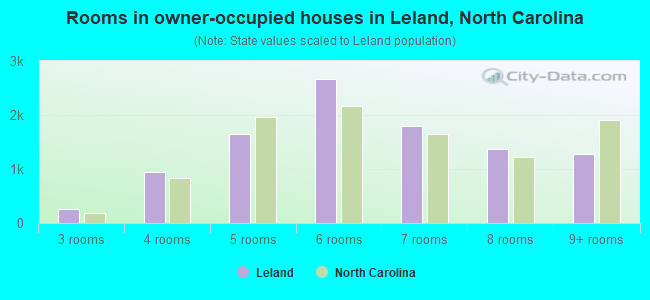
Rooms in owner-occupied houses - 1 room (%)
Rooms in owner-occupied houses - 2 rooms (%)
Rooms in owner-occupied houses - 3 rooms (%)
Rooms in owner-occupied houses - 4 rooms (%)
Rooms in owner-occupied houses - 5 rooms (%)
Rooms in owner-occupied houses - 6 rooms (%)
Rooms in owner-occupied houses - 7 rooms (%)
Rooms in owner-occupied houses - 8 rooms (%)
Rooms in owner-occupied houses - 9+ rooms (%)
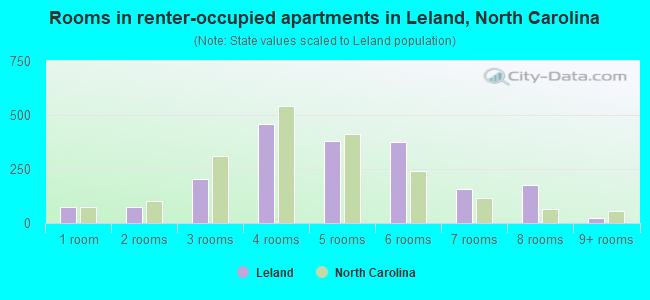
Rooms in renter-occupied houses - 1 room (%)
Rooms in renter-occupied houses - 2 rooms (%)
Rooms in renter-occupied houses - 3 rooms (%)
Rooms in renter-occupied houses - 4 rooms (%)
Rooms in renter-occupied houses - 5 rooms (%)
Rooms in renter-occupied houses - 6 rooms (%)
Rooms in renter-occupied houses - 7 rooms (%)
Rooms in renter-occupied houses - 8 rooms (%)
Rooms in renter-occupied houses - 9+ rooms (%)
Bedrooms in owner-occupied houses - no bedrooms (%)
Bedrooms in owner-occupied houses - 1 bedroom (%)
Bedrooms in owner-occupied houses - 2 bedrooms (%)
Bedrooms in owner-occupied houses - 3 bedrooms (%)
Bedrooms in owner-occupied houses - 4 bedrooms (%)
Bedrooms in owner-occupied houses - 5+ bedrooms (%)
Bedrooms in renter-occupied houses - no bedrooms (%)
Bedrooms in renter-occupied houses - 1 bedroom (%)
Bedrooms in renter-occupied houses - 2 bedrooms (%)
Bedrooms in renter-occupied houses - 3 bedrooms (%)
Bedrooms in renter-occupied houses - 4 bedrooms (%)
Bedrooms in renter-occupied houses - 5+ bedrooms (%)
Vehicles available in owner-occupied houses - no vehicle available (%)
Vehicles available in owner-occupied houses - 1 vehicle available(%)
Vehicles available in owner-occupied houses - 2 Vehicles available (%)
Vehicles available in owner-occupied houses - 3 Vehicles available (%)
Vehicles available in owner-occupied houses - 4 Vehicles available (%)
Vehicles available in owner-occupied houses - 5+ Vehicles available (%)
Vehicles available in renter-occupied houses - no vehicle available (%)
Vehicles available in renter-occupied houses - 1 vehicle available (%)
Vehicles available in renter-occupied houses - 2 Vehicles available (%)
Vehicles available in renter-occupied houses - 3 Vehicles available (%)
Vehicles available in renter-occupied houses - 4 Vehicles available (%)
Vehicles available in renter-occupied houses - 5+ Vehicles available (%)
Housing units in structures - 1, detached (%)
Housing units in structures - 1, attached (%)
Housing units in structures - 2 (%)
Housing units in structures - 3 or 4 (%)
Housing units in structures - 5 to 9 (%)
Housing units in structures - 10 to 19 (%)
Housing units in structures - 20 to 49 (%)
Housing units in structures - 50 or more (%)
Housing units in structures - Mobile home (%)
Housing units in structures - Boat, RV, van, etc. (%)
Housing units in structures - Owners - 1, detached (%)
Housing units in structures - Owners - 1, attached (%)
Housing units in structures - Owners - 2 (%)
Housing units in structures - Owners - 3 or 4 (%)
Housing units in structures - Owners - 5 to 9 (%)
Housing units in structures - Owners - 10 to 19 (%)
Housing units in structures - Owners - 20 to 49 (%)
Housing units in structures - Owners - 50 or more (%)
Housing units in structures - Owners - Mobile home (%)
Housing units in structures - Owners - Boat, RV, van, etc. (%)
Housing units in structures - Renters - 1, detached (%)
Housing units in structures - Renters - 1, attached (%)
Housing units in structures - Renters - 2 (%)
Housing units in structures - Renters - 3 or 4 (%)
Housing units in structures - Renters - 5 to 9 (%)
Housing units in structures - Renters - 10 to 19 (%)
Housing units in structures - Renters - 20 to 49 (%)
Housing units in structures - Renters - 50 or more (%)
Housing units in structures - Renters - Mobile home (%)
Housing units in structures - Renters - Boat, RV, van, etc. (%)
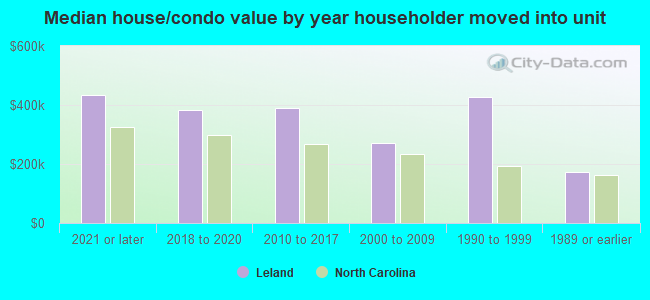
House/condo owner moved in on average (years ago)
Renter moved in on average (years ago)
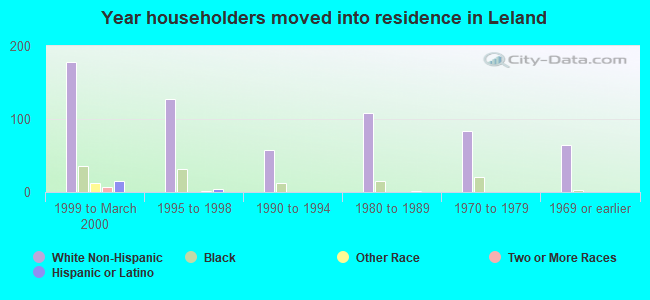
Year householder moved into unit - Moved in 1999 to March 2000 (%)
Year householder moved into unit - Moved in 1999 to March 2000 (%) - White
Year householder moved into unit - Moved in 1999 to March 2000 (%) - Black or African American
Year householder moved into unit - Moved in 1999 to March 2000 (%) - Asian
Year householder moved into unit - Moved in 1999 to March 2000 (%) - Hispanic or Latino
Year householder moved into unit - Moved in 1999 to March 2000 (%) - American Indian and Alaska Native
Year householder moved into unit - Moved in 1999 to March 2000 (%) - Multirace
Year householder moved into unit - Moved in 1999 to March 2000 (%) - Other Race
Year householder moved into unit - Moved in 1995 to 1998 (%)
Year householder moved into unit - Moved in 1995 to 1998 (%) - White
Year householder moved into unit - Moved in 1995 to 1998 (%) - Black or African American
Year householder moved into unit - Moved in 1995 to 1998 (%) - Asian
Year householder moved into unit - Moved in 1995 to 1998 (%) - Hispanic or Latino
Year householder moved into unit - Moved in 1995 to 1998 (%) - American Indian and Alaska Native
Year householder moved into unit - Moved in 1995 to 1998 (%) - Multirace
Year householder moved into unit - Moved in 1995 to 1998 (%) - Other Race
Year householder moved into unit - Moved in 1990 to 1994 (%)
Year householder moved into unit - Moved in 1990 to 1994 (%) - White
Year householder moved into unit - Moved in 1990 to 1994 (%) - Black or African American
Year householder moved into unit - Moved in 1990 to 1994 (%) - Asian
Year householder moved into unit - Moved in 1990 to 1994 (%) - Hispanic or Latino
Year householder moved into unit - Moved in 1990 to 1994 (%) - American Indian and Alaska Native
Year householder moved into unit - Moved in 1990 to 1994 (%) - Multirace
Year householder moved into unit - Moved in 1990 to 1994 (%) - Other Race
Year householder moved into unit - Moved in 1980 to 1989 (%)
Year householder moved into unit - Moved in 1980 to 1989 (%) - White
Year householder moved into unit - Moved in 1980 to 1989 (%) - Black or African American
Year householder moved into unit - Moved in 1980 to 1989 (%) - Asian
Year householder moved into unit - Moved in 1980 to 1989 (%) - Hispanic or Latino
Year householder moved into unit - Moved in 1980 to 1989 (%) - American Indian and Alaska Native
Year householder moved into unit - Moved in 1980 to 1989 (%) - Multirace
Year householder moved into unit - Moved in 1980 to 1989 (%) - Other Race
Year householder moved into unit - Moved in 1970 to 1979 (%)
Year householder moved into unit - Moved in 1970 to 1979 (%) - White
Year householder moved into unit - Moved in 1970 to 1979 (%) - Black or African American
Year householder moved into unit - Moved in 1970 to 1979 (%) - Asian
Year householder moved into unit - Moved in 1970 to 1979 (%) - Hispanic or Latino
Year householder moved into unit - Moved in 1970 to 1979 (%) - American Indian and Alaska Native
Year householder moved into unit - Moved in 1970 to 1979 (%) - Multirace
Year householder moved into unit - Moved in 1970 to 1979 (%) - Other Race
Year householder moved into unit - Moved in 1969 or earlier (%)
Year householder moved into unit - Moved in 1969 or earlier (%) - White
Year householder moved into unit - Moved in 1969 or earlier (%) - Black or African American
Year householder moved into unit - Moved in 1969 or earlier (%) - Asian
Year householder moved into unit - Moved in 1969 or earlier (%) - Hispanic or Latino
Year householder moved into unit - Moved in 1969 or earlier (%) - American Indian and Alaska Native
Year householder moved into unit - Moved in 1969 or earlier (%) - Multirace
Year householder moved into unit - Moved in 1969 or earlier (%) - Other Race
Housing units lacking complete plumbing facilities (%)
Housing units lacking complete kitchen facilities (%)
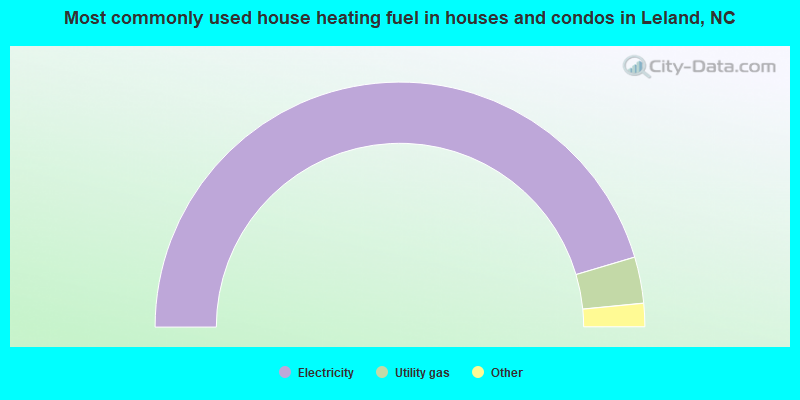
House heating fuel used in houses and condos - Utility gas (%)
House heating fuel used in houses and condos - Bottled, tank, or LP gas (%)
House heating fuel used in houses and condos - Electricity (%)
House heating fuel used in houses and condos - Fuel oil, kerosene, etc. (%)
House heating fuel used in houses and condos - Coal or coke (%)
House heating fuel used in houses and condos - Wood (%)
House heating fuel used in houses and condos - Solar energy (%)
House heating fuel used in houses and condos - Other fuel (%)
House heating fuel used in houses and condos - No fuel used (%)
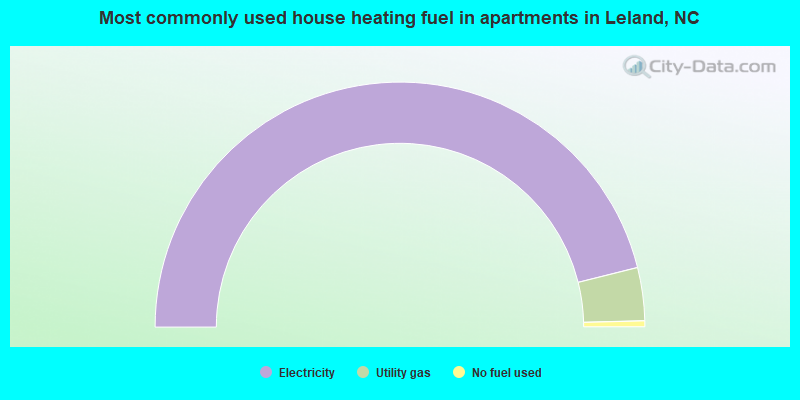
House heating fuel used in apartments - Utility gas (%)
House heating fuel used in apartments - Bottled, tank, or LP gas (%)
House heating fuel used in apartments - Electricity (%)
House heating fuel used in apartments - Fuel oil, kerosene, etc. (%)
House heating fuel used in apartments - Coal or coke (%)
House heating fuel used in apartments - Wood (%)
House heating fuel used in apartments - Solar energy (%)
House heating fuel used in apartments - Other fuel (%)
House heating fuel used in apartments - No fuel used (%)
Latest news about housing in Leland, NC collected exclusively by city-data.com from local newspapers, TV, and radio stations
Median year house/condo built: 2011Median year apartment built: 2006Household type by relationship:
Households: 26,810
Male householders: 5,429 (954 living alone ), Female householders: 5,989 (2,074 living alone )6,518 spouses (6,497 opposite-sex spouses ), 614 unmarried partners , (614 opposite-sex unmarried partners ), 6,432 children (5,883 natural , 66 adopted , 482 stepchildren ), 444 grandchildren , 150 brothers or sisters , 158 parents , 0 foster children , 325 other relatives , 747 non-relatives
Size of family households: 4,713 2-persons , 1,384 3-persons , 1,126 4-persons , 713 5-persons , 331 6-persons , 22 7-or-more-persons .
Size of nonfamily households: 3,186 1-person , 373 2-persons , 46 3-persons , 61 5-persons .
3,334 married couples with children. single-parent households (135 men , 519 women ).
94.3% of residents of Leland speak English at home. of residents speak Spanish at home (70% speak English very well , 20% speak English well , 8% speak English not well , 2% don't speak English at all ).of residents speak other Indo-European language at home (88% speak English very well , 5% speak English well , 7% speak English not well ).of residents speak Asian or Pacific Island language at home (76% speak English very well , 24% speak English well ).of residents speak other language at home (100% speak English very well ).
Foreign born population: 637 (2.4%)of them are naturalized citizens )
Median number of rooms in houses and condos:
Median number of rooms in apartments
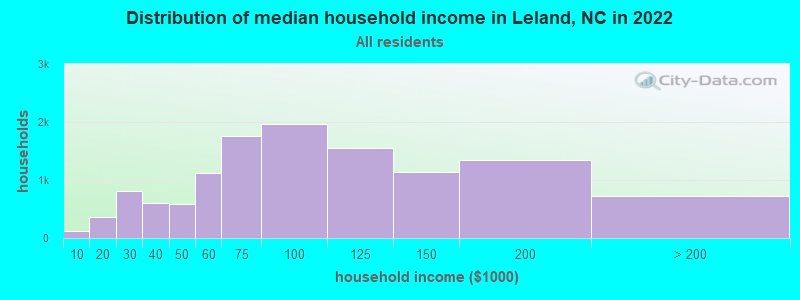
Leland, NC household income distribution 118 Less than $10,000355 $10,000 to $19,999816 $20,000 to $29,999609 $30,000 to $39,999590 $40,000 to $49,9991,113 $50,000 to $59,9991,762 $60,000 to $74,9991,961 $75,000 to $99,9991,554 $100,000 to $124,9991,142 $125,000 to $149,9991,339 $150,000 to $199,999727 $200,000 or more
Home value of owner - occupied houses in 2022 in Leland, NC 60 Less than $10,00013 $20,000 to $24,99912 $25,000 to $29,99926 $35,000 to $39,99946 $40,000 to $49,999106 $50,000 to $59,9996 $60,000 to $69,99951 $70,000 to $79,99939 $90,000 to $99,99922 $100,000 to $124,999234 $125,000 to $149,999289 $150,000 to $174,999488 $175,000 to $199,9991,260 $200,000 to $249,999878 $250,000 to $299,9993,529 $300,000 to $399,9991,538 $400,000 to $499,9991,685 $500,000 to $749,999249 $750,000 to $999,99953 $1,000,000 to $1,499,999Rent paid by renters in 2022 in Leland, NC 31 $350 to $39911 $550 to $59947 $650 to $69967 $700 to $74933 $750 to $79996 $800 to $899112 $900 to $999429 $1,000 to $1,249314 $1,250 to $1,499463 $1,500 to $1,999212 $2,000 to $2,49939 No cash rent
Percentage of workers working in this county: 40.0%Number of people working at home: 1,526 (13.5% of all workers )
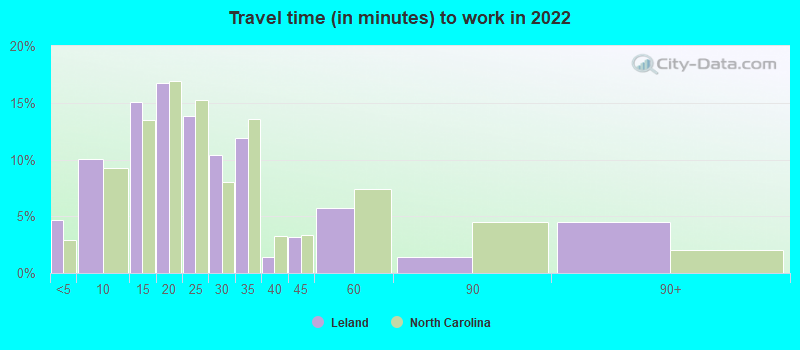
Travel time to work (commute)
Less than 5 minutes: 1925 to 9 minutes: 68910 to 14 minutes: 93715 to 19 minutes: 2,11120 to 24 minutes: 2,13425 to 29 minutes: 1,03730 to 34 minutes: 2,32835 to 39 minutes: 56340 to 44 minutes: 25545 to 59 minutes: 28660 to 89 minutes: 9090 or more minutes: 187
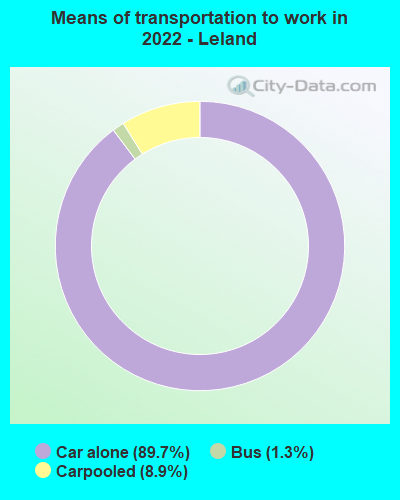
Means of transportation to work:
Drove a car alone: 5,325 (72.0%)Carpooled: 553 (7.5%)Bus : 52 (0.7%)Taxi: 3 (0.0%)Walked: 4 (0.1%)Worked at home: 1,526 (20.6%)
Unemployment by race in 2022
Unemployment rate for White non-Hispanic residents 0.7% Males4.8% FemalesUnemployment rate for Black residents 5.2% MalesUnemployment rate for two or more race residents 13.6% Males8.9% Females
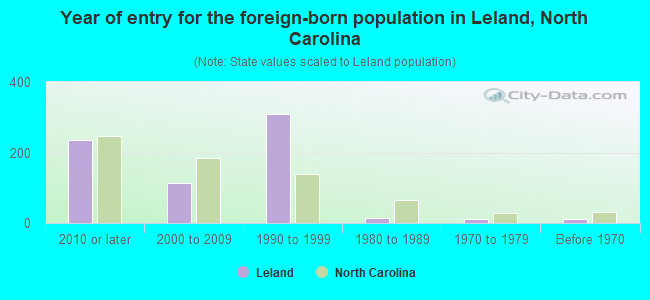
Year of entry for the foreign-born population in Leland, North Carolina
235 2010 or later 114 2000 to 2009 310 1990 to 1999 13 1980 to 1989 10 1970 to 1979 10 Before 1970
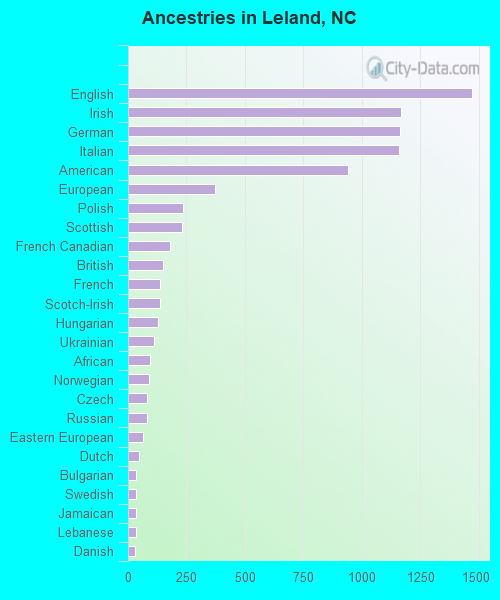
First ancestries reported:
English: 1,470 (12.6%)
Irish: 1,167 (10.0%)
German: 1,161 (9.9%)
Italian: 1,160 (9.9%)
American: 941 (8.0%)
European: 373 (3.2%)
Polish: 234 (2.0%)
Scottish: 232 (2.0%)
French Canadian: 178 (1.5%)
British: 149 (1.3%)
French: 137 (1.2%)
Scotch-Irish: 137 (1.2%)
Hungarian: 129 (1.1%)
Ukrainian: 110 (0.9%)
African: 94 (0.8%)
Norwegian: 89 (0.8%)
Czech: 83 (0.7%)
Russian: 82 (0.7%)
Eastern European: 66 (0.6%)
Dutch: 46 (0.4%)
Bulgarian: 35 (0.3%)
Swedish: 35 (0.3%)
Jamaican: 34 (0.3%)
Lebanese: 33 (0.3%)
Danish: 29 (0.2%)
Scandinavian: 25 (0.2%)
Pennsylvania German: 23 (0.2%)
Canadian: 19 (0.2%)
Slovak: 17 (0.1%)
Romanian: 15 (0.1%)
Welsh: 14 (0.1%)
Swiss: 12 (0.1%)
Lithuanian: 11 (0.09%)
Yugoslavian: 9 (0.08%) Most common places of birth for foreign-born residents (%): Mexico Leland:
13.0% (140)North Carolina:
24.7% (214,776)
Germany Leland:
12.8% (137)North Carolina:
1.8% (15,534)
Italy Leland:
7.9% (85)North Carolina:
0.5% (4,315)
Venezuela Leland:
6.6% (71)North Carolina:
1.2% (9,986)
Philippines Leland:
6.1% (66)North Carolina:
2.4% (20,695)
Poland Leland:
5.6% (60)North Carolina:
0.4% (3,607)
Dominican Republic Leland:
5.5% (59)North Carolina:
1.7% (15,135)
Ukraine Leland:
5.1% (55)North Carolina:
0.8% (6,645)
China, excluding Hong Kong and Taiwan Leland:
4.5% (48)North Carolina:
3.2% (27,477)
United Kingdom, excluding England and Scotland Leland:
4.4% (47)North Carolina:
1.1% (9,831)
Canada Leland:
4.3% (46)North Carolina:
2.1% (18,105)
France Leland:
3.4% (37)North Carolina:
0.4% (3,292)
Sweden Leland:
2.1% (23)North Carolina:
0.2% (1,544)
England Leland:
1.9% (20)North Carolina:
1.2% (10,140)
Lebanon Leland:
1.8% (19)North Carolina:
0.3% (2,422)
Czechoslovakia (includes Czech Republic and Slovakia) Leland:
1.6% (17)North Carolina:
0.2% (1,445)
Place of birth for U.S.-born residents:
This state: 9,552Other state: 16,255Northeast: 7,513Midwest: 3,170South: 4,356West: 1,165 89.7% of Leland residents lived in the same house 1 years ago.
Out of people who lived in different houses, 19.2% lived in this county.
Out of people who lived in different counties, 66.2% lived in North Carolina.
Leland:
89.7%State average:
87.3%
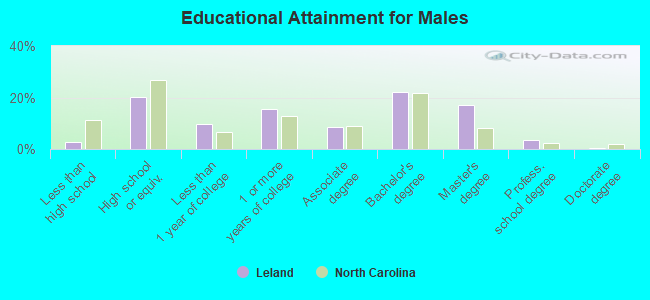
Education attainment for males 25 years and older:
No schooling: 19Nursery to 4th grade: 05th and 6th grade: 07th and 8th grade: 399th grade: 010th grade: 3011th grade: 7612th grade, no diploma: 107High school graduate (or equivalency): 2,133Less than 1 year of college: 1,016Some college more than 1 year, no degree: 1,648Associate degree: 916Bachelor's degree: 2,310Master's degree: 1,786Professional school degree: 368Doctorate degree: 39
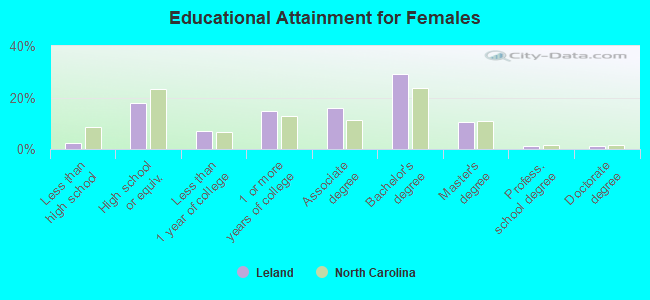
Education attainment for females 25 years and older:
No schooling: 22Nursery to 4th grade: 05th and 6th grade: 127th and 8th grade: 09th grade: 1610th grade: 2711th grade: 6112th grade, no diploma: 95High school graduate (or equivalency): 1,962Less than 1 year of college: 779Some college more than 1 year, no degree: 1,598Associate degree: 1,744Bachelor's degree: 3,188Master's degree: 1,162Professional school degree: 119Doctorate degree: 121
Housing units in structures:
One, detached: 8,989One, attached: 1,321Two: 103 or 4: 705 to 9: 16410 to 19: 29220 to 49: 30750 or more: 144Mobile homes: 784Median worth of mobile homes: $133,560
Housing units lacking complete plumbing facilities in 2022: 0.4%Housing units lacking complete kitchen facilities in 2022: 0.4%House/condo owner moved in on average 5 years ago
Renter moved in on average 1 years ago
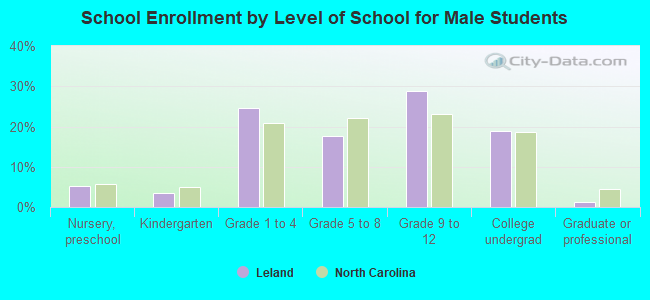
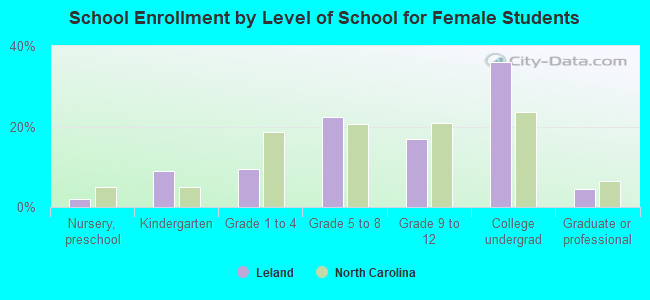
Private vs. public school enrollment:
Students in private schools in grades 1 to 8 (elementary and middle school): 495 Here:
25.5%North Carolina:
13.8%
Students in private schools in grades 9 to 12 (high school): 263 Here:
21.8%North Carolina:
11.9%
Students in private undergraduate colleges: 77 Here:
5.3%North Carolina:
19.3%