Lewiston, ME (Maine) Houses and Residents
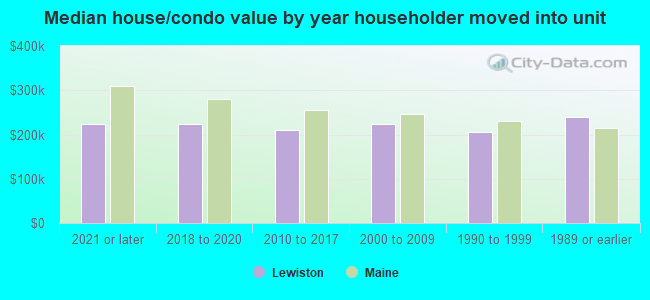
| Lewiston: | $222,157 |
| Maine: | $290,600 |
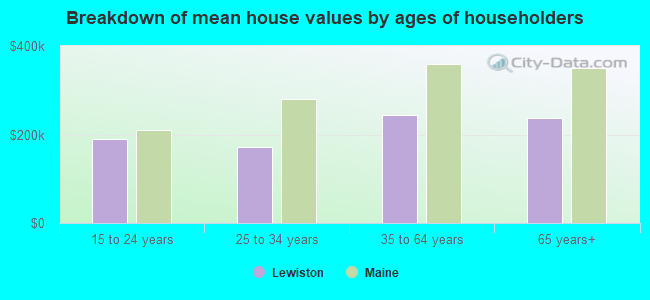
Mean price in 2022:
Detached houses: $250,938
Here: $250,938 State: $364,324 Townhouses or other attached units: $215,780
Here: $215,780 State: $496,775 In 2-unit structures: $183,224
Here: $183,224 State: $349,654 In 3-to-4-unit structures: $194,570
Here: $194,570 State: $366,418 In 5-or-more-unit structures: $121,242
Here: $121,242 State: $342,001 Mobile homes: $120,548
Here: $120,548 State: $142,980
Total population: 36,299 (Urban population: 32,072, Rural population: 3,618 (all nonfarm))
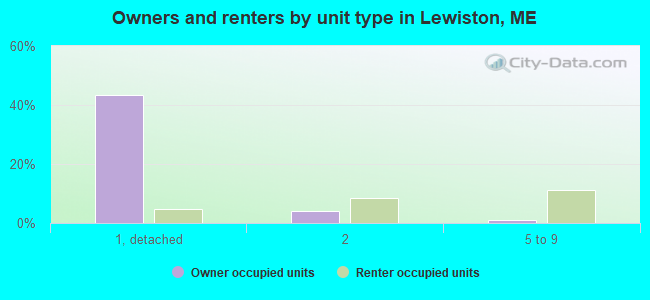
Houses: 16,874 (15,750 occupied: 7,793 owner occupied, 7,956 renter occupied)
| % of renters here: | 51% |
| State: | 26% |
Housing density: 495 houses/condos per square mile
Median price asked for vacant for-sale houses and condos in 2022: $239,518.
Median contract rent in 2022: $854 (lower quartile is $708, upper quartile is $1,067)
Median rent asked for vacant for-rent units in 2022: $1,612
Median gross rent in Lewiston, ME in 2022: $963
Housing units in Lewiston with a mortgage: 5,211 (386 second mortgage, 0 home equity loan, 372 both second mortgage and home equity loan)
Houses without a mortgage: 156
Median household income for houses/condos with a mortgage: $82,432
Median household income for apartments without a mortgage: $67,516
Median monthly housing costs: $972
Compare current foreclosures near Lewiston, ME:
| Photo | Address | Area | Beds / Baths | Price | Details |
|---|---|---|---|---|---|

|
#1
Warren Ave
Lewiston, ME 04240
|
1,200 sq. feet
|
1 baths 3 beds |
show details | |

|
#2
Summit Ave
Lewiston, ME 04240
|
- sq. feet
|
1 baths 3 beds |
show details | |

|
#3
Main St
Lewiston, ME 04240
|
- sq. feet
|
1 baths 3 beds |
show details | |

|
#4
Bartlett St
Lewiston, ME 04240
|
- sq. feet
|
- baths - beds |
show details | |

|
#5
Spring St Apt 2
Lewiston, ME 04240
|
- sq. feet
|
- baths - beds |
show details | |

|
#6
Rideout Ave Apt 1
Lewiston, ME 04240
|
- sq. feet
|
- baths - beds |
show details | |

|
#7
River Rd
Lewiston, ME 04240
|
- sq. feet
|
- baths - beds |
show details | |

|
#8
Autumn Ln
Lewiston, ME 04240
|
- sq. feet
|
- baths - beds |
show details | |

|
#9
School St
Lewiston, ME 04240
|
- sq. feet
|
- baths - beds |
show details | |

|
#10
Brault St
Lewiston, ME 04240
|
- sq. feet
|
- baths - beds |
show details |
| Photo | Address | Area | Beds / Baths | Price | Details |
|---|---|---|---|---|---|

|
#11
Elm St
Mechanic Falls, ME 04256
|
1,872 sq. feet
|
2 baths 3 beds |
show details | |

|
#12
Jillson Rd
Greene, ME 04236
|
1,356 sq. feet
|
1 baths 4 beds |
show details | |

|
#13
Pownal Rd
Auburn, ME 04210
|
1,099 sq. feet
|
1 baths 2 beds |
show details | |

|
#14
Anita Ave
Auburn, ME 04210
|
2,016 sq. feet
|
1 baths 3 beds |
show details | |

|
#15
Stevens Mill Rd
Auburn, ME 04210
|
1,547 sq. feet
|
2 baths 4 beds |
show details | |

|
#16
Minot Ave
Auburn, ME 04210
|
1,444 sq. feet
|
1 baths 3 beds |
show details | |

|
#17
Poland Rd
Auburn, ME 04210
|
1,153 sq. feet
|
1 baths 3 beds |
show details | |

|
#18
Richards Ln
Freeport, ME 04032
|
3,334 sq. feet
|
2 baths 4 beds |
show details | |

|
#19
Cressey Rd
Monmouth, ME 04259
|
2,503 sq. feet
|
2 baths 4 beds |
show details | |

|
#20
Xivray St
Auburn, ME 04210
|
2,632 sq. feet
|
1 baths - beds |
show details |
| Photo | Address | Area | Beds / Baths | Price | Details |
|---|---|---|---|---|---|

|
#21
Webster Corner Rd
Sabattus, ME 04280
|
1,619 sq. feet
|
1 baths - beds |
show details | |

|
#22
Marsh Rd
Sabattus, ME 04280
|
1,932 sq. feet
|
2 baths - beds |
show details | |

|
#23
Yarmouth Rd
Gray, ME 04039
|
- sq. feet
|
- baths - beds |
show details | |

|
#24
Durham Rd
Freeport, ME 04032
|
- sq. feet
|
- baths - beds |
show details | |

|
#25
Winter St Apt 2
Topsham, ME 04086
|
- sq. feet
|
- baths - beds |
show details | |

|
#26
Back St
Hebron, ME 04238
|
1,340 sq. feet
|
- baths - beds |
show details | |

|
#27
River View Dr
Oxford, ME 04270
|
- sq. feet
|
- baths - beds |
show details | |

|
#28
Stone Brook Rd
Mechanic Falls, ME 04256
|
- sq. feet
|
- baths - beds |
show details | |

|
#29
White Rd
Bowdoinham, ME 04008
|
- sq. feet
|
- baths - beds |
show details | |

|
#30
Sabattus Creek Dr
Lisbon, ME 04250
|
- sq. feet
|
- baths - beds |
show details |
| Photo | Address | Area | Beds / Baths | Price | Details |
|---|---|---|---|---|---|

|
#31
Riverside Dr # 650
Auburn, ME 04210
|
- sq. feet
|
- baths - beds |
show details | |

|
#32
Belmont Ct, Unit 8
Auburn, ME 04210
|
- sq. feet
|
- baths - beds |
show details | |

|
#33
Sweeping Oak Ln
Durham, ME 04222
|
- sq. feet
|
- baths - beds |
show details | |

|
#34
White Rd
Bowdoinham, ME 04008
|
- sq. feet
|
- baths - beds |
show details | |

|
#35
Reservoir Rd
South Paris, ME 04281
|
- sq. feet
|
- baths - beds |
show details | |

|
#36
High St
Buckfield, ME 04220
|
- sq. feet
|
- baths - beds |
show details | |

|
#37
River Common Rd
Sabattus, ME 04280
|
- sq. feet
|
- baths - beds |
show details | |

|
#38
Fairview Ave
Gray, ME 04039
|
- sq. feet
|
- baths - beds |
show details | |

|
#39
County Rd
Turner, ME 04282
|
- sq. feet
|
- baths - beds |
show details | |

|
#40
Woodside Dr
Lisbon, ME 04250
|
- sq. feet
|
- baths - beds |
show details |
| Photo | Address | Area | Beds / Baths | Price | Details |
|---|---|---|---|---|---|

|
#41
Cornerstone Dr
Bowdoin, ME 04287
|
- sq. feet
|
- baths - beds |
show details | |

|
#42
Spring St
Lisbon, ME 04250
|
- sq. feet
|
- baths - beds |
show details | |

|
#43
Adelard Dr
Brunswick, ME 04011
|
- sq. feet
|
- baths - beds |
show details | |

|
#44
Magnum Dr
Turner, ME 04282
|
- sq. feet
|
- baths - beds |
show details | |

|
#45
Wing St
Lisbon Falls, ME 04252
|
- sq. feet
|
- baths - beds |
show details | |

|
#46
Pond Rd
Sabattus, ME 04280
|
- sq. feet
|
- baths - beds |
show details | |

|
Check over 1 million property listings on Foreclosure.com!
|
browse all offers | |||

Latest news about housing in Lewiston, ME collected exclusively by city-data.com from local newspapers, TV, and radio stations


Median year apartment built: 1951
Household type by relationship:
Households: 38,079- Male householders: 8,101 (2,953 living alone), Female householders: 7,717 (3,008 living alone)
6,012 spouses (5,859 opposite-sex spouses), 1,569 unmarried partners, (1,525 opposite-sex unmarried partners), 9,417 children (8,676 natural, 238 adopted, 502 stepchildren), 847 grandchildren, 134 brothers or sisters, 307 parents, 0 foster children, 582 other relatives, 940 non-relatives
- In group quarters: 2,448
Size of family households: 4,098 2-persons, 2,154 3-persons, 1,478 4-persons, 764 5-persons, 191 6-persons, 224 7-or-more-persons.
Size of nonfamily households: 5,100 1-person, 1,378 2-persons, 26 3-persons, 152 4-persons.
3,372 married couples with children.
2,754 single-parent households (881 men, 1,873 women).
78.5% of residents of Lewiston speak English at home.
1.3% of residents speak Spanish at home (85% speak English very well, 14% speak English well).
12.9% of residents speak other Indo-European language at home (77% speak English very well, 20% speak English well, 4% speak English not well).
1.8% of residents speak Asian or Pacific Island language at home (59% speak English very well, 13% speak English well, 28% speak English not well).
5.0% of residents speak other language at home (60% speak English very well, 22% speak English well, 11% speak English not well, 7% don't speak English at all).
Foreign born population: 3,658 (9.6%)
(60.6% of them are naturalized citizens)
| Here: | 6.0 |
| State: | 6.1 |
| Here: | 4.2 |
| State: | 4.0 |
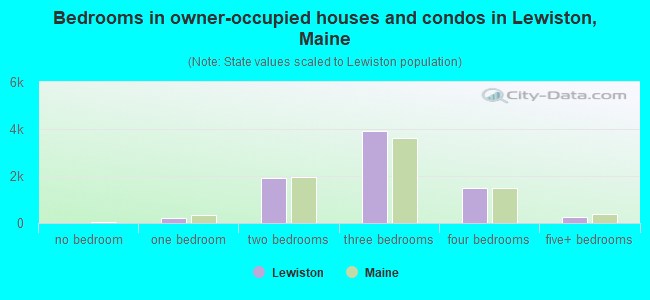
- Bedrooms in owner-occupied houses and condos in Lewiston, Maine
- 0no bedroom
- 2271 bedroom
- 1,9112 bedrooms
- 3,9243 bedrooms
- 1,4734 bedrooms
- 2595+ bedrooms
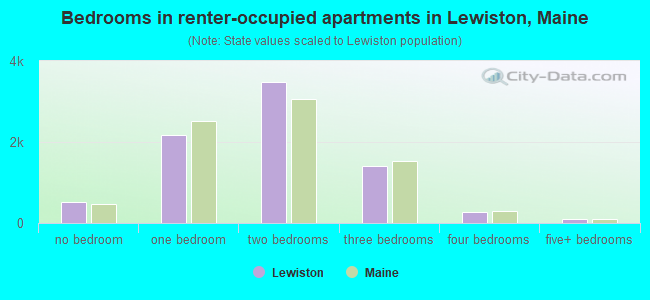
- Bedrooms in renter-occupied apartments in Lewiston, Maine
- 522no bedroom
- 2,1661 bedroom
- 3,4912 bedrooms
- 1,4023 bedrooms
- 2704 bedrooms
- 1055+ bedrooms
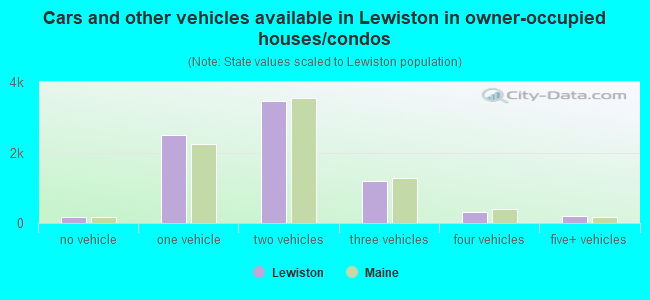
- Cars and other vehicles available in Lewiston in owner-occupied houses/condos
- 160no vehicle
- 2,4861 vehicle
- 3,4642 vehicles
- 1,1873 vehicles
- 2984 vehicles
- 1995+ vehicles
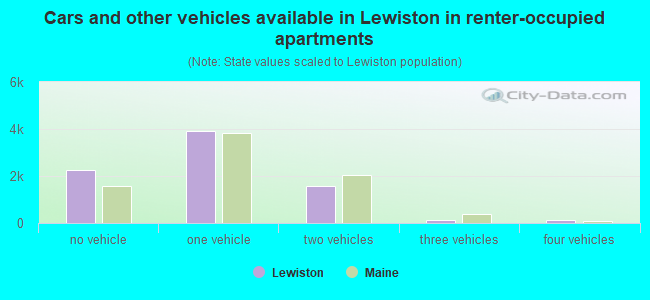
- Cars and other vehicles available in Lewiston in renter-occupied apartments
- 2,250no vehicle
- 3,8991 vehicle
- 1,5682 vehicles
- 1083 vehicles
- 1314 vehicles
- 05+ vehicles
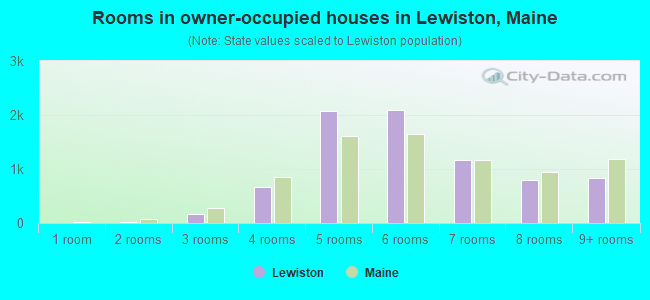
- Rooms in owner-occupied houses in Lewiston, Maine
- 01 room
- 142 rooms
- 1613 rooms
- 6634 rooms
- 2,0825 rooms
- 2,0846 rooms
- 1,1667 rooms
- 7918 rooms
- 8319+ rooms
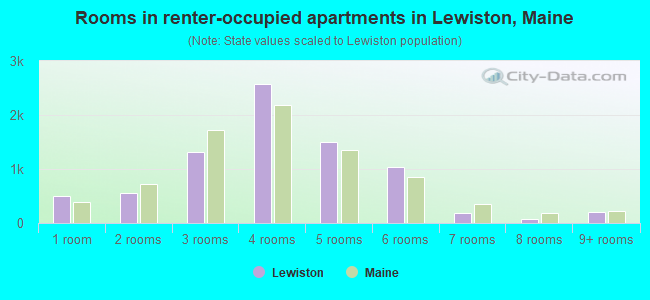
- Rooms in renter-occupied apartments in Lewiston, Maine
- 5091 room
- 5532 rooms
- 1,3163 rooms
- 2,5764 rooms
- 1,5075 rooms
- 1,0376 rooms
- 1787 rooms
- 718 rooms
- 2109+ rooms
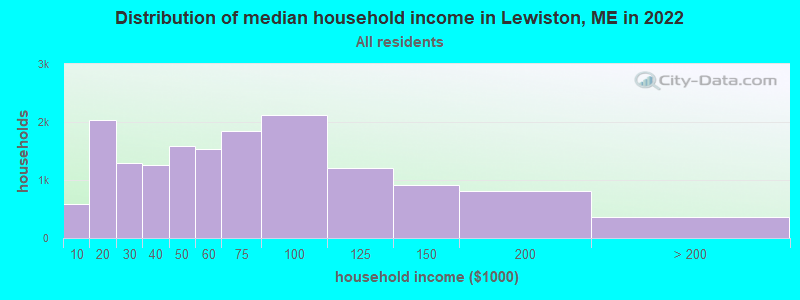
Lewiston, ME household income distribution

- 587Less than $10,000
- 2,039$10,000 to $19,999
- 1,294$20,000 to $29,999
- 1,261$30,000 to $39,999
- 1,593$40,000 to $49,999
- 1,530$50,000 to $59,999
- 1,845$60,000 to $74,999
- 2,114$75,000 to $99,999
- 1,206$100,000 to $124,999
- 910$125,000 to $149,999
- 802$150,000 to $199,999
- 365$200,000 or more
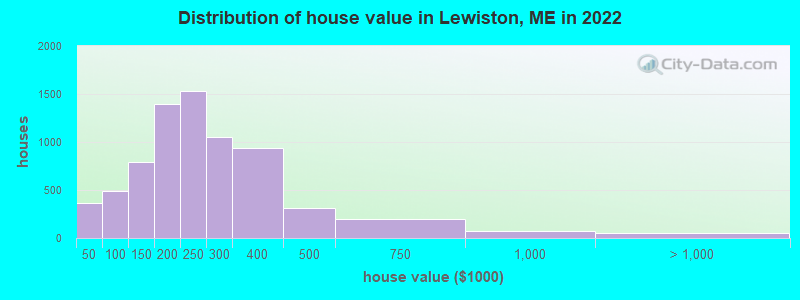
Home value of owner - occupied houses in 2022 in Lewiston, ME
-
- 95Less than $10,000
- 67$10,000 to $14,999
- 104$15,000 to $19,999
- 19$20,000 to $24,999
- 10$25,000 to $29,999
- 50$30,000 to $34,999
- 16$40,000 to $49,999
- 15$50,000 to $59,999
- 66$60,000 to $69,999
- 121$70,000 to $79,999
- 175$80,000 to $89,999
- 95$90,000 to $99,999
- 499$100,000 to $124,999
- 287$125,000 to $149,999
- 621$150,000 to $174,999
- 779$175,000 to $199,999
- 1,527$200,000 to $249,999
- 1,048$250,000 to $299,999
- 935$300,000 to $399,999
- 310$400,000 to $499,999
- 201$500,000 to $749,999
- 74$750,000 to $999,999
- 9$1,500,000 to $1,999,999
- 43$2,000,000 or more
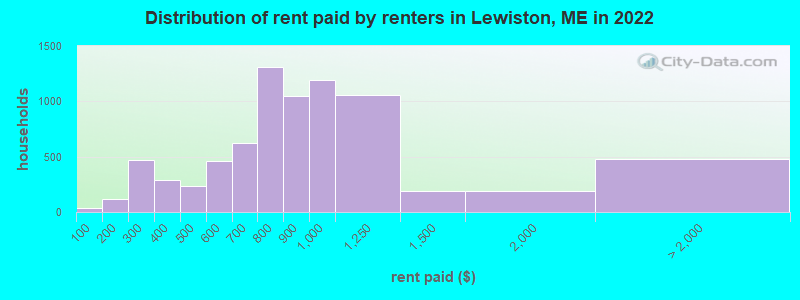
Rent paid by renters in 2022 in Lewiston, ME
-
- 40Less than $100
- 67$100 to $149
- 52$150 to $199
- 145$200 to $249
- 326$250 to $299
- 162$300 to $349
- 129$350 to $399
- 172$400 to $449
- 60$450 to $499
- 141$500 to $549
- 315$550 to $599
- 272$600 to $649
- 348$650 to $699
- 552$700 to $749
- 756$750 to $799
- 1,049$800 to $899
- 1,192$900 to $999
- 1,055$1,000 to $1,249
- 187$1,250 to $1,499
- 192$1,500 to $1,999
- 83$2,500 to $2,999
- 396No cash rent
Percentage of workers working in this county: 76.2%
Number of people working at home: 2,160 (12.1% of all workers)
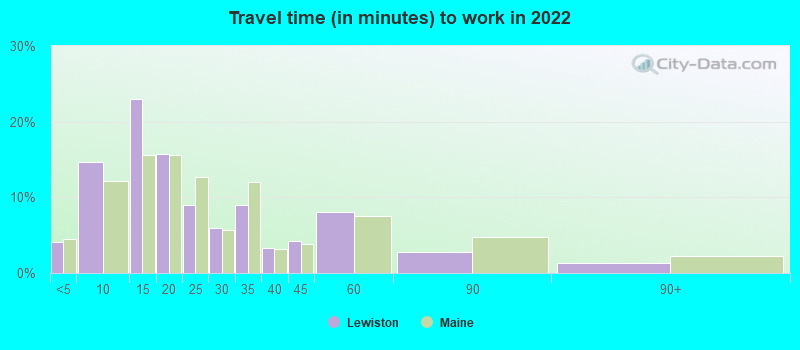
Travel time to work (commute)
- Less than 5 minutes: 757
- 5 to 9 minutes: 3,162
- 10 to 14 minutes: 3,780
- 15 to 19 minutes: 2,151
- 20 to 24 minutes: 1,101
- 25 to 29 minutes: 502
- 30 to 34 minutes: 808
- 35 to 39 minutes: 833
- 40 to 44 minutes: 885
- 45 to 59 minutes: 1,579
- 60 to 89 minutes: 766
- 90 or more minutes: 80
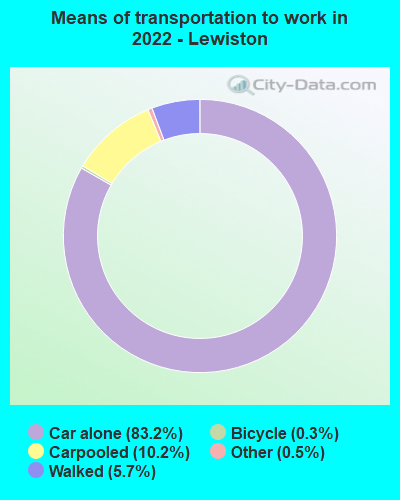
Means of transportation to work:
- Drove a car alone: 16,677 (73.3%)
- Carpooled: 2,003 (8.8%)
- Bus: 23 (0.1%)
- Taxi: 133 (0.6%)
- Bicycle: 112 (0.5%)
- Walked: 1,245 (5.5%)
- Worked at home: 2,160 (9.5%)
- Unemployment by race in 2022
- Unemployment rate for White non-Hispanic residents
- 5.3%Males
- 6.6%Females
- Unemployment rate for Black residents
- 2.9%Males
- 13.0%Females
- Unemployment rate for Asian residents
- 33.5%Males
- Unemployment rate for other race residents
- 34.2%Females
- Unemployment rate for Hispanic or Latino residents
- 8.5%Females
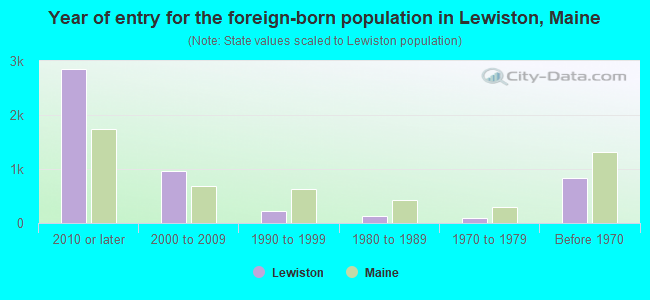
- Year of entry for the foreign-born population in Lewiston, Maine
- 2,8562010 or later
- 9642000 to 2009
- 2181990 to 1999
- 1261980 to 1989
- 901970 to 1979
- 827Before 1970
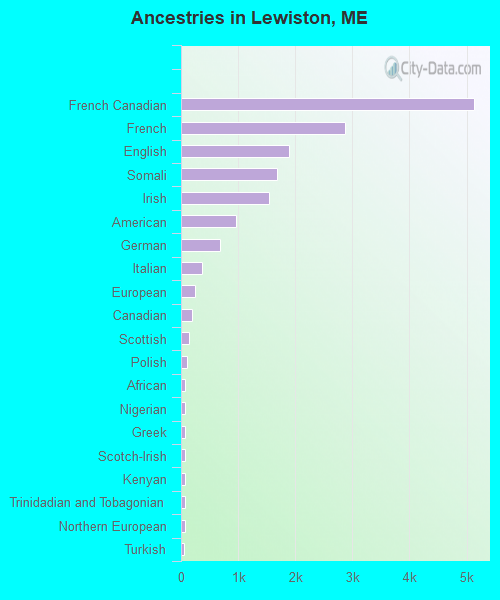
First ancestries reported:
- French Canadian: 5,136 (25.3%)
- French: 2,871 (14.1%)
- English: 1,892 (9.3%)
- Somali: 1,686 (8.3%)
- Irish: 1,535 (7.6%)
- American: 957 (4.7%)
- German: 678 (3.3%)
- Italian: 368 (1.8%)
- European: 242 (1.2%)
- Canadian: 192 (0.9%)
- Scottish: 146 (0.7%)
- Polish: 106 (0.5%)
- African: 77 (0.4%)
- Nigerian: 73 (0.4%)
- Greek: 67 (0.3%)
- Scotch-Irish: 67 (0.3%)
- Kenyan: 66 (0.3%)
- Trinidadian and Tobagonian: 66 (0.3%)
- Northern European: 65 (0.3%)
- Turkish: 51 (0.3%)
- Belgian: 45 (0.2%)
- British: 43 (0.2%)
- Ukrainian: 43 (0.2%)
- Welsh: 43 (0.2%)
- Norwegian: 34 (0.2%)
- Zimbabwean: 31 (0.2%)
- Finnish: 23 (0.1%)
- Swedish: 21 (0.1%)
- Scandinavian: 20 (0.10%)
- Arab: 19 (0.09%)
- Lithuanian: 18 (0.09%)
- Russian: 15 (0.07%)
- Ethiopian: 13 (0.06%)
- Jamaican: 12 (0.06%)
- Portuguese: 9 (0.04%)
- Eastern European: 8 (0.04%)
- Serbian: 2 (0.01%)
Most common places of birth for foreign-born residents (%):
| Lewiston: | 31.2% (1,212) |
| Maine: | 5.2% (2,702) |
| Lewiston: | 16.4% (636) |
| Maine: | 2.9% (1,521) |
| Lewiston: | 8.3% (324) |
| Maine: | 2.8% (1,472) |
| Lewiston: | 8.2% (318) |
| Maine: | 1.1% (590) |
| Lewiston: | 6.6% (258) |
| Maine: | 4.6% (2,392) |
| Lewiston: | 5.7% (221) |
| Maine: | 18.9% (9,810) |
| Lewiston: | 4.6% (177) |
| Maine: | 0.6% (286) |
| Lewiston: | 3.0% (117) |
| Maine: | 0.3% (153) |
| Lewiston: | 2.8% (110) |
| Maine: | 1.6% (841) |
| Lewiston: | 2.5% (96) |
| Maine: | 0.3% (143) |
| Lewiston: | 2.3% (88) |
| Maine: | 3.9% (2,005) |
| Lewiston: | 2.0% (79) |
| Maine: | 2.0% (1,020) |
| Lewiston: | 1.9% (74) |
| Maine: | 0.8% (421) |
Place of birth for U.S.-born residents:
- This state: 24,420
- Other state: 9,504
- Northeast: 6,347
- Midwest: 743
- South: 1,782
- West: 677
83.1% of Lewiston residents lived in the same house 1 years ago.
Out of people who lived in different houses, 38.1% lived in this county.
Out of people who lived in different counties, 56.0% lived in Maine.
| Lewiston: | 83.1% |
| State average: | 89.7% |
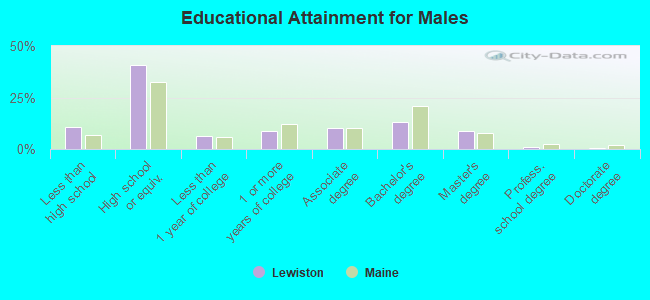
Education attainment for males 25 years and older:
- No schooling: 303
- Nursery to 4th grade: 50
- 5th and 6th grade: 88
- 7th and 8th grade: 323
- 9th grade: 78
- 10th grade: 70
- 11th grade: 190
- 12th grade, no diploma: 218
- High school graduate (or equivalency): 5,106
- Less than 1 year of college: 818
- Some college more than 1 year, no degree: 1,090
- Associate degree: 1,256
- Bachelor's degree: 1,631
- Master's degree: 1,075
- Professional school degree: 140
- Doctorate degree: 53
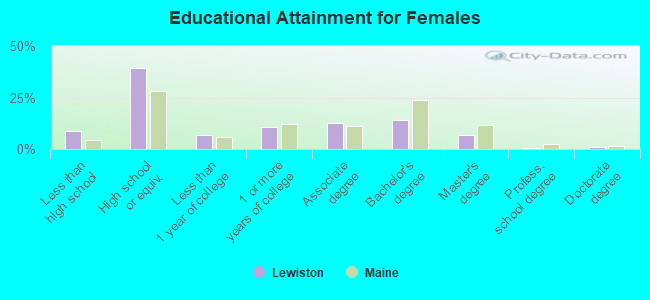
Education attainment for females 25 years and older:
- No schooling: 390
- Nursery to 4th grade: 10
- 5th and 6th grade: 56
- 7th and 8th grade: 202
- 9th grade: 93
- 10th grade: 108
- 11th grade: 106
- 12th grade, no diploma: 202
- High school graduate (or equivalency): 5,264
- Less than 1 year of college: 889
- Some college more than 1 year, no degree: 1,427
- Associate degree: 1,694
- Bachelor's degree: 1,923
- Master's degree: 910
- Professional school degree: 44
- Doctorate degree: 117
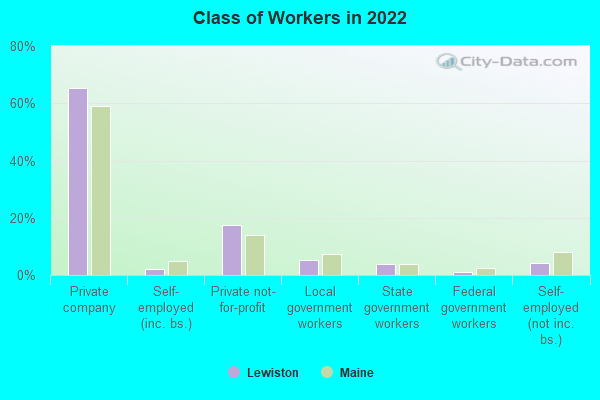
Housing units in structures:
- One, detached: 7,290
- One, attached: 210
- Two: 2,284
- 3 or 4: 1,668
- 5 to 9: 2,804
- 10 to 19: 1,082
- 20 to 49: 670
- 50 or more: 355
- Mobile homes: 506
Median worth of mobile homes: $55,078
Housing units lacking complete kitchen facilities in 2022: 2.9%
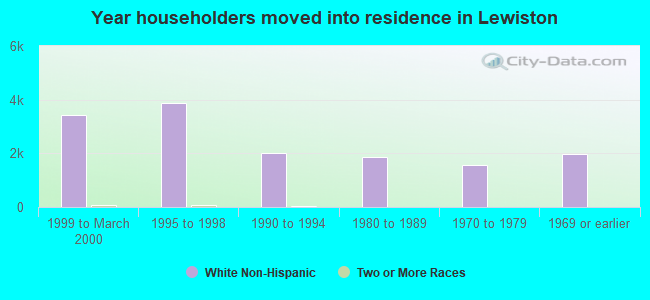
House/condo owner moved in on average 14 years ago
Renter moved in on average 4 years ago
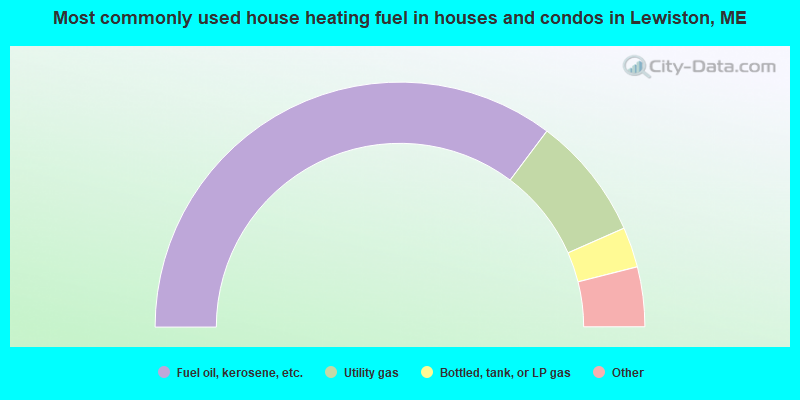
- 70.5%Fuel oil, kerosene, etc.
- 16.3%Utility gas
- 5.3%Bottled, tank, or LP gas
- 2.9%Electricity
- 2.2%Wood
- 2.1%Other fuel
- 0.5%Solar energy
- 0.1%No fuel used
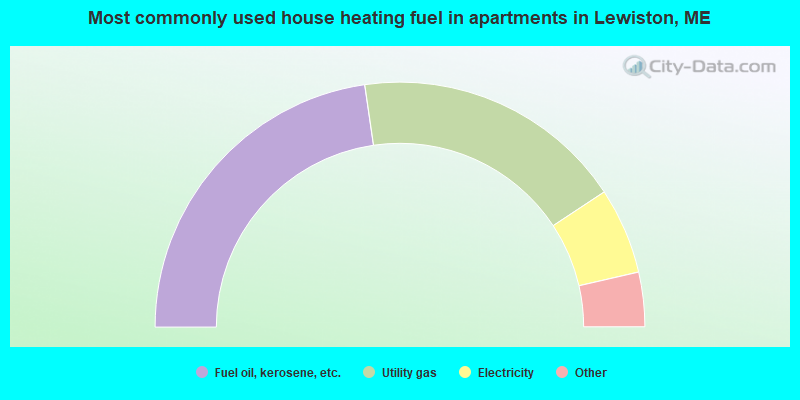
- 45.4%Fuel oil, kerosene, etc.
- 36.0%Utility gas
- 11.4%Electricity
- 2.7%Bottled, tank, or LP gas
- 2.5%No fuel used
- 1.8%Other fuel
- 0.2%Coal or coke
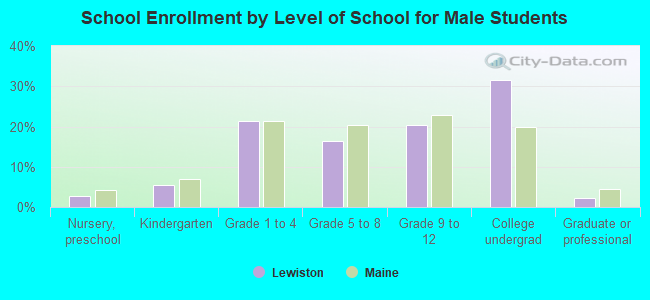
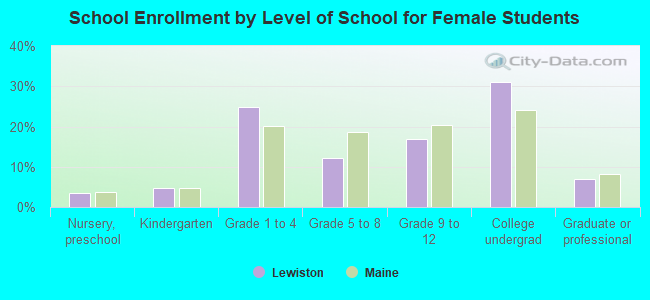
Private vs. public school enrollment:
| Here: | 12.7% |
| Maine: | 12.7% |
| Here: | 10.3% |
| Maine: | 12.6% |
| Here: | 63.0% |
| Maine: | 34.5% |