Lexington Hills, CA (California) Houses and Residents
| Lexington Hills: | $1,315,378 |
| California: | $715,900 |
Total population: 2,421 (Urban population: 2,111, Rural population: 285 (all nonfarm))
Houses: 980 (901 occupied: 760 owner occupied, 138 renter occupied)
| % of renters here: | 15% |
| State: | 44% |
Housing density: 220 houses/condos per square mile
Median price asked for vacant for-sale houses and condos in 2022 in this county: $2,273,258.
Median contract rent in 2022: over $2,000 (lower quartile is $1,898, upper quartile is over $2,000)
Median rent asked for vacant for-rent units in 2022: $2,164
Median gross rent in Lexington Hills, CA in 2022: over $2,000
Housing units in Lexington Hills with a mortgage: 587 (68 second mortgage, 0 home equity loan, 50 both second mortgage and home equity loan)
Houses without a mortgage: 0
Median household income for houses/condos with a mortgage: $253,538
Median household income for apartments without a mortgage: $164,209
Median monthly housing costs: $3,833
Compare current foreclosures near Lexington Hills, CA:
| Photo | Address | Area | Beds / Baths | Price | Details |
|---|---|---|---|---|---|

|
#1
Stonegate Cir
San Jose, CA 95110
|
468 sq. feet
|
1 baths 1 beds |
$479,900
|
show details |

|
#2
San Vicente Ter
Santa Cruz, CA 95060
|
- sq. feet
|
1 baths 2 beds |
$220,000
|
show details |

|
#3
Migues Mountain Ln
Aptos, CA 95003
|
4,500 sq. feet
|
2 baths 3 beds |
show details | |

|
#4
Clayton Ave
San Jose, CA 95110
|
1,024 sq. feet
|
3 baths 6 beds |
show details | |

|
#5
Hazel Ct
Soquel, CA 95073
|
3,071 sq. feet
|
3 baths 4 beds |
show details | |

|
#6
Selva Dr
San Jose, CA 95148
|
1,826 sq. feet
|
2 baths 4 beds |
show details | |

|
#7
Via Maria
San Jose, CA 95139
|
1,462 sq. feet
|
2 baths 3 beds |
show details | |

|
#8
Enos Ln
Watsonville, CA 95076
|
2,179 sq. feet
|
2 baths 3 beds |
show details | |

|
#9
Calmor Ave Apt 3
San Jose, CA 95123
|
903 sq. feet
|
1 baths 2 beds |
show details | |

|
#10
Kendrick Cir
San Jose, CA 95121
|
1,444 sq. feet
|
2 baths 3 beds |
show details |
| Photo | Address | Area | Beds / Baths | Price | Details |
|---|---|---|---|---|---|

|
#11
Bellwood Dr
Santa Clara, CA 95054
|
2,010 sq. feet
|
2 baths 5 beds |
show details | |

|
#12
Westbranch Dr
San Jose, CA 95148
|
1,450 sq. feet
|
2 baths 4 beds |
show details | |

|
#13
Cove Ct
San Jose, CA 95148
|
1,106 sq. feet
|
2 baths 3 beds |
show details | |

|
#14
Pinemont Dr
Campbell, CA 95008
|
1,675 sq. feet
|
2 baths 4 beds |
show details | |

|
#15
Sunny Meadow Ln
San Jose, CA 95135
|
1,990 sq. feet
|
2 baths 4 beds |
show details | |

|
#16
Phinney Pl
San Jose, CA 95139
|
2,347 sq. feet
|
3 baths 5 beds |
show details | |

|
#17
Western Avenue
Boulder Creek, CA 95006
|
1,468 sq. feet
|
2 baths 2 beds |
show details | |

|
#18
Sutphen St
Santa Cruz, CA 95060
|
1,147 sq. feet
|
2 baths 3 beds |
show details | |

|
#19
Bahr Dr
Ben Lomond, CA 95005
|
2,231 sq. feet
|
3 baths 4 beds |
show details | |

|
#20
Diamond Ave
San Jose, CA 95127
|
1,206 sq. feet
|
1 baths 3 beds |
show details |
| Photo | Address | Area | Beds / Baths | Price | Details |
|---|---|---|---|---|---|

|
#21
Hall Ranch Rd
Santa Cruz, CA 95065
|
1,534 sq. feet
|
2 baths 2 beds |
show details | |

|
#22
Carmen Ct
San Jose, CA 95121
|
1,452 sq. feet
|
2 baths 4 beds |
show details | |

|
#23
Woodhaven Dr
San Jose, CA 95127
|
992 sq. feet
|
1 baths 3 beds |
show details | |

|
#24
E Julian St
San Jose, CA 95112
|
1,488 sq. feet
|
2 baths 3 beds |
show details | |

|
#25
Nicasio Ct
San Jose, CA 95127
|
2,000 sq. feet
|
2 baths 4 beds |
show details | |

|
#26
Bowers Ave
Santa Clara, CA 95051
|
1,315 sq. feet
|
2 baths 4 beds |
show details | |

|
#27
E Mission St Unit 115
San Jose, CA 95112
|
1,253 sq. feet
|
1 baths 1 beds |
show details | |

|
#28
Phinney Pl
San Jose, CA 95139
|
2,347 sq. feet
|
3 baths 5 beds |
show details | |

|
#29
Chapman St
San Jose, CA 95126
|
920 sq. feet
|
1 baths 3 beds |
show details | |

|
#30
Jeanne Ave
San Jose, CA 95116
|
1,654 sq. feet
|
2 baths 4 beds |
show details |
| Photo | Address | Area | Beds / Baths | Price | Details |
|---|---|---|---|---|---|

|
#31
Benton St
Santa Clara, CA 95051
|
1,564 sq. feet
|
2 baths 4 beds |
show details | |

|
#32
Firenze Ct
San Jose, CA 95138
|
3,880 sq. feet
|
4 baths 5 beds |
show details | |

|
#33
Pomeroy Ave
Santa Clara, CA 95051
|
1,564 sq. feet
|
2 baths 4 beds |
show details | |

|
#34
Bowers Ave
Santa Clara, CA 95051
|
1,158 sq. feet
|
2 baths 4 beds |
show details | |

|
#35
Morse St
San Jose, CA 95126
|
1,998 sq. feet
|
1 baths 4 beds |
show details | |

|
#36
Cabrillo Ave
Santa Clara, CA 95050
|
1,368 sq. feet
|
2 baths 3 beds |
show details | |

|
#37
Morse St
San Jose, CA 95126
|
1,304 sq. feet
|
1 baths 2 beds |
show details | |

|
#38
Drexel Way
San Jose, CA 95121
|
1,703 sq. feet
|
2 baths 4 beds |
show details | |

|
#39
Citrus Grove Ct
San Jose, CA 95121
|
1,286 sq. feet
|
2 baths 4 beds |
show details | |

|
#40
Martha St
San Jose, CA 95112
|
814 sq. feet
|
1 baths 2 beds |
show details |
| Photo | Address | Area | Beds / Baths | Price | Details |
|---|---|---|---|---|---|

|
#41
Angmar Ct
San Jose, CA 95121
|
1,838 sq. feet
|
2 baths 3 beds |
show details | |

|
#42
Kimball Dr
San Jose, CA 95121
|
1,444 sq. feet
|
2 baths 3 beds |
show details | |

|
#43
Woodman Ct
San Jose, CA 95121
|
1,703 sq. feet
|
2 baths 4 beds |
show details | |

|
#44
Idlewood Dr
San Jose, CA 95121
|
1,232 sq. feet
|
2 baths 3 beds |
show details | |

|
#45
Thornmill Way
San Jose, CA 95121
|
2,134 sq. feet
|
2 baths 6 beds |
show details | |

|
#46
Silver Ranch Ln
San Jose, CA 95138
|
2,265 sq. feet
|
4 baths 4 beds |
show details | |

|
#47
Migues Mountain Ln
Aptos, CA 95003
|
2,106 sq. feet
|
2 baths 3 beds |
show details | |

|
#48
Mclaughlin Ave
San Jose, CA 95122
|
1,236 sq. feet
|
2 baths 3 beds |
show details | |

|
#49
Eulalie Dr
San Jose, CA 95121
|
1,618 sq. feet
|
2 baths 4 beds |
show details | |

|
Check over 1 million property listings on Foreclosure.com!
|
browse all offers | |||


Median year apartment built: 1947
Household type by relationship:
Households: 2,525- Male householders: 530 (21 living alone), Female householders: 338 (61 living alone)
673 spouses (673 opposite-sex spouses), 67 unmarried partners, (67 opposite-sex unmarried partners), 807 children (807 natural, 0 adopted, 0 stepchildren), 13 grandchildren, 0 brothers or sisters, 0 parents, 7 foster children, 0 other relatives, 74 non-relatives
- In group quarters: 12
Size of family households: 271 2-persons, 283 3-persons, 142 4-persons, 50 5-persons.
Size of nonfamily households: 91 1-person, 45 2-persons, 7 5-persons.
482 married couples with children.
51 single-parent households (30 men, 21 women).
83.0% of residents of Lexington Hills speak English at home.
2.0% of residents speak Spanish at home (100% speak English very well).
9.0% of residents speak other Indo-European language at home (84% speak English very well, 16% speak English well).
2.8% of residents speak Asian or Pacific Island language at home (100% speak English very well).
1.2% of residents speak other language at home (100% speak English very well).
Foreign born population: 360 (14.3%)
(50.3% of them are naturalized citizens)
| Here: | 6.1 |
| State: | 6.0 |
| Here: | 3.2 |
| State: | 3.9 |

- Bedrooms in owner-occupied houses and condos in Lexington Hills, California
- 28no bedroom
- 331 bedroom
- 1502 bedrooms
- 3723 bedrooms
- 1484 bedrooms
- 275+ bedrooms

- Bedrooms in renter-occupied apartments in Lexington Hills, California
- 16no bedroom
- 581 bedroom
- 582 bedrooms
- 73 bedrooms
- 04 bedrooms
- 05+ bedrooms

- Cars and other vehicles available in Lexington Hills in owner-occupied houses/condos
- 15no vehicle
- 471 vehicle
- 2952 vehicles
- 2653 vehicles
- 724 vehicles
- 665+ vehicles

- Cars and other vehicles available in Lexington Hills in renter-occupied apartments
- 0no vehicle
- 521 vehicle
- 212 vehicles
- 653 vehicles
- 04 vehicles
- 05+ vehicles

- Rooms in owner-occupied houses in Lexington Hills, California
- 281 room
- 62 rooms
- 433 rooms
- 904 rooms
- 1135 rooms
- 1566 rooms
- 1077 rooms
- 668 rooms
- 1509+ rooms

- Rooms in renter-occupied apartments in Lexington Hills, California
- 161 room
- 202 rooms
- 423 rooms
- 264 rooms
- 335 rooms
- 06 rooms
- 07 rooms
- 08 rooms
- 09+ rooms


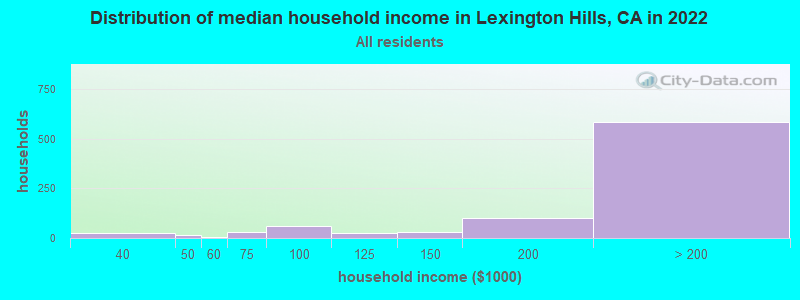
Lexington Hills, CA household income distribution

- 26$30,000 to $39,999
- 14$40,000 to $49,999
- 7$50,000 to $59,999
- 31$60,000 to $74,999
- 62$75,000 to $99,999
- 26$100,000 to $124,999
- 31$125,000 to $149,999
- 102$150,000 to $199,999
- 584$200,000 or more
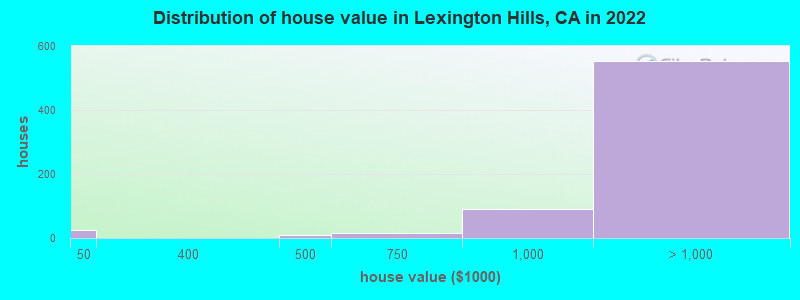
Home value of owner - occupied houses in 2022 in Lexington Hills, CA
-
- 16Less than $10,000
- 8$10,000 to $14,999
- 9$400,000 to $499,999
- 15$500,000 to $749,999
- 92$750,000 to $999,999
- 303$1,000,000 to $1,499,999
- 139$1,500,000 to $1,999,999
- 111$2,000,000 or more
Rent paid by renters in 2022 in Lexington Hills, CA
-
- 42$1,500 to $1,999
- 63$2,000 to $2,499
- 34$2,500 to $2,999
- 6$3,000 to $3,499


Percentage of workers working in this county: 83.0%
Number of people working at home: 293 (19.7% of all workers)
Travel time to work (commute)
- Less than 5 minutes: 23
- 5 to 9 minutes: 30
- 10 to 14 minutes: 76
- 15 to 19 minutes: 154
- 20 to 24 minutes: 99
- 25 to 29 minutes: 107
- 30 to 34 minutes: 178
- 35 to 39 minutes: 109
- 40 to 44 minutes: 34
- 45 to 59 minutes: 158
- 60 to 89 minutes: 59
- 90 or more minutes: 77
Means of transportation to work:
- Drove a car alone: 1,229 (81.1%)
- Carpooled: 157 (10.4%)
- Bus or trolley bus: 14 (0.9%)
- Motorcycle: 6 (0.4%)
- Walked: 10 (0.7%)
- Worked at home: 100 (6.6%)

- Unemployment by race in 2022
- Unemployment rate for Hispanic or Latino residents
- 63.0%Females

- Year of entry for the foreign-born population in Lexington Hills, California
- 1532010 or later
- 472000 to 2009
- 271990 to 1999
- 991980 to 1989
- 321970 to 1979
- 69Before 1970
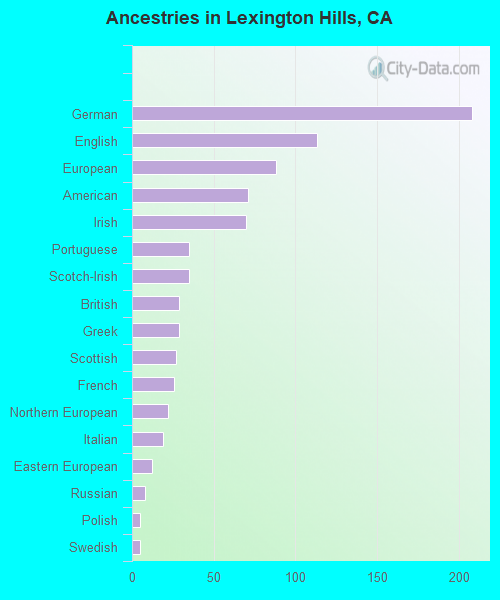
First ancestries reported:
- German: 208 (19.8%)
- English: 113 (10.7%)
- European: 88 (8.4%)
- American: 71 (6.7%)
- Irish: 70 (6.6%)
- Portuguese: 35 (3.3%)
- Scotch-Irish: 35 (3.3%)
- British: 29 (2.8%)
- Greek: 29 (2.8%)
- Scottish: 27 (2.6%)
- French: 26 (2.5%)
- Northern European: 22 (2.1%)
- Italian: 19 (1.8%)
- Eastern European: 12 (1.1%)
- Russian: 8 (0.8%)
- Polish: 5 (0.5%)
- Swedish: 5 (0.5%)
Most common places of birth for foreign-born residents (%):
| Lexington Hills: | 23.1% (83) |
| California: | 0.6% (60,582) |
| Lexington Hills: | 13.6% (49) |
| California: | 0.5% (53,222) |
| Lexington Hills: | 12.5% (45) |
| California: | 0.7% (73,304) |
| Lexington Hills: | 7.8% (28) |
| California: | 5.2% (539,184) |
| Lexington Hills: | 7.2% (26) |
| California: | 3.0% (315,248) |
| Lexington Hills: | 6.4% (23) |
| California: | 1.0% (103,575) |
| Lexington Hills: | 5.8% (21) |
| California: | 0.3% (33,029) |
| Lexington Hills: | 5.3% (19) |
| California: | 0.4% (40,224) |
| Lexington Hills: | 5.3% (19) |
| California: | 0.5% (55,249) |
| Lexington Hills: | 4.7% (17) |
| California: | 1.2% (127,477) |
| Lexington Hills: | 2.8% (10) |
| California: | 6.6% (684,672) |
Place of birth for U.S.-born residents:
- This state: 1,500
- Other state: 616
- Northeast: 285
- Midwest: 108
- South: 103
- West: 136
91.5% of Lexington Hills residents lived in the same house 1 years ago.
Out of people who lived in different houses, 31.6% lived in this county.
Out of people who lived in different counties, 100.0% lived in California.
| Lexington Hills: | 91.5% |
| State average: | 88.9% |
Education attainment for males 25 years and older:
- No schooling: 0
- Nursery to 4th grade: 0
- 5th and 6th grade: 0
- 7th and 8th grade: 0
- 9th grade: 0
- 10th grade: 0
- 11th grade: 0
- 12th grade, no diploma: 0
- High school graduate (or equivalency): 118
- Less than 1 year of college: 31
- Some college more than 1 year, no degree: 69
- Associate degree: 76
- Bachelor's degree: 237
- Master's degree: 299
- Professional school degree: 10
- Doctorate degree: 77

Education attainment for females 25 years and older:
- No schooling: 0
- Nursery to 4th grade: 0
- 5th and 6th grade: 0
- 7th and 8th grade: 0
- 9th grade: 0
- 10th grade: 10
- 11th grade: 0
- 12th grade, no diploma: 0
- High school graduate (or equivalency): 109
- Less than 1 year of college: 51
- Some college more than 1 year, no degree: 60
- Associate degree: 33
- Bachelor's degree: 363
- Master's degree: 191
- Professional school degree: 21
- Doctorate degree: 72


Housing units in structures:
- One, detached: 905
- One, attached: 35
- 3 or 4: 39
Housing units lacking complete kitchen facilities in 2022: 0.9%
House/condo owner moved in on average 13 years ago
Renter moved in on average 10 years ago

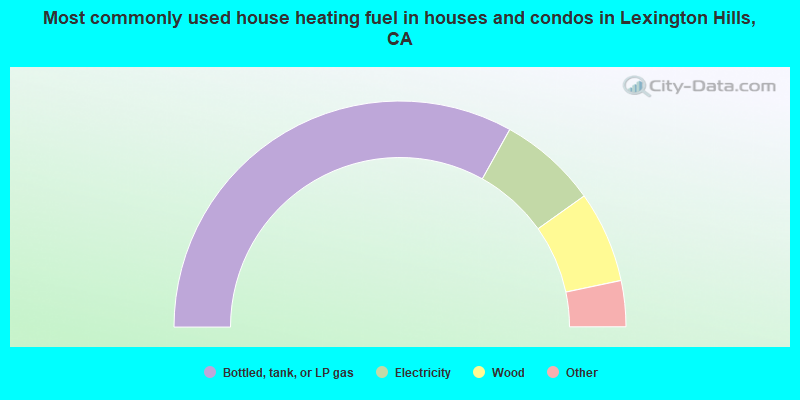
- 66.3%Bottled, tank, or LP gas
- 14.2%Electricity
- 13.1%Wood
- 3.3%Other fuel
- 1.9%Utility gas
- 1.2%Solar energy
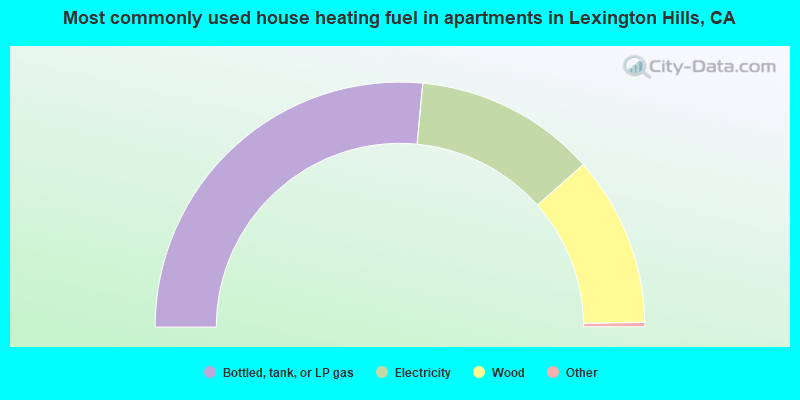
- 53.3%Bottled, tank, or LP gas
- 24.1%Electricity
- 22.6%Wood
Private vs. public school enrollment:
| Here: | 19.5% |
| California: | 10.5% |
| Here: | 0.0% |
| California: | 8.5% |
| Here: | 2.7% |
| California: | 15.9% |


