Lincolnia, VA (Virginia) Houses and Residents
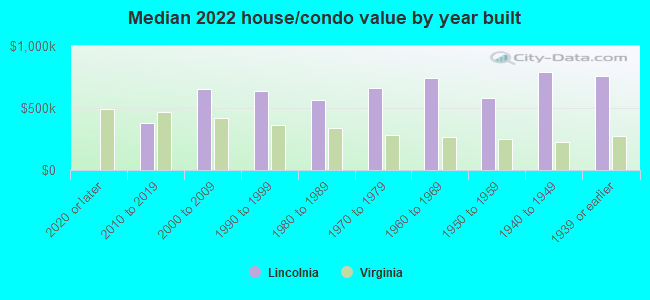
Estimated median house or condo value in 2022: $608,695 (it was $213,500 in 2000 )
Lincolnia:
$608,695Virginia:
$365,700
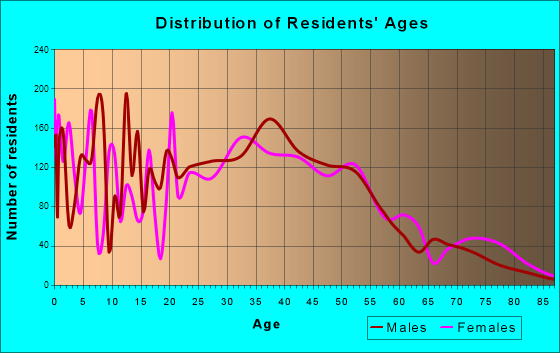
Lower value quartile - upper value quartile: $485,203 - $740,406Total population: 22,855 (Urban population: 15,867, Rural population: 0)
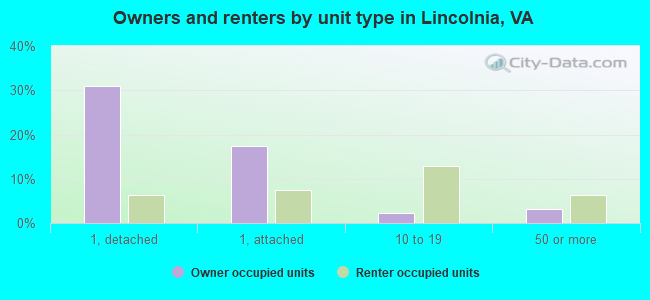
Houses: 8,510 (7,667 occupied: 4,335 owner occupied, 3,374 renter occupied )
% of renters here:
44%State:
33%
Housing density: 2,894 houses/condos per square mile
Median price asked for vacant for-sale houses and condos in 2022 in this county: $1,038,941.
Median contract rent in 2022: $1,896 (lower quartile is $1,628, upper quartile is over $2,000)
Median rent asked for vacant for-rent units in 2022: $2,086
Median gross rent in Lincolnia, VA in 2022: over $2,000
Housing units in Lincolnia with a mortgage: 2,931 (221 second mortgage, 0 home equity loan, 191 both second mortgage and home equity loan )Houses without a mortgage: 95
Median household income for houses/condos with a mortgage: $162,000
Median household income for apartments without a mortgage: $149,560
Median monthly housing costs: $2,108
Data:
Median house or condo value ($)
Median house or condo value ($ change since 2000)
Median house or condo value ($) - White
Median house or condo value ($) - Black or African American
Median house or condo value ($) - Asian
Median house or condo value ($) - Hispanic or Latino
Median house or condo value ($) - American Indian and Alaska Native
Median house or condo value ($) - Multirace
Median house or condo value ($) - Other Race
Median price asked for mobile homes ($)
Household density (households per square mile)
Mean house or condo value by units in structure - 1, detached ($)
Mean house or condo value by units in structure - 1, attached ($)
Mean house or condo value by units in structure - 2 ($)
Mean house or condo value by units in structure by units in structure - 3 or 4 ($)
Mean house or condo value by units in structure - 5 or more ($)
Mean house or condo value by units in structure - Boat, RV, van, etc. ($)
Mean house or condo value by units in structure - Mobile home ($)
Median contract rent ($)
Median contract rent - Lower quartile ($)
Median contract rent - Upper quartile ($)
Median gross rent ($)
Urban houses (%)
Rural houses (%)
Houses occupied (%)
Houses occupied (% change since 2000)
Houses owner occupied (%)
Houses owner occupied (% change since 2000)
Houses renter occupied (%)
Houses renter occupied (% change since 2000)
Vacant housing units - For rent (%)
Vacant housing units - For rent (% change since 2000)
Vacant housing units - For sale only (%)
Vacant housing units - For sale only (% change since 2000)
Vacant housing units - Rented or sold, not occupied (%)
Vacant housing units - Rented or sold, not occupied (% change since 2000)
Vacant housing units - For seasonal, recreational, or occasional use (%)
Vacant housing units - For seasonal, recreational, or occasional use (% change since 2000)
Vacant housing units - For migrant workers (%)
Vacant housing units - For migrant workers (% change since 2000)
Vacant housing units - Other vacant (%)
Vacant housing units - Other vacant (% change since 2000)
Median monthly housing costs ($)
Median household income for houses/condos with a mortgage ($)
Median household income for houses/condos without a mortgage ($)
Median household income ($)
Median household income ($) - White
Median household income ($) - Black or African American
Median household income ($) - Asian
Median household income ($) - Hispanic or Latino
Median household income ($) - American Indian and Alaska Native
Median household income ($) - Multirace
Median household income ($) - Other Race
Mortgage status - with mortgage (%)
Mortgage status - with second mortgage (%)
Mortgage status - with home equity loan (%)
Mortgage status - with both second mortgage and home equity loan (%)
Mortgage status - without a mortgage (%)
Median year house/condo built
Median year apartment built
Household type by relationship - Male householder living alone (%)
Household type by relationship - Male householder not living alone (%)
Household type by relationship - Female householder living alone (%)
Household type by relationship - Female householder not living alone (%)
Household type by relationship - Opposite-Sex spouse (%)
Household type by relationship - Same-Sex spouse (%)
Household type by relationship - Opposite-Sex unmarried partner (%)
Household type by relationship - Same-Sex unmarried partner (%)
Household type by relationship - In group quarters (%)
Size of family households - 2-person household (%)
Size of family households - 3-person household (%)
Size of family households - 4-person household (%)
Size of family households - 5-person household (%)
Size of family households - 6-person household (%)
Size of family households - 7-or-more-person household (%)
Size of nonfamily households - 1-person household (%)
Size of nonfamily households - 2-person household (%)
Size of nonfamily households - 3-person household (%)
Size of nonfamily households - 4-person household (%)
Size of nonfamily households - 5-person household (%)
Size of nonfamily households - 6-person household (%)
Size of nonfamily households - 7-or-moreperson household (%)
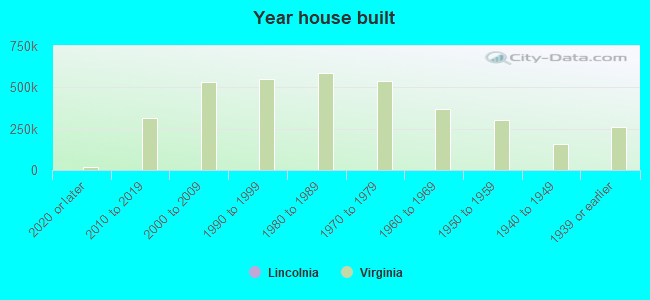
Year house built - Built 2010 or later (%)
Year house built - Built 2000 to 2009 (%)
Year house built - Built 1990 to 1999 (%)
Year house built - Built 1980 to 1989 (%)
Year house built - Built 1970 to 1979 (%)
Year house built - Built 1960 to 1969 (%)
Year house built - Built 1950 to 1959 (%)
Year house built - Built 1940 to 1949 (%)
Year house built - Built 1939 or earlier (%)
Median number of rooms in houses and condos
Median number of rooms in apartments
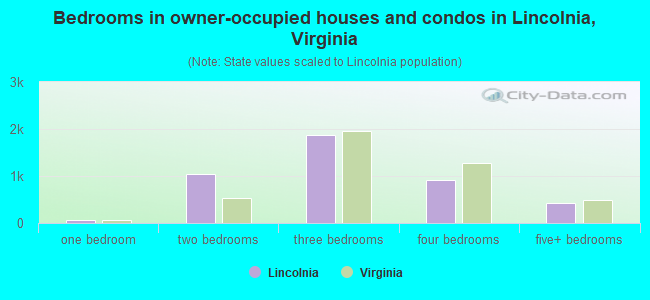
Median number of bedrooms in owner occupied houses
Mean number of bedrooms in owner occupied houses
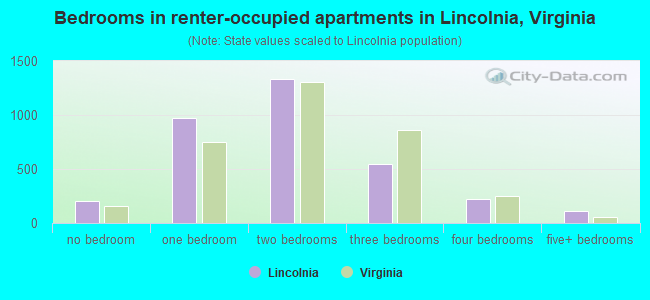
Median number of bedrooms in renter occupied houses
Mean number of bedrooms in renter occupied houses
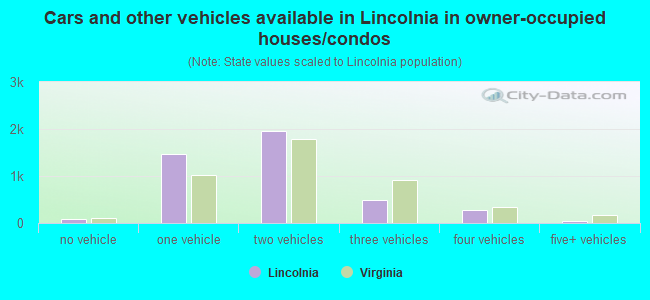
Median number of vehichles in owner occupied houses
Mean number of vehichles in owner occupied houses
Median number of vehichles in renter occupied houses
Mean number of vehichles in renter occupied houses
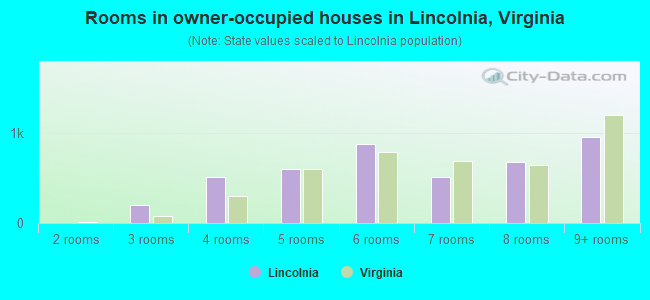
Rooms in owner-occupied houses - 1 room (%)
Rooms in owner-occupied houses - 2 rooms (%)
Rooms in owner-occupied houses - 3 rooms (%)
Rooms in owner-occupied houses - 4 rooms (%)
Rooms in owner-occupied houses - 5 rooms (%)
Rooms in owner-occupied houses - 6 rooms (%)
Rooms in owner-occupied houses - 7 rooms (%)
Rooms in owner-occupied houses - 8 rooms (%)
Rooms in owner-occupied houses - 9+ rooms (%)
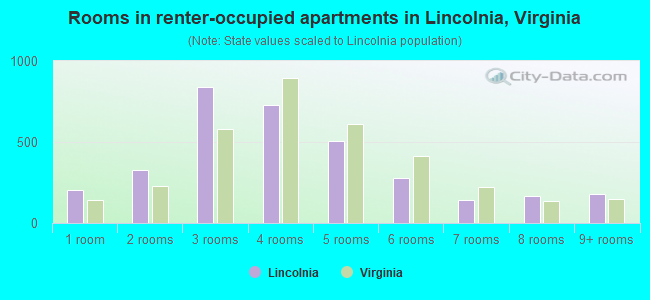
Rooms in renter-occupied houses - 1 room (%)
Rooms in renter-occupied houses - 2 rooms (%)
Rooms in renter-occupied houses - 3 rooms (%)
Rooms in renter-occupied houses - 4 rooms (%)
Rooms in renter-occupied houses - 5 rooms (%)
Rooms in renter-occupied houses - 6 rooms (%)
Rooms in renter-occupied houses - 7 rooms (%)
Rooms in renter-occupied houses - 8 rooms (%)
Rooms in renter-occupied houses - 9+ rooms (%)
Bedrooms in owner-occupied houses - no bedrooms (%)
Bedrooms in owner-occupied houses - 1 bedroom (%)
Bedrooms in owner-occupied houses - 2 bedrooms (%)
Bedrooms in owner-occupied houses - 3 bedrooms (%)
Bedrooms in owner-occupied houses - 4 bedrooms (%)
Bedrooms in owner-occupied houses - 5+ bedrooms (%)
Bedrooms in renter-occupied houses - no bedrooms (%)
Bedrooms in renter-occupied houses - 1 bedroom (%)
Bedrooms in renter-occupied houses - 2 bedrooms (%)
Bedrooms in renter-occupied houses - 3 bedrooms (%)
Bedrooms in renter-occupied houses - 4 bedrooms (%)
Bedrooms in renter-occupied houses - 5+ bedrooms (%)
Vehicles available in owner-occupied houses - no vehicle available (%)
Vehicles available in owner-occupied houses - 1 vehicle available(%)
Vehicles available in owner-occupied houses - 2 Vehicles available (%)
Vehicles available in owner-occupied houses - 3 Vehicles available (%)
Vehicles available in owner-occupied houses - 4 Vehicles available (%)
Vehicles available in owner-occupied houses - 5+ Vehicles available (%)
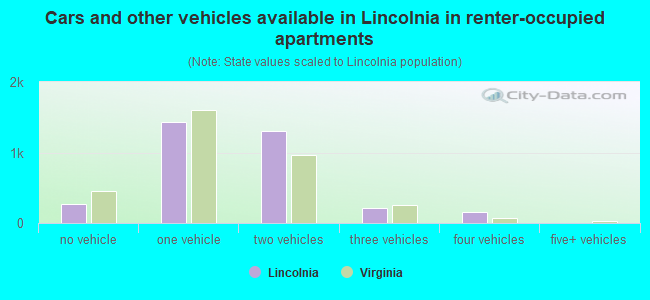
Vehicles available in renter-occupied houses - no vehicle available (%)
Vehicles available in renter-occupied houses - 1 vehicle available (%)
Vehicles available in renter-occupied houses - 2 Vehicles available (%)
Vehicles available in renter-occupied houses - 3 Vehicles available (%)
Vehicles available in renter-occupied houses - 4 Vehicles available (%)
Vehicles available in renter-occupied houses - 5+ Vehicles available (%)
Housing units in structures - 1, detached (%)
Housing units in structures - 1, attached (%)
Housing units in structures - 2 (%)
Housing units in structures - 3 or 4 (%)
Housing units in structures - 5 to 9 (%)
Housing units in structures - 10 to 19 (%)
Housing units in structures - 20 to 49 (%)
Housing units in structures - 50 or more (%)
Housing units in structures - Mobile home (%)
Housing units in structures - Boat, RV, van, etc. (%)
Housing units in structures - Owners - 1, detached (%)
Housing units in structures - Owners - 1, attached (%)
Housing units in structures - Owners - 2 (%)
Housing units in structures - Owners - 3 or 4 (%)
Housing units in structures - Owners - 5 to 9 (%)
Housing units in structures - Owners - 10 to 19 (%)
Housing units in structures - Owners - 20 to 49 (%)
Housing units in structures - Owners - 50 or more (%)
Housing units in structures - Owners - Mobile home (%)
Housing units in structures - Owners - Boat, RV, van, etc. (%)
Housing units in structures - Renters - 1, detached (%)
Housing units in structures - Renters - 1, attached (%)
Housing units in structures - Renters - 2 (%)
Housing units in structures - Renters - 3 or 4 (%)
Housing units in structures - Renters - 5 to 9 (%)
Housing units in structures - Renters - 10 to 19 (%)
Housing units in structures - Renters - 20 to 49 (%)
Housing units in structures - Renters - 50 or more (%)
Housing units in structures - Renters - Mobile home (%)
Housing units in structures - Renters - Boat, RV, van, etc. (%)
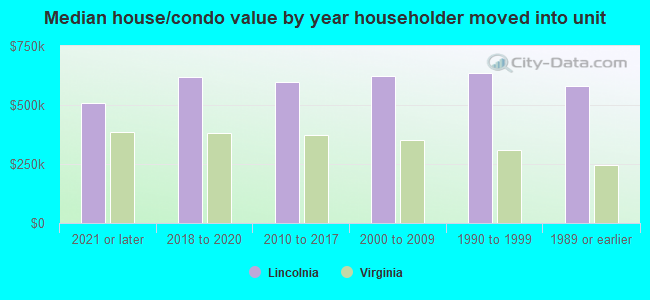
House/condo owner moved in on average (years ago)
Renter moved in on average (years ago)
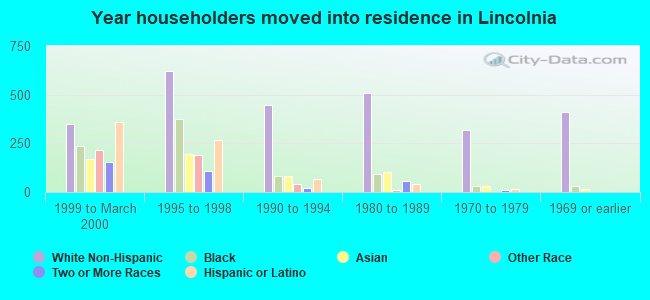
Year householder moved into unit - Moved in 1999 to March 2000 (%)
Year householder moved into unit - Moved in 1999 to March 2000 (%) - White
Year householder moved into unit - Moved in 1999 to March 2000 (%) - Black or African American
Year householder moved into unit - Moved in 1999 to March 2000 (%) - Asian
Year householder moved into unit - Moved in 1999 to March 2000 (%) - Hispanic or Latino
Year householder moved into unit - Moved in 1999 to March 2000 (%) - American Indian and Alaska Native
Year householder moved into unit - Moved in 1999 to March 2000 (%) - Multirace
Year householder moved into unit - Moved in 1999 to March 2000 (%) - Other Race
Year householder moved into unit - Moved in 1995 to 1998 (%)
Year householder moved into unit - Moved in 1995 to 1998 (%) - White
Year householder moved into unit - Moved in 1995 to 1998 (%) - Black or African American
Year householder moved into unit - Moved in 1995 to 1998 (%) - Asian
Year householder moved into unit - Moved in 1995 to 1998 (%) - Hispanic or Latino
Year householder moved into unit - Moved in 1995 to 1998 (%) - American Indian and Alaska Native
Year householder moved into unit - Moved in 1995 to 1998 (%) - Multirace
Year householder moved into unit - Moved in 1995 to 1998 (%) - Other Race
Year householder moved into unit - Moved in 1990 to 1994 (%)
Year householder moved into unit - Moved in 1990 to 1994 (%) - White
Year householder moved into unit - Moved in 1990 to 1994 (%) - Black or African American
Year householder moved into unit - Moved in 1990 to 1994 (%) - Asian
Year householder moved into unit - Moved in 1990 to 1994 (%) - Hispanic or Latino
Year householder moved into unit - Moved in 1990 to 1994 (%) - American Indian and Alaska Native
Year householder moved into unit - Moved in 1990 to 1994 (%) - Multirace
Year householder moved into unit - Moved in 1990 to 1994 (%) - Other Race
Year householder moved into unit - Moved in 1980 to 1989 (%)
Year householder moved into unit - Moved in 1980 to 1989 (%) - White
Year householder moved into unit - Moved in 1980 to 1989 (%) - Black or African American
Year householder moved into unit - Moved in 1980 to 1989 (%) - Asian
Year householder moved into unit - Moved in 1980 to 1989 (%) - Hispanic or Latino
Year householder moved into unit - Moved in 1980 to 1989 (%) - American Indian and Alaska Native
Year householder moved into unit - Moved in 1980 to 1989 (%) - Multirace
Year householder moved into unit - Moved in 1980 to 1989 (%) - Other Race
Year householder moved into unit - Moved in 1970 to 1979 (%)
Year householder moved into unit - Moved in 1970 to 1979 (%) - White
Year householder moved into unit - Moved in 1970 to 1979 (%) - Black or African American
Year householder moved into unit - Moved in 1970 to 1979 (%) - Asian
Year householder moved into unit - Moved in 1970 to 1979 (%) - Hispanic or Latino
Year householder moved into unit - Moved in 1970 to 1979 (%) - American Indian and Alaska Native
Year householder moved into unit - Moved in 1970 to 1979 (%) - Multirace
Year householder moved into unit - Moved in 1970 to 1979 (%) - Other Race
Year householder moved into unit - Moved in 1969 or earlier (%)
Year householder moved into unit - Moved in 1969 or earlier (%) - White
Year householder moved into unit - Moved in 1969 or earlier (%) - Black or African American
Year householder moved into unit - Moved in 1969 or earlier (%) - Asian
Year householder moved into unit - Moved in 1969 or earlier (%) - Hispanic or Latino
Year householder moved into unit - Moved in 1969 or earlier (%) - American Indian and Alaska Native
Year householder moved into unit - Moved in 1969 or earlier (%) - Multirace
Year householder moved into unit - Moved in 1969 or earlier (%) - Other Race
Housing units lacking complete plumbing facilities (%)
Housing units lacking complete kitchen facilities (%)
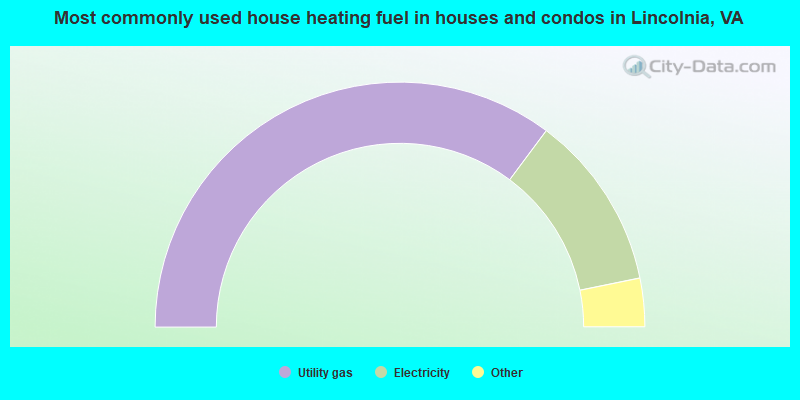
House heating fuel used in houses and condos - Utility gas (%)
House heating fuel used in houses and condos - Bottled, tank, or LP gas (%)
House heating fuel used in houses and condos - Electricity (%)
House heating fuel used in houses and condos - Fuel oil, kerosene, etc. (%)
House heating fuel used in houses and condos - Coal or coke (%)
House heating fuel used in houses and condos - Wood (%)
House heating fuel used in houses and condos - Solar energy (%)
House heating fuel used in houses and condos - Other fuel (%)
House heating fuel used in houses and condos - No fuel used (%)
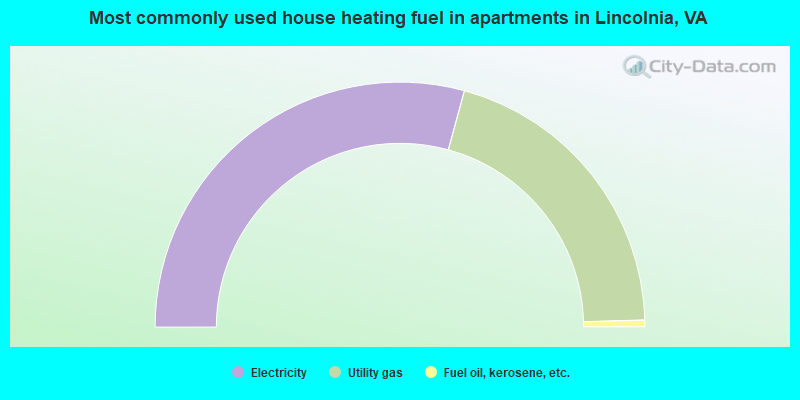
House heating fuel used in apartments - Utility gas (%)
House heating fuel used in apartments - Bottled, tank, or LP gas (%)
House heating fuel used in apartments - Electricity (%)
House heating fuel used in apartments - Fuel oil, kerosene, etc. (%)
House heating fuel used in apartments - Coal or coke (%)
House heating fuel used in apartments - Wood (%)
House heating fuel used in apartments - Solar energy (%)
House heating fuel used in apartments - Other fuel (%)
House heating fuel used in apartments - No fuel used (%)
Median year house/condo built: 1981Median year apartment built: 1982Household type by relationship:
Households: 19,690
Male householders: 4,109 (848 living alone ), Female householders: 3,460 (1,189 living alone )3,406 spouses (3,406 opposite-sex spouses ), 540 unmarried partners , (436 opposite-sex unmarried partners ), 5,093 children (4,976 natural , 40 adopted , 76 stepchildren ), 230 grandchildren , 388 brothers or sisters , 435 parents , 0 foster children , 682 other relatives , 1,314 non-relatives In group quarters: 26
Size of family households: 2,152 2-persons , 953 3-persons , 1,035 4-persons , 480 5-persons , 110 6-persons , 102 7-or-more-persons .
Size of nonfamily households: 2,102 1-person , 722 2-persons , 75 3-persons , 25 5-persons , 8 7-or-more-persons .
2,160 married couples with children. single-parent households (347 men , 622 women ).
57.0% of residents of Lincolnia speak English at home. of residents speak Spanish at home (56% speak English very well , 20% speak English well , 18% speak English not well , 6% don't speak English at all ).of residents speak other Indo-European language at home (66% speak English very well , 27% speak English well , 4% speak English not well , 3% don't speak English at all ).of residents speak Asian or Pacific Island language at home (43% speak English very well , 29% speak English well , 25% speak English not well , 3% don't speak English at all ).of residents speak other language at home (79% speak English very well , 17% speak English well , 3% speak English not well ).
Foreign born population: 7,192 (36.5%)of them are naturalized citizens )
Median number of rooms in houses and condos:
Median number of rooms in apartments
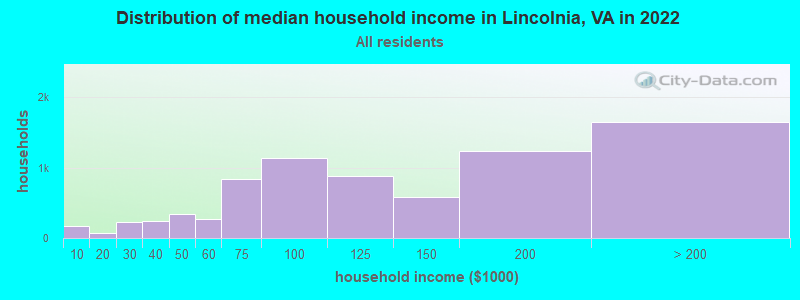
Lincolnia, VA household income distribution 169 Less than $10,00075 $10,000 to $19,999225 $20,000 to $29,999241 $30,000 to $39,999342 $40,000 to $49,999275 $50,000 to $59,999844 $60,000 to $74,9991,135 $75,000 to $99,999879 $100,000 to $124,999589 $125,000 to $149,9991,240 $150,000 to $199,9991,651 $200,000 or more
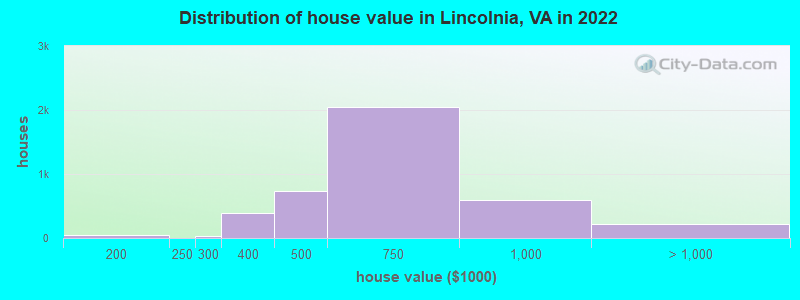
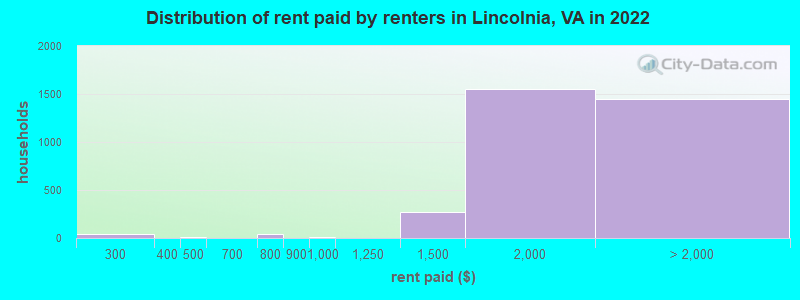
Home value of owner - occupied houses in 2022 in Lincolnia, VA 4 $40,000 to $49,99910 $80,000 to $89,99940 $150,000 to $174,9999 $175,000 to $199,99928 $250,000 to $299,999397 $300,000 to $399,999734 $400,000 to $499,9992,044 $500,000 to $749,999599 $750,000 to $999,999123 $1,000,000 to $1,499,99977 $1,500,000 to $1,999,99923 $2,000,000 or moreRent paid by renters in 2022 in Lincolnia, VA 4 Less than $1008 $200 to $24929 $250 to $29910 $400 to $4497 $700 to $74929 $750 to $7997 $900 to $999269 $1,250 to $1,4991,555 $1,500 to $1,999746 $2,000 to $2,499300 $2,500 to $2,999183 $3,000 to $3,499155 $3,500 or more58 No cash rent
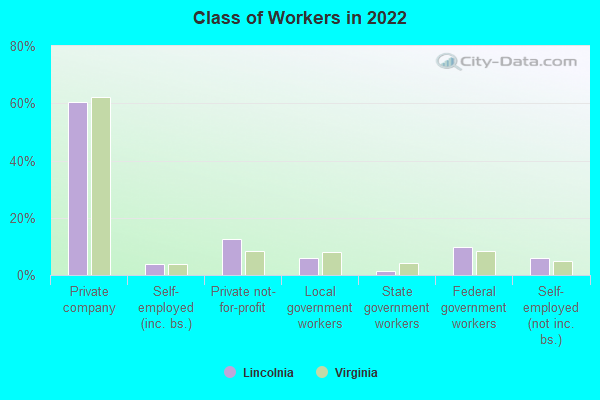
Percentage of workers working in this county: 59.1%Number of people working at home: 2,617 (21.8% of all workers )
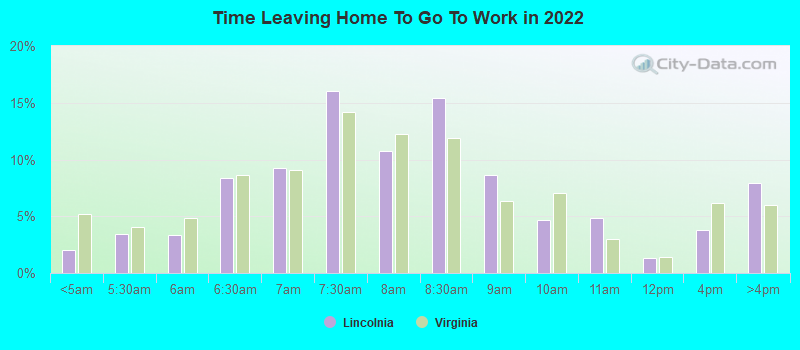
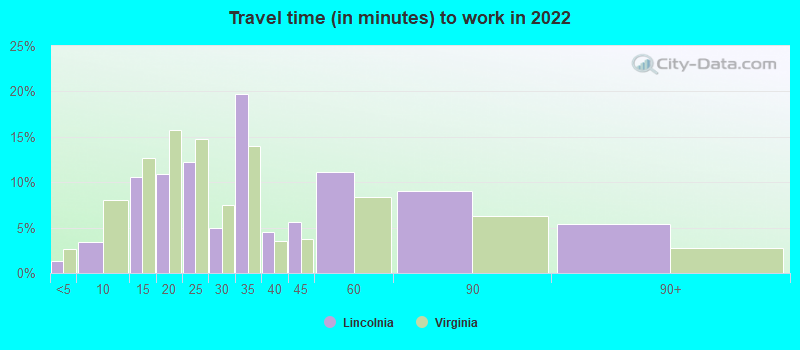
Travel time to work (commute)
Less than 5 minutes: 2095 to 9 minutes: 28410 to 14 minutes: 1,21315 to 19 minutes: 1,42920 to 24 minutes: 1,67525 to 29 minutes: 75430 to 34 minutes: 1,68535 to 39 minutes: 41240 to 44 minutes: 46245 to 59 minutes: 53560 to 89 minutes: 53890 or more minutes: 118
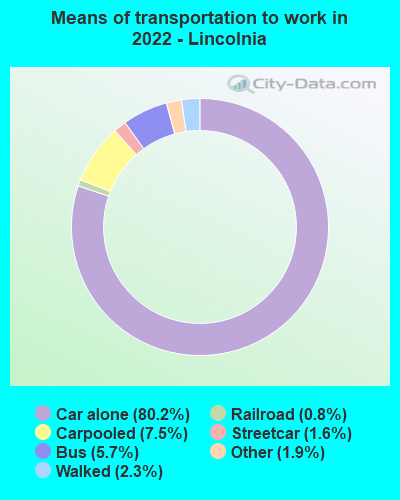
Means of transportation to work:
Drove a car alone: 5,897 (59.1%)Carpooled: 570 (5.7%)Bus : 285 (2.9%)Subway or elevated rail : 100 (1.0%)Light rail, streetcar or trolley : 66 (0.7%)Taxi: 186 (1.9%)Walked: 189 (1.9%)Worked at home: 2,617 (26.2%)
Unemployment by race in 2022
Unemployment rate for White non-Hispanic residents 1.1% Males0.7% FemalesUnemployment rate for Black residents 2.7% Males5.1% FemalesUnemployment rate for American Indian and Alaska Native residents 12.6% FemalesUnemployment rate for Asian residents 3.3% Males5.9% FemalesUnemployment rate for other race residents 7.0% Males10.7% FemalesUnemployment rate for two or more race residents 7.9% Males5.6% FemalesUnemployment rate for Hispanic or Latino residents 4.9% Males5.2% Females
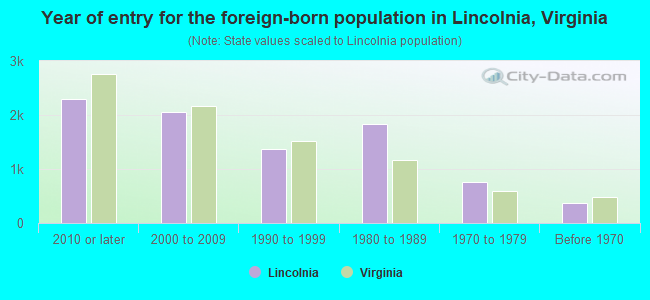
Year of entry for the foreign-born population in Lincolnia, Virginia
2,296 2010 or later 2,049 2000 to 2009 1,367 1990 to 1999 1,840 1980 to 1989 767 1970 to 1979 374 Before 1970
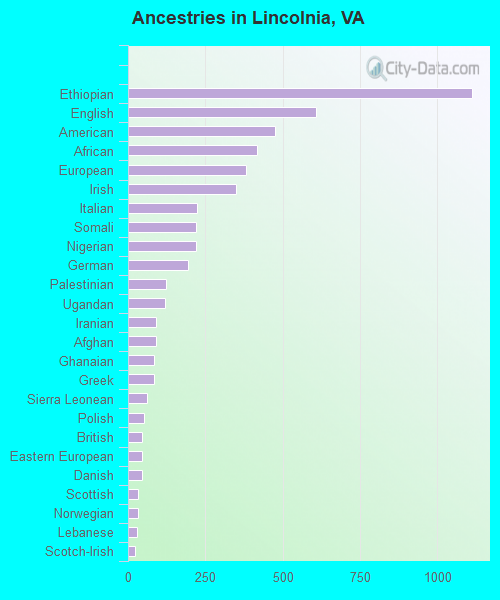
First ancestries reported:
Ethiopian: 1,112 (9.2%)
English: 609 (5.1%)
American: 477 (4.0%)
African: 418 (3.5%)
European: 382 (3.2%)
Irish: 348 (2.9%)
Italian: 223 (1.9%)
Somali: 221 (1.8%)
Nigerian: 220 (1.8%)
German: 193 (1.6%)
Palestinian: 124 (1.0%)
Ugandan: 120 (1.0%)
Iranian: 91 (0.8%)
Afghan: 90 (0.7%)
Ghanaian: 84 (0.7%)
Greek: 83 (0.7%)
Sierra Leonean: 63 (0.5%)
Polish: 51 (0.4%)
British: 45 (0.4%)
Eastern European: 44 (0.4%)
Danish: 44 (0.4%)
Scottish: 33 (0.3%)
Norwegian: 31 (0.3%)
Lebanese: 28 (0.2%)
Scotch-Irish: 22 (0.2%)
Slavic: 22 (0.2%)
Armenian: 20 (0.2%)
Northern European: 19 (0.2%)
Russian: 19 (0.2%)
Ukrainian: 19 (0.2%)
French: 17 (0.1%)
Portuguese: 16 (0.1%)
Jamaican: 15 (0.1%)
Egyptian: 14 (0.1%)
Dutch: 14 (0.1%)
Lithuanian: 12 (0.10%)
Swedish: 12 (0.10%)
Turkish: 12 (0.10%)
Romanian: 11 (0.09%)
Moroccan: 10 (0.08%)
Belgian: 9 (0.07%)
Arab: 6 (0.05%)
Sudanese: 5 (0.04%)
Scandinavian: 4 (0.03%)
Bulgarian: 4 (0.03%)
Brazilian: 4 (0.03%)
Latvian: 3 (0.02%)
Welsh: 3 (0.02%)
Most common places of birth for foreign-born residents (%): Ethiopia Lincolnia:
16.0% (1,152)Virginia:
2.9% (32,082)
Bolivia Lincolnia:
7.3% (525)Virginia:
2.4% (25,722)
Vietnam Lincolnia:
6.8% (489)Virginia:
4.2% (45,750)
Guatemala Lincolnia:
6.2% (444)Virginia:
3.3% (35,938)
El Salvador Lincolnia:
4.9% (356)Virginia:
9.9% (107,534)
Sierra Leone Lincolnia:
4.9% (355)Virginia:
0.6% (6,458)
Peru Lincolnia:
4.9% (349)Virginia:
2.4% (26,366)
Korea Lincolnia:
3.4% (241)Virginia:
4.9% (52,857)
India Lincolnia:
2.8% (203)Virginia:
9.0% (97,830)
China, excluding Hong Kong and Taiwan Lincolnia:
2.8% (201)Virginia:
3.9% (42,989)
Pakistan Lincolnia:
2.5% (177)Virginia:
2.3% (24,582)
Philippines Lincolnia:
2.4% (171)Virginia:
4.8% (52,629)
Afghanistan Lincolnia:
2.3% (166)Virginia:
1.8% (19,426)
Saudi Arabia Lincolnia:
2.1% (151)Virginia:
0.3% (3,713)
Argentina Lincolnia:
2.1% (148)Virginia:
0.5% (4,997)
Eritrea Lincolnia:
2.0% (145)Virginia:
0.3% (3,058)
Nigeria Lincolnia:
2.0% (141)Virginia:
0.6% (6,956)
Place of birth for U.S.-born residents:
This state: 5,381Other state: 6,595Northeast: 1,531Midwest: 1,077South: 2,975West: 959 87.4% of Lincolnia residents lived in the same house 1 years ago.
Out of people who lived in different houses, 27.4% lived in this county.
Out of people who lived in different counties, 52.4% lived in Virginia.
Lincolnia:
87.4%State average:
86.6%
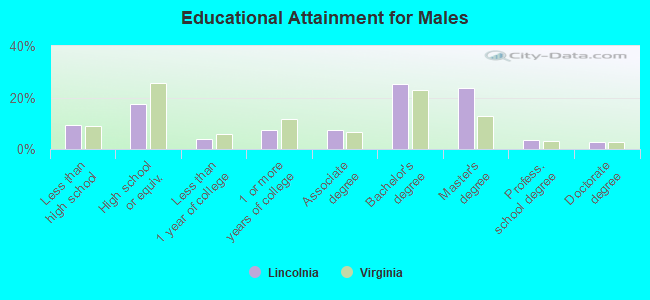
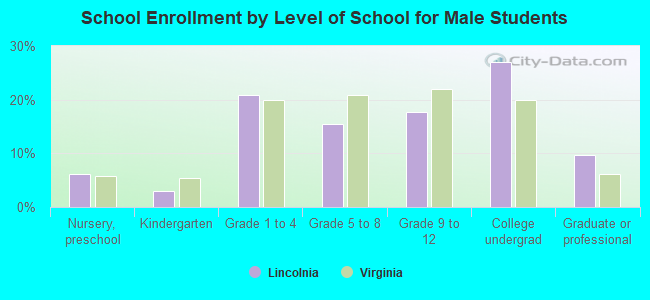
Education attainment for males 25 years and older:
No schooling: 193Nursery to 4th grade: 915th and 6th grade: 1167th and 8th grade: 229th grade: 4010th grade: 5311th grade: 1312th grade, no diploma: 165High school graduate (or equivalency): 1,308Less than 1 year of college: 289Some college more than 1 year, no degree: 553Associate degree: 560Bachelor's degree: 1,886Master's degree: 1,769Professional school degree: 252Doctorate degree: 195
Education attainment for females 25 years and older:
No schooling: 72Nursery to 4th grade: 85th and 6th grade: 2567th and 8th grade: 379th grade: 010th grade: 1311th grade: 6612th grade, no diploma: 68High school graduate (or equivalency): 1,349Less than 1 year of college: 214Some college more than 1 year, no degree: 749Associate degree: 553Bachelor's degree: 1,878Master's degree: 1,574Professional school degree: 295Doctorate degree: 91
Housing units in structures:
One, detached: 3,112One, attached: 2,181Two: 613 or 4: 1975 to 9: 48510 to 19: 1,47820 to 49: 22050 or more: 773Housing units lacking complete plumbing facilities in 2022: 0.6%Housing units lacking complete kitchen facilities in 2022: 0.4%House/condo owner moved in on average 13 years ago
Renter moved in on average 3 years ago
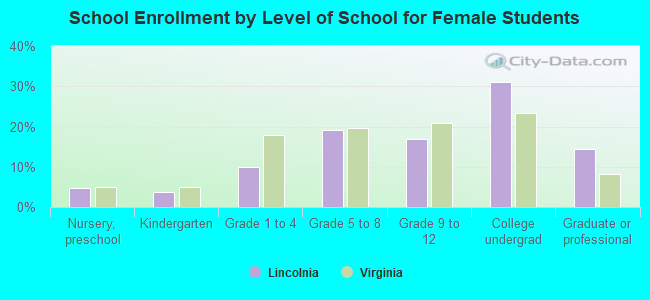
Private vs. public school enrollment:
Students in private schools in grades 1 to 8 (elementary and middle school): 259 Students in private schools in grades 9 to 12 (high school): 55 Students in private undergraduate colleges: 305