Linden, CA (California) Houses and Residents
| Linden: | $622,433 |
| California: | $715,900 |
Mean price in 2022:
Detached houses: $590,611
Here: $590,611 State: $988,808
Total population: 1,784 (Urban population: 0, Rural population: 1,059 (115 farm, 944 nonfarm))
Houses: 732 (732 occupied: 487 owner occupied, 238 renter occupied)
| % of renters here: | 33% |
| State: | 44% |
Housing density: 97 houses/condos per square mile
Median price asked for vacant for-sale houses and condos in 2022 in this county: $775,303.
Median contract rent in 2022: $1,523 (lower quartile is $1,166, upper quartile is $1,796)
Median gross rent in Linden, CA in 2022: over $2,000
Housing units in Linden with a mortgage: 284 (13 second mortgage, 0 home equity loan, 15 both second mortgage and home equity loan)
Houses without a mortgage: 0
Median household income for houses/condos with a mortgage: $141,828
Median household income for apartments without a mortgage: $51,046
Median monthly housing costs: $1,786
Compare current foreclosures near Linden, CA:
| Photo | Address | Area | Beds / Baths | Price | Details |
|---|---|---|---|---|---|

|
#1
E Brovelli Ln
Linden, CA 95236
|
1,878 sq. feet
|
2 baths 4 beds |
show details | |

|
#2
Cherry Glen Ct
Linden, CA 95236
|
3,074 sq. feet
|
3 baths 4 beds |
show details | |

|
#3
Vineyard Dr
Lodi, CA 95240
|
1,225 sq. feet
|
2 baths 3 beds |
$370,000
|
show details |

|
#4
Quail Lakes Dr Apt 126
Stockton, CA 95207
|
612 sq. feet
|
1 baths 1 beds |
$179,000
|
show details |

|
#5
E Bianchi Rd Apt 2
Stockton, CA 95207
|
840 sq. feet
|
1 baths 2 beds |
$183,000
|
show details |

|
#6
Lot
Linden, CA 95236
|
- sq. feet
|
- baths - beds |
show details | |

|
#7
E Brandt Road
Linden, CA 95236
|
- sq. feet
|
- baths - beds |
show details | |

|
#8
Berkesey Ln
Valley Springs, CA 95252
|
- sq. feet
|
2 baths 3 beds |
$515,000
|
show details |

|
#9
W Benjamin Holt Dr
Stockton, CA 95219
|
926 sq. feet
|
1 baths 2 beds |
show details | |

|
#10
Almond Dr Apt 84
Lodi, CA 95240
|
1,064 sq. feet
|
1 baths 2 beds |
show details |
| Photo | Address | Area | Beds / Baths | Price | Details |
|---|---|---|---|---|---|

|
#11
Fargo St
Stockton, CA 95204
|
1,776 sq. feet
|
2 baths 4 beds |
show details | |

|
#12
Christina Ave
Stockton, CA 95204
|
- sq. feet
|
2 baths 3 beds |
show details | |

|
#13
Boston Ave
Stockton, CA 95206
|
1,294 sq. feet
|
2 baths 4 beds |
show details | |

|
#14
Myran Ave
Stockton, CA 95205
|
1,025 sq. feet
|
1 baths 2 beds |
show details | |

|
#15
Shirleen Dr
Stockton, CA 95209
|
2,837 sq. feet
|
3 baths 4 beds |
show details | |

|
#16
Herndon Pl
Stockton, CA 95219
|
- sq. feet
|
1 baths 3 beds |
show details | |

|
#17
Betty Mae Ct
Stockton, CA 95212
|
2,468 sq. feet
|
2 baths 4 beds |
show details | |

|
#18
Crowell Ln
Valley Springs, CA 95252
|
1,498 sq. feet
|
2 baths 3 beds |
show details | |

|
#19
Anderson St
Valley Springs, CA 95252
|
1,544 sq. feet
|
2 baths 3 beds |
show details | |

|
#20
Ashburn Dr
Stockton, CA 95209
|
1,835 sq. feet
|
2 baths 4 beds |
show details |
| Photo | Address | Area | Beds / Baths | Price | Details |
|---|---|---|---|---|---|

|
#21
Shorelake Ct
Stockton, CA 95219
|
2,668 sq. feet
|
3 baths 4 beds |
show details | |

|
#22
E Robinhood Dr
Stockton, CA 95207
|
960 sq. feet
|
1 baths 3 beds |
show details | |

|
#23
E Taylor St
Stockton, CA 95205
|
960 sq. feet
|
2 baths 3 beds |
show details | |

|
#24
Clinton Dr
Stockton, CA 95210
|
1,503 sq. feet
|
2 baths 3 beds |
show details | |

|
#25
Atlanta Cir
Stockton, CA 95219
|
- sq. feet
|
2 baths 3 beds |
show details | |

|
#26
W Harding Way
Stockton, CA 95204
|
2,029 sq. feet
|
2 baths 4 beds |
show details | |

|
#27
Clipper Ln
Stockton, CA 95204
|
1,402 sq. feet
|
2 baths 3 beds |
show details | |

|
#28
Bristol Ave
Stockton, CA 95204
|
1,742 sq. feet
|
1 baths 3 beds |
show details | |

|
#29
Section Ave
Stockton, CA 95215
|
1,038 sq. feet
|
1 baths 3 beds |
show details | |

|
#30
N Country Club Blvd
Stockton, CA 95204
|
1,615 sq. feet
|
2 baths 3 beds |
show details |
| Photo | Address | Area | Beds / Baths | Price | Details |
|---|---|---|---|---|---|

|
#31
Fern Dell Ln
Manteca, CA 95336
|
1,343 sq. feet
|
2 baths 4 beds |
show details | |

|
#32
E Roosevelt St
Stockton, CA 95205
|
- sq. feet
|
1 baths 3 beds |
show details | |

|
#33
Creek Trail Cir
Stockton, CA 95209
|
2,135 sq. feet
|
3 baths 5 beds |
show details | |

|
#34
W Poplar St
Stockton, CA 95203
|
1,335 sq. feet
|
1 baths 2 beds |
show details | |

|
#35
Prairie Dunes Dr
Lathrop, CA 95330
|
1,714 sq. feet
|
3 baths 3 beds |
show details | |

|
#36
E Washington St
Stockton, CA 95215
|
1,064 sq. feet
|
2 baths 3 beds |
show details | |

|
#37
Steve Lillie Cir
Stockton, CA 95206
|
2,077 sq. feet
|
2 baths 4 beds |
show details | |

|
#38
Round Valley Cir
Stockton, CA 95207
|
1,999 sq. feet
|
3 baths 4 beds |
show details | |

|
#39
Delaware Ave
Stockton, CA 95204
|
1,064 sq. feet
|
1 baths 3 beds |
show details | |

|
#40
Mystic Ct
Stockton, CA 95209
|
1,711 sq. feet
|
2 baths 3 beds |
show details |
| Photo | Address | Area | Beds / Baths | Price | Details |
|---|---|---|---|---|---|

|
#41
Mariposa Way
Lodi, CA 95242
|
1,092 sq. feet
|
2 baths 2 beds |
show details | |

|
#42
Green River Ln
Stockton, CA 95206
|
1,622 sq. feet
|
2 baths 4 beds |
show details | |

|
#43
Bess Pl
Stockton, CA 95206
|
1,905 sq. feet
|
3 baths 4 beds |
show details | |

|
#44
Edgewood Dr
Lodi, CA 95240
|
2,901 sq. feet
|
3 baths 5 beds |
show details | |

|
#45
Willow Park Way
Stockton, CA 95206
|
1,088 sq. feet
|
2 baths 3 beds |
show details | |

|
#46
Edgewood Dr
Lodi, CA 95240
|
2,901 sq. feet
|
3 baths 5 beds |
show details | |

|
#47
Stanfield Dr
Stockton, CA 95209
|
2,226 sq. feet
|
2 baths 3 beds |
show details | |

|
#48
Cherry Ct
Stockton, CA 95206
|
1,476 sq. feet
|
2 baths 3 beds |
show details | |

|
#49
Beau Pre St
Stockton, CA 95206
|
1,234 sq. feet
|
2 baths 4 beds |
show details | |

|
Check over 1 million property listings on Foreclosure.com!
|
browse all offers | |||

Latest news about housing in Linden, CA collected exclusively by city-data.com from local newspapers, TV, and radio stations

 | Buying in LA County for up to 500k. Possible? (32 replies) |
| Landfills and/or oil wells affect housing?? (8 replies) |
| Stockton - Homes in Morada area (21 replies) |
| Carpinteria Smells! Are Locals Happy with the Stink? (5 replies) |
| Current thoughts on certain section of Emeryville (35 replies) |
| Santa Barbara: Best Rental Neighborhoods (1 reply) |

Median year apartment built: 1970
Household type by relationship:
Households: 1,877- Male householders: 254 (78 living alone), Female householders: 470 (107 living alone)
373 spouses (373 opposite-sex spouses), 113 unmarried partners, (113 opposite-sex unmarried partners), 591 children (579 natural, 0 adopted, 12 stepchildren), 0 grandchildren, 0 brothers or sisters, 53 parents, 0 foster children, 0 other relatives, 20 non-relatives
Size of family households: 236 2-persons, 87 3-persons, 144 4-persons, 41 5-persons.
Size of nonfamily households: 190 1-person, 15 3-persons.
250 married couples with children.
252 single-parent households (0 men, 252 women).
90.4% of residents of Linden speak English at home.
4.4% of residents speak Spanish at home (93% speak English very well, 7% speak English not well).
2.0% of residents speak other Indo-European language at home (100% speak English very well).
Foreign born population: 41 (2.2%)
(14.6% of them are naturalized citizens)
| Here: | 6.0 |
| State: | 6.0 |
| Here: | 5.0 |
| State: | 3.9 |

- Bedrooms in owner-occupied houses and condos in Linden, California
- 0no bedroom
- 01 bedroom
- 292 bedrooms
- 3723 bedrooms
- 614 bedrooms
- 255+ bedrooms

- Bedrooms in renter-occupied apartments in Linden, California
- 0no bedroom
- 01 bedroom
- 412 bedrooms
- 1743 bedrooms
- 234 bedrooms
- 05+ bedrooms

- Cars and other vehicles available in Linden in owner-occupied houses/condos
- 0no vehicle
- 981 vehicle
- 2962 vehicles
- 373 vehicles
- 134 vehicles
- 435+ vehicles

- Cars and other vehicles available in Linden in renter-occupied apartments
- 0no vehicle
- 561 vehicle
- 1722 vehicles
- 103 vehicles
- 04 vehicles
- 05+ vehicles

- Rooms in owner-occupied houses in Linden, California
- 01 room
- 02 rooms
- 03 rooms
- 334 rooms
- 1115 rooms
- 1646 rooms
- 777 rooms
- 258 rooms
- 769+ rooms

- Rooms in renter-occupied apartments in Linden, California
- 01 room
- 02 rooms
- 253 rooms
- 514 rooms
- 895 rooms
- 506 rooms
- 237 rooms
- 08 rooms
- 09+ rooms


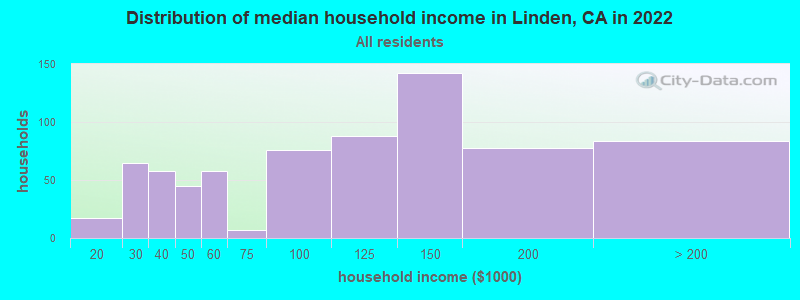
Linden, CA household income distribution

- 17$10,000 to $19,999
- 65$20,000 to $29,999
- 58$30,000 to $39,999
- 45$40,000 to $49,999
- 58$50,000 to $59,999
- 7$60,000 to $74,999
- 76$75,000 to $99,999
- 88$100,000 to $124,999
- 142$125,000 to $149,999
- 78$150,000 to $199,999
- 84$200,000 or more
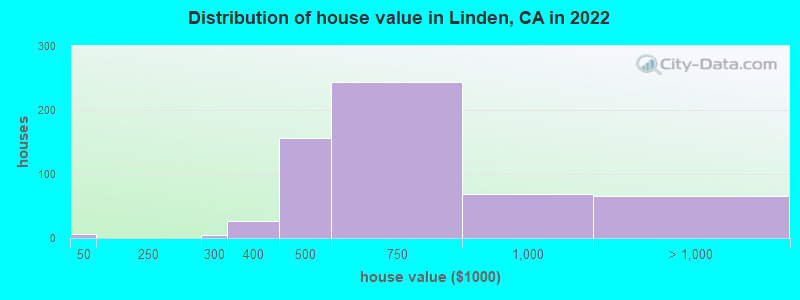
Home value of owner - occupied houses in 2022 in Linden, CA
-
- 6Less than $10,000
- 3$250,000 to $299,999
- 27$300,000 to $399,999
- 156$400,000 to $499,999
- 242$500,000 to $749,999
- 68$750,000 to $999,999
- 66$1,000,000 to $1,499,999
Rent paid by renters in 2022 in Linden, CA
-
- 45$700 to $749
- 8$750 to $799
- 22$1,000 to $1,249
- 50$1,250 to $1,499
- 100$1,500 to $1,999
- 8$2,000 to $2,499


Percentage of workers working in this county: 92.1%
Number of people working at home: 39 (4.8% of all workers)

Travel time to work (commute)
- Less than 5 minutes: 45
- 5 to 9 minutes: 82
- 10 to 14 minutes: 40
- 15 to 19 minutes: 107
- 20 to 24 minutes: 42
- 25 to 29 minutes: 101
- 30 to 34 minutes: 233
- 35 to 39 minutes: 11
- 40 to 44 minutes: 43
- 45 to 59 minutes: 12
- 60 to 89 minutes: 43
- 90 or more minutes: 0
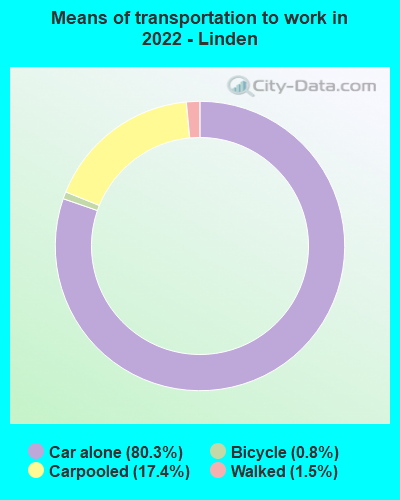
Means of transportation to work:
- Drove a car alone: 876 (74.4%)
- Carpooled: 187 (15.9%)
- Bicycle: 6 (0.5%)
- Walked: 15 (1.3%)

- Unemployment by race in 2022
- Unemployment rate for White non-Hispanic residents
- 2.2%Males
- 4.4%Females
- Unemployment rate for two or more race residents
- 73.2%Females
- Unemployment rate for Hispanic or Latino residents
- 32.7%Males
- 65.9%Females

- Year of entry for the foreign-born population in Linden, California
- 02010 or later
- 02000 to 2009
- 01990 to 1999
- 91980 to 1989
- 241970 to 1979
- 29Before 1970

First ancestries reported:
- Italian: 232 (22.4%)
- German: 205 (19.8%)
- English: 134 (13.0%)
- Swedish: 64 (6.2%)
- European: 60 (5.8%)
- Norwegian: 28 (2.7%)
- French Canadian: 16 (1.5%)
- Irish: 16 (1.5%)
- American: 14 (1.4%)
- British: 6 (0.6%)
- Scotch-Irish: 5 (0.5%)
Most common places of birth for foreign-born residents (%):
| Linden: | 73.7% (28) |
| California: | 0.1% (12,221) |
| Linden: | 13.2% (5) |
| California: | 37.2% (3,881,193) |
Place of birth for U.S.-born residents:
- This state: 1,648
- Other state: 104
- Northeast: 33
- Midwest: 57
- South: 0
- West: 18
83.1% of Linden residents lived in the same house 1 years ago.
Out of people who lived in different houses, 52.7% lived in this county.
Out of people who lived in different counties, 100.0% lived in California.
| Linden: | 83.1% |
| State average: | 88.9% |
Education attainment for males 25 years and older:
- No schooling: 0
- Nursery to 4th grade: 0
- 5th and 6th grade: 0
- 7th and 8th grade: 0
- 9th grade: 0
- 10th grade: 0
- 11th grade: 0
- 12th grade, no diploma: 0
- High school graduate (or equivalency): 255
- Less than 1 year of college: 8
- Some college more than 1 year, no degree: 91
- Associate degree: 19
- Bachelor's degree: 121
- Master's degree: 15
- Professional school degree: 0
- Doctorate degree: 14

Education attainment for females 25 years and older:
- No schooling: 0
- Nursery to 4th grade: 0
- 5th and 6th grade: 0
- 7th and 8th grade: 63
- 9th grade: 0
- 10th grade: 7
- 11th grade: 0
- 12th grade, no diploma: 7
- High school graduate (or equivalency): 114
- Less than 1 year of college: 23
- Some college more than 1 year, no degree: 162
- Associate degree: 49
- Bachelor's degree: 208
- Master's degree: 96
- Professional school degree: 0
- Doctorate degree: 0


Housing units in structures:
- One, detached: 732
House/condo owner moved in on average 18 years ago
Renter moved in on average 0 years ago

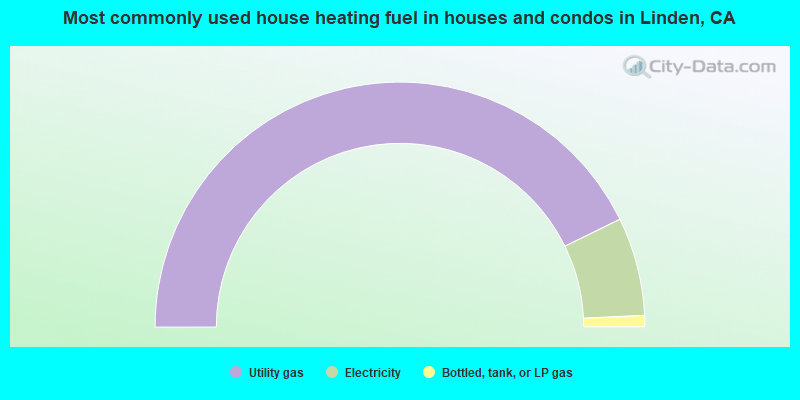
- 85.6%Utility gas
- 13.0%Electricity
- 1.5%Bottled, tank, or LP gas
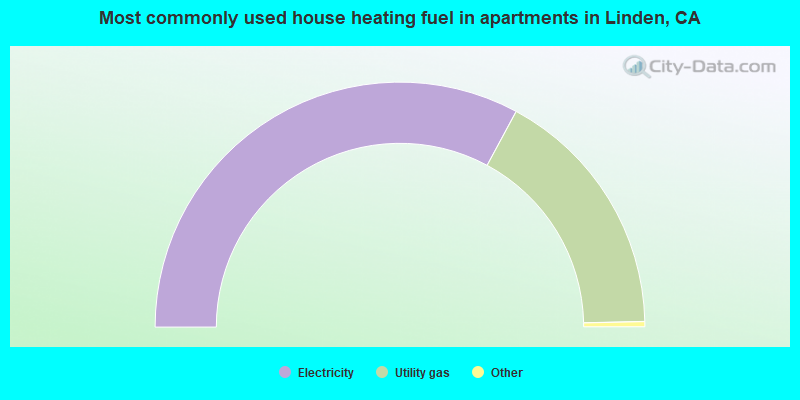
- 66.2%Electricity
- 33.8%Utility gas
Private vs. public school enrollment:
| Here: | 8.7% |
| California: | 10.5% |
| Here: | 0.0% |
| California: | 8.5% |
| Here: | 87.0% |
| California: | 15.9% |


