Linden, TN (Tennessee) Houses and Residents
| Linden: | $95,588 |
| Tennessee: | $284,800 |
Mean price in 2022:
Detached houses: $152,815
Here: $152,815 State: $374,382 Mobile homes: $31,199
Here: $31,199 State: $101,421
Total population: 897 (Urban population: 0, Rural population: 1,030 (all nonfarm))
Houses: 648 (452 occupied: 286 owner occupied, 174 renter occupied)
| % of renters here: | 38% |
| State: | 33% |
Housing density: 665 houses/condos per square mile
Median price asked for vacant for-sale houses and condos in 2022: $45,245.
Median contract rent in 2022: $610 (lower quartile is $403, upper quartile is $702)
Median rent asked for vacant for-rent units in 2022: $451
Median gross rent in Linden, TN in 2022: $667
Housing units in Linden with a mortgage: 85 (4 second mortgage, 0 home equity loan, 4 both second mortgage and home equity loan)
Houses without a mortgage: 0
Median household income for houses/condos with a mortgage: $60,823
Median household income for apartments without a mortgage: $67,403
Median monthly housing costs: $603
Compare current foreclosures near Linden, TN:
| Photo | Address | Area | Beds / Baths | Price | Details |
|---|---|---|---|---|---|

|
#1
Highway 100
Linden, TN 37096
|
2,146 sq. feet
|
2 baths - beds |
show details | |

|
#2
Williams Hollow Rd
Linden, TN 37096
|
920 sq. feet
|
2 baths - beds |
show details | |

|
#3
Swindle Creek Rd
Linden, TN 37096
|
900 sq. feet
|
1 baths - beds |
show details | |

|
#4
Highway 100
Linden, TN 37096
|
3,100 sq. feet
|
2 baths - beds |
show details | |

|
#5
W Main St
Linden, TN 37096
|
1,286 sq. feet
|
1 baths - beds |
show details | |

|
#6
W School St
Linden, TN 37096
|
1,968 sq. feet
|
1 baths - beds |
show details | |

|
#7
Little Spring Creek Rd
Linden, TN 37096
|
- sq. feet
|
- baths - beds |
show details | |

|
#8
Lower Lick Creek Rd
Linden, TN 37096
|
- sq. feet
|
- baths - beds |
show details | |

|
#9
Holder Cemetery Rd
Linden, TN 37096
|
1,125 sq. feet
|
- baths - beds |
show details | |

|
#10
Rustic Rd
Linden, TN 37096
|
- sq. feet
|
- baths - beds |
show details |
| Photo | Address | Area | Beds / Baths | Price | Details |
|---|---|---|---|---|---|

|
#11
W School St Apt E2
Linden, TN 37096
|
- sq. feet
|
- baths - beds |
show details | |

|
#12
Squirrel Hollow Dr
Linden, TN 37096
|
- sq. feet
|
- baths - beds |
show details | |

|
#13
Highway 438 W
Linden, TN 37096
|
- sq. feet
|
- baths - beds |
show details | |

|
#14
Highway 13 S
Linden, TN 37096
|
- sq. feet
|
- baths - beds |
show details | |

|
#15
Highway 438 W
Linden, TN 37096
|
- sq. feet
|
- baths - beds |
show details | |

|
#16
Morrison Creek Rd
Clifton, TN 38425
|
1,182 sq. feet
|
1 baths 2 beds |
show details | |

|
#17
S Pine St
Hohenwald, TN 38462
|
1,656 sq. feet
|
2 baths 3 beds |
show details | |

|
#18
Perryville Rd
Parsons, TN 38363
|
1,752 sq. feet
|
2 baths - beds |
show details | |

|
#19
Mays Town Rd
Parsons, TN 38363
|
1,500 sq. feet
|
2 baths - beds |
show details | |

|
#20
Pine Cir
Hohenwald, TN 38462
|
1,754 sq. feet
|
2 baths - beds |
show details |
| Photo | Address | Area | Beds / Baths | Price | Details |
|---|---|---|---|---|---|

|
#21
W 1st Ave
Hohenwald, TN 38462
|
2,046 sq. feet
|
1 baths - beds |
show details | |

|
#22
N Pine St
Hohenwald, TN 38462
|
1,150 sq. feet
|
1 baths - beds |
show details | |

|
#23
Rosson Ln
Parsons, TN 38363
|
1,143 sq. feet
|
1 baths - beds |
show details | |

|
#24
N Oak St
Hohenwald, TN 38462
|
1,007 sq. feet
|
1 baths - beds |
show details | |

|
#25
Bible Hill Rd
Parsons, TN 38363
|
1,480 sq. feet
|
1 baths - beds |
show details | |

|
#26
W 5th Ave
Hohenwald, TN 38462
|
1,325 sq. feet
|
1 baths - beds |
show details | |

|
#27
N Pleasant St
Decaturville, TN 38329
|
1,756 sq. feet
|
1 baths - beds |
show details | |

|
#28
Marshall Town St
Parsons, TN 38363
|
1,344 sq. feet
|
2 baths - beds |
show details | |

|
#29
Oakwood Dr
Decaturville, TN 38329
|
3,166 sq. feet
|
2 baths - beds |
show details | |

|
#30
Garrison Rd
Hohenwald, TN 38462
|
1,166 sq. feet
|
1 baths - beds |
show details |
| Photo | Address | Area | Beds / Baths | Price | Details |
|---|---|---|---|---|---|

|
#31
Totty Dr
Hohenwald, TN 38462
|
1,272 sq. feet
|
1 baths - beds |
show details | |

|
#32
Barnette Dr
Lobelville, TN 37097
|
2,756 sq. feet
|
2 baths - beds |
show details | |

|
#33
Pineview Rd
Lobelville, TN 37097
|
960 sq. feet
|
1 baths - beds |
show details | |

|
#34
Durbin Ln
Parsons, TN 38363
|
899 sq. feet
|
1 baths - beds |
show details | |

|
#35
Swan Ave
Hohenwald, TN 38462
|
1,252 sq. feet
|
1 baths - beds |
show details | |

|
#36
Mckenzie Rd
Parsons, TN 38363
|
1,450 sq. feet
|
2 baths - beds |
show details | |

|
#37
Old Linden Rd
Hohenwald, TN 38462
|
972 sq. feet
|
1 baths - beds |
show details | |

|
#38
Wandering Way
Parsons, TN 38363
|
- sq. feet
|
- baths - beds |
show details | |

|
#39
Backwoods Dr
Hohenwald, TN 38462
|
- sq. feet
|
- baths - beds |
show details | |

|
#40
Duncan Cir
Lobelville, TN 37097
|
- sq. feet
|
- baths - beds |
show details |
| Photo | Address | Area | Beds / Baths | Price | Details |
|---|---|---|---|---|---|

|
#41
Centerville Hwy
Centerville, TN 37033
|
- sq. feet
|
- baths - beds |
show details | |

|
#42
Rosson Ln
Parsons, TN 38363
|
- sq. feet
|
- baths - beds |
show details | |

|
#43
Linden Hwy
Clifton, TN 38425
|
- sq. feet
|
- baths - beds |
show details | |

|
#44
Gatlyn Ln
Hohenwald, TN 38462
|
- sq. feet
|
- baths - beds |
show details | |

|
#45
Lower Cane Creek Rd
Centerville, TN 37033
|
- sq. feet
|
- baths - beds |
show details | |

|
#46
Oakwood Dr
Decaturville, TN 38329
|
- sq. feet
|
- baths - beds |
show details | |

|
#47
Highway 412 E
Parsons, TN 38363
|
784 sq. feet
|
- baths - beds |
show details | |

|
#48
E 8th St
Parsons, TN 38363
|
- sq. feet
|
- baths - beds |
show details | |

|
#49
Jennings Ave
Parsons, TN 38363
|
- sq. feet
|
- baths - beds |
show details | |

|
Check over 1 million property listings on Foreclosure.com!
|
browse all offers | |||

Latest news about housing in Linden, TN collected exclusively by city-data.com from local newspapers, TV, and radio stations


Median year apartment built: 1983
Household type by relationship:
Households: 1,496- Male householders: 177 (40 living alone), Female householders: 269 (105 living alone)
234 spouses (232 opposite-sex spouses), 8 unmarried partners, (8 opposite-sex unmarried partners), 454 children (426 natural, 0 adopted, 27 stepchildren), 68 grandchildren, 20 brothers or sisters, 21 parents, 0 foster children, 22 other relatives, 104 non-relatives
- In group quarters: 115
Size of family households: 108 2-persons, 58 3-persons, 38 4-persons, 48 5-persons, 15 6-persons.
Size of nonfamily households: 149 1-person, 33 2-persons, 9 3-persons.
164 married couples with children.
94 single-parent households (0 men, 94 women).
89.7% of residents of Linden speak English at home.
1.9% of residents speak Spanish at home (100% speak English very well).
5.5% of residents speak other Indo-European language at home (27% speak English very well, 73% speak English well).
1.8% of residents speak Asian or Pacific Island language at home (100% speak English very well).
Foreign born population: 61 (4.1%)
(100.0% of them are naturalized citizens)
| Here: | 5.5 |
| State: | 6.5 |
| Here: | 5.0 |
| State: | 4.4 |

- Bedrooms in owner-occupied houses and condos in Linden, Tennessee
- 0no bedroom
- 71 bedroom
- 662 bedrooms
- 1923 bedrooms
- 184 bedrooms
- 35+ bedrooms

- Bedrooms in renter-occupied apartments in Linden, Tennessee
- 0no bedroom
- 311 bedroom
- 732 bedrooms
- 203 bedrooms
- 494 bedrooms
- 05+ bedrooms

- Cars and other vehicles available in Linden in owner-occupied houses/condos
- 18no vehicle
- 541 vehicle
- 652 vehicles
- 1343 vehicles
- 164 vehicles
- 05+ vehicles

- Cars and other vehicles available in Linden in renter-occupied apartments
- 9no vehicle
- 1221 vehicle
- 172 vehicles
- 263 vehicles
- 04 vehicles
- 05+ vehicles

- Rooms in owner-occupied houses in Linden, Tennessee
- 01 room
- 02 rooms
- 13 rooms
- 264 rooms
- 1225 rooms
- 406 rooms
- 397 rooms
- 568 rooms
- 39+ rooms

- Rooms in renter-occupied apartments in Linden, Tennessee
- 01 room
- 92 rooms
- 223 rooms
- 394 rooms
- 295 rooms
- 216 rooms
- 277 rooms
- 268 rooms
- 09+ rooms


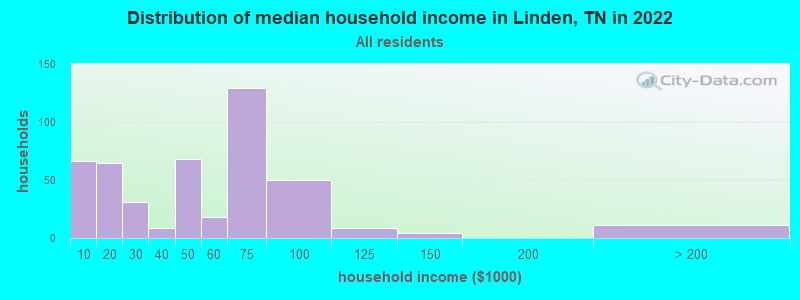
Linden, TN household income distribution

- 66Less than $10,000
- 65$10,000 to $19,999
- 31$20,000 to $29,999
- 9$30,000 to $39,999
- 68$40,000 to $49,999
- 18$50,000 to $59,999
- 129$60,000 to $74,999
- 50$75,000 to $99,999
- 9$100,000 to $124,999
- 4$125,000 to $149,999
- 11$200,000 or more
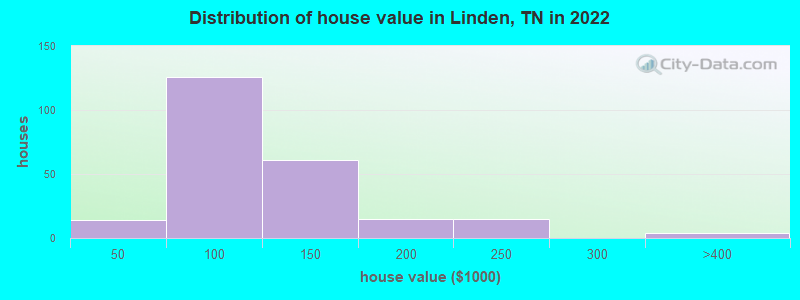
Home value of owner - occupied houses in 2022 in Linden, TN
-
- 5$10,000 to $14,999
- 8$20,000 to $24,999
- 40$50,000 to $59,999
- 48$60,000 to $69,999
- 25$70,000 to $79,999
- 4$80,000 to $89,999
- 6$90,000 to $99,999
- 57$100,000 to $124,999
- 3$125,000 to $149,999
- 8$150,000 to $174,999
- 6$175,000 to $199,999
- 14$200,000 to $249,999
- 3$300,000 to $399,999
Rent paid by renters in 2022 in Linden, TN
-
- 4$150 to $199
- 20$200 to $249
- 3$300 to $349
- 7$350 to $399
- 4$400 to $449
- 20$500 to $549
- 9$550 to $599
- 23$600 to $649
- 6$650 to $699
- 24$750 to $799
- 1$800 to $899
- 41No cash rent


Percentage of workers working in this county: 69.3%
Number of people working at home: 0 (0.0% of all workers)
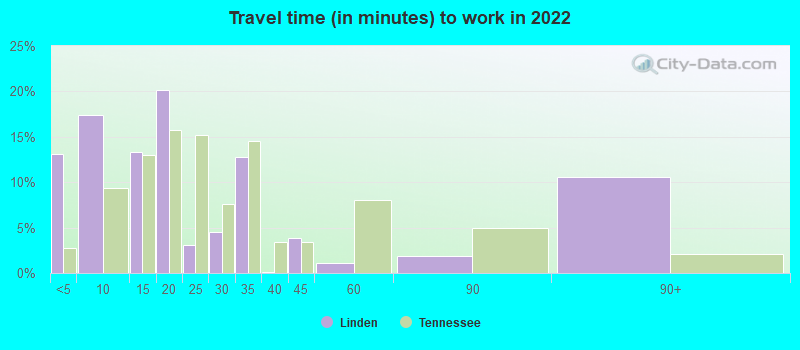
Travel time to work (commute)
- Less than 5 minutes: 108
- 5 to 9 minutes: 114
- 10 to 14 minutes: 20
- 15 to 19 minutes: 38
- 20 to 24 minutes: 23
- 25 to 29 minutes: 7
- 30 to 34 minutes: 31
- 35 to 39 minutes: 6
- 40 to 44 minutes: 0
- 45 to 59 minutes: 73
- 60 to 89 minutes: 6
- 90 or more minutes: 4
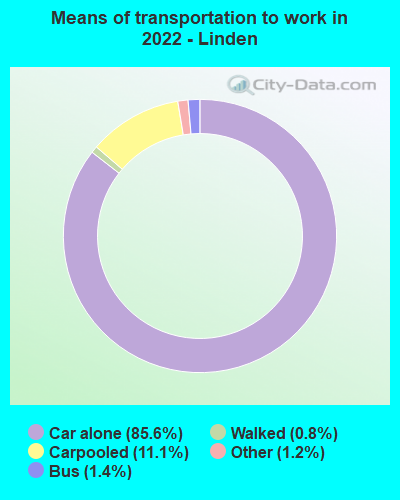
Means of transportation to work:
- Drove a car alone: 1,104 (81.5%)
- Carpooled: 150 (11.1%)
- Bus: 15 (1.1%)
- Taxi: 18 (1.3%)
- Walked: 10 (0.7%)

- Unemployment by race in 2022
- Unemployment rate for White non-Hispanic residents
- 8.6%Males
- 7.9%Females

- Year of entry for the foreign-born population in Linden, Tennessee
- 282010 or later
- 02000 to 2009
- 361990 to 1999
- 31980 to 1989
- 01970 to 1979
- 3Before 1970

First ancestries reported:
- American: 248 (31.6%)
- English: 78 (9.9%)
- German: 20 (2.5%)
- European: 19 (2.4%)
- Portuguese: 8 (1.0%)
- Dutch: 7 (0.9%)
- Irish: 5 (0.6%)
Most common places of birth for foreign-born residents (%):
| Linden: | 55.7% (34) |
| Tennessee: | 6.1% (23,079) |
| Linden: | 36.1% (22) |
| Tennessee: | 3.1% (11,640) |
Place of birth for U.S.-born residents:
- This state: 943
- Other state: 449
- Northeast: 200
- Midwest: 97
- South: 110
- West: 48
95.6% of Linden residents lived in the same house 1 years ago.
Out of people who lived in different houses, 24.0% lived in this county.
Out of people who lived in different counties, 80.4% lived in Tennessee.
| Linden: | 95.6% |
| State average: | 87.0% |
Education attainment for males 25 years and older:
- No schooling: 0
- Nursery to 4th grade: 0
- 5th and 6th grade: 24
- 7th and 8th grade: 0
- 9th grade: 14
- 10th grade: 4
- 11th grade: 3
- 12th grade, no diploma: 0
- High school graduate (or equivalency): 163
- Less than 1 year of college: 35
- Some college more than 1 year, no degree: 23
- Associate degree: 55
- Bachelor's degree: 4
- Master's degree: 4
- Professional school degree: 0
- Doctorate degree: 4

Education attainment for females 25 years and older:
- No schooling: 18
- Nursery to 4th grade: 0
- 5th and 6th grade: 9
- 7th and 8th grade: 30
- 9th grade: 13
- 10th grade: 5
- 11th grade: 0
- 12th grade, no diploma: 13
- High school graduate (or equivalency): 429
- Less than 1 year of college: 25
- Some college more than 1 year, no degree: 15
- Associate degree: 49
- Bachelor's degree: 58
- Master's degree: 17
- Professional school degree: 0
- Doctorate degree: 0


Housing units in structures:
- One, detached: 399
- One, attached: 15
- Two: 45
- 3 or 4: 14
- 5 to 9: 18
- 10 to 19: 30
- Mobile homes: 123
Median worth of mobile homes: $87,354
Housing units lacking complete kitchen facilities in 2022: 8.7%
House/condo owner moved in on average 19 years ago
Renter moved in on average 9 years ago

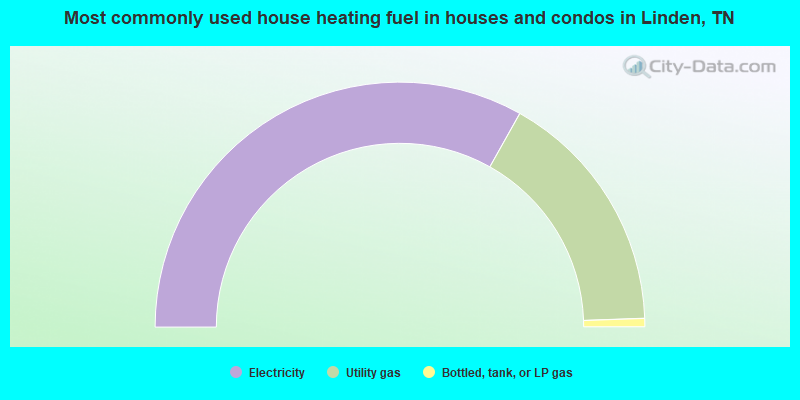
- 66.3%Electricity
- 32.6%Utility gas
- 1.1%Bottled, tank, or LP gas
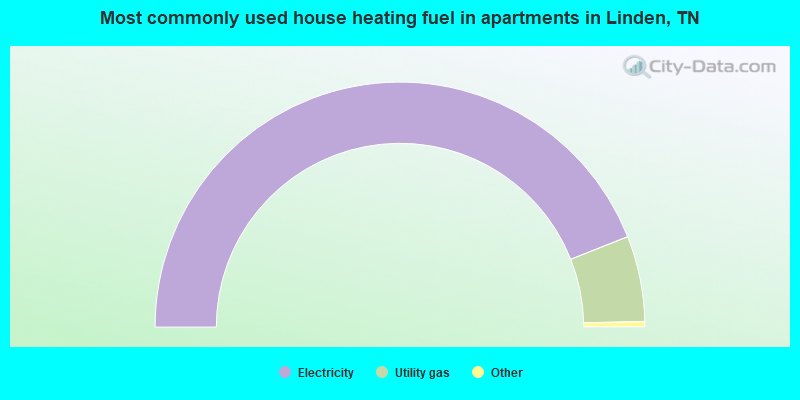
- 88.6%Electricity
- 11.4%Utility gas
Private vs. public school enrollment:
| Here: | 22.1% |
| Tennessee: | 15.0% |
| Here: | 0.0% |
| Tennessee: | 16.2% |
| Here: | 0.0% |
| Tennessee: | 23.5% |


