Linthicum, MD (Maryland) Houses and Residents
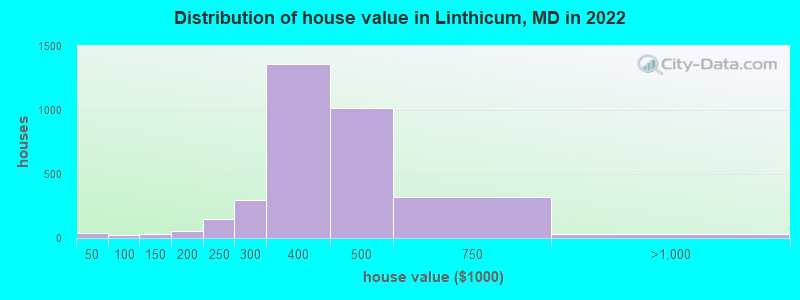
Estimated median house or condo value in 2022: $385,310 (it was $150,400 in 2000 )
Linthicum:
$385,310Maryland:
$398,100
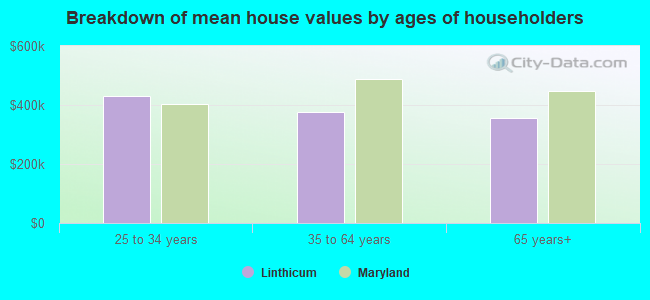
Lower value quartile - upper value quartile: $324,163 - $457,494Mean price in 2022: Detached houses: $391,007 Here:
$391,007State:
$526,819
Townhouses or other attached units: $288,518 Here:
$288,518State:
$328,305
In 2-unit structures: $597,891 Here:
$597,891State:
$346,599
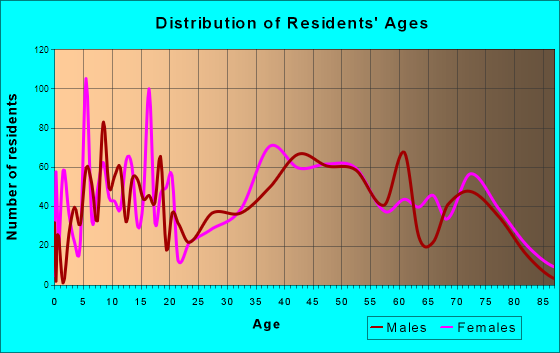
Total population: 10,324 (Urban population: 7,507, Rural population: 0)
Houses: 4,435 (4,169 occupied: 3,420 owner occupied, 775 renter occupied )
% of renters here:
18%State:
32%
Housing density: 1,055 houses/condos per square mile
Median price asked for vacant for-sale houses and condos in 2022 in this county: $157,543.
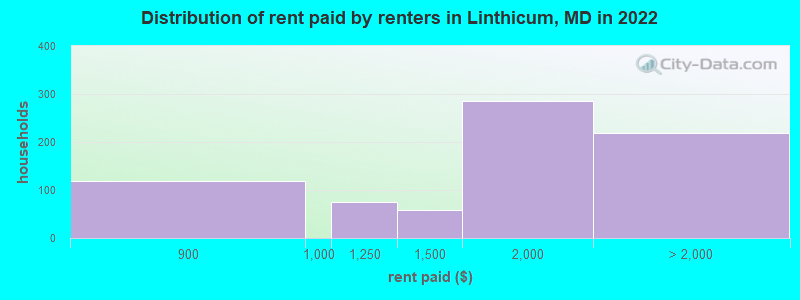
Median contract rent in 2022: $1,638 (lower quartile is $1,155, upper quartile is $1,939)
Median rent asked for vacant for-rent units in 2022: $1,337
Median gross rent in Linthicum, MD in 2022: $1,708
Housing units in Linthicum with a mortgage: 2,336 (295 second mortgage, 4 home equity loan, 196 both second mortgage and home equity loan )Houses without a mortgage: 82
Median household income for houses/condos with a mortgage: $128,791
Median household income for apartments without a mortgage: $97,118
Median monthly housing costs: $1,704
Data:
Median house or condo value ($)
Median house or condo value ($ change since 2000)
Median house or condo value ($) - White
Median house or condo value ($) - Black or African American
Median house or condo value ($) - Asian
Median house or condo value ($) - Hispanic or Latino
Median house or condo value ($) - American Indian and Alaska Native
Median house or condo value ($) - Multirace
Median house or condo value ($) - Other Race
Median price asked for mobile homes ($)
Household density (households per square mile)
Mean house or condo value by units in structure - 1, detached ($)
Mean house or condo value by units in structure - 1, attached ($)
Mean house or condo value by units in structure - 2 ($)
Mean house or condo value by units in structure by units in structure - 3 or 4 ($)
Mean house or condo value by units in structure - 5 or more ($)
Mean house or condo value by units in structure - Boat, RV, van, etc. ($)
Mean house or condo value by units in structure - Mobile home ($)
Median contract rent ($)
Median contract rent - Lower quartile ($)
Median contract rent - Upper quartile ($)
Median gross rent ($)
Urban houses (%)
Rural houses (%)
Houses occupied (%)
Houses occupied (% change since 2000)
Houses owner occupied (%)
Houses owner occupied (% change since 2000)
Houses renter occupied (%)
Houses renter occupied (% change since 2000)
Vacant housing units - For rent (%)
Vacant housing units - For rent (% change since 2000)
Vacant housing units - For sale only (%)
Vacant housing units - For sale only (% change since 2000)
Vacant housing units - Rented or sold, not occupied (%)
Vacant housing units - Rented or sold, not occupied (% change since 2000)
Vacant housing units - For seasonal, recreational, or occasional use (%)
Vacant housing units - For seasonal, recreational, or occasional use (% change since 2000)
Vacant housing units - For migrant workers (%)
Vacant housing units - For migrant workers (% change since 2000)
Vacant housing units - Other vacant (%)
Vacant housing units - Other vacant (% change since 2000)
Median monthly housing costs ($)
Median household income for houses/condos with a mortgage ($)
Median household income for houses/condos without a mortgage ($)
Median household income ($)
Median household income ($) - White
Median household income ($) - Black or African American
Median household income ($) - Asian
Median household income ($) - Hispanic or Latino
Median household income ($) - American Indian and Alaska Native
Median household income ($) - Multirace
Median household income ($) - Other Race
Mortgage status - with mortgage (%)
Mortgage status - with second mortgage (%)
Mortgage status - with home equity loan (%)
Mortgage status - with both second mortgage and home equity loan (%)
Mortgage status - without a mortgage (%)
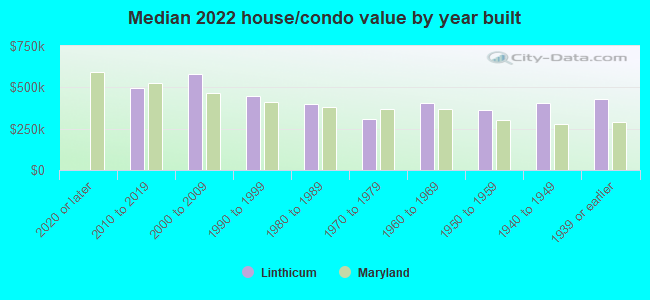
Median year house/condo built
Median year apartment built
Household type by relationship - Male householder living alone (%)
Household type by relationship - Male householder not living alone (%)
Household type by relationship - Female householder living alone (%)
Household type by relationship - Female householder not living alone (%)
Household type by relationship - Opposite-Sex spouse (%)
Household type by relationship - Same-Sex spouse (%)
Household type by relationship - Opposite-Sex unmarried partner (%)
Household type by relationship - Same-Sex unmarried partner (%)
Household type by relationship - In group quarters (%)
Size of family households - 2-person household (%)
Size of family households - 3-person household (%)
Size of family households - 4-person household (%)
Size of family households - 5-person household (%)
Size of family households - 6-person household (%)
Size of family households - 7-or-more-person household (%)
Size of nonfamily households - 1-person household (%)
Size of nonfamily households - 2-person household (%)
Size of nonfamily households - 3-person household (%)
Size of nonfamily households - 4-person household (%)
Size of nonfamily households - 5-person household (%)
Size of nonfamily households - 6-person household (%)
Size of nonfamily households - 7-or-moreperson household (%)
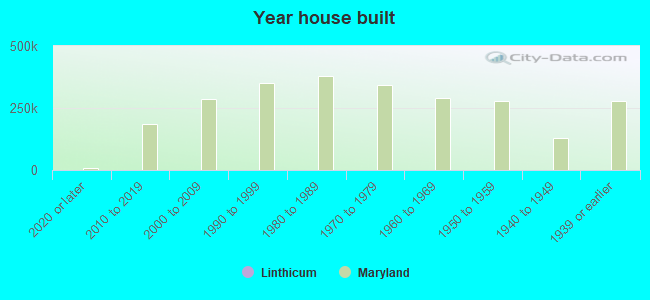
Year house built - Built 2010 or later (%)
Year house built - Built 2000 to 2009 (%)
Year house built - Built 1990 to 1999 (%)
Year house built - Built 1980 to 1989 (%)
Year house built - Built 1970 to 1979 (%)
Year house built - Built 1960 to 1969 (%)
Year house built - Built 1950 to 1959 (%)
Year house built - Built 1940 to 1949 (%)
Year house built - Built 1939 or earlier (%)
Median number of rooms in houses and condos
Median number of rooms in apartments
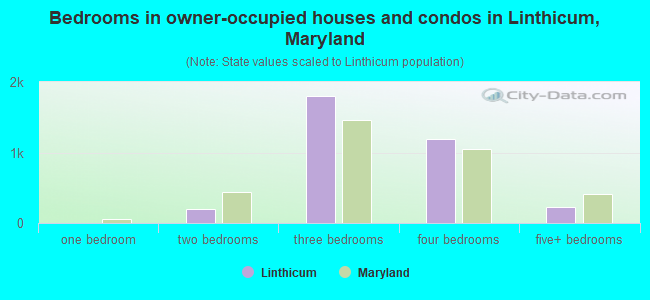
Median number of bedrooms in owner occupied houses
Mean number of bedrooms in owner occupied houses
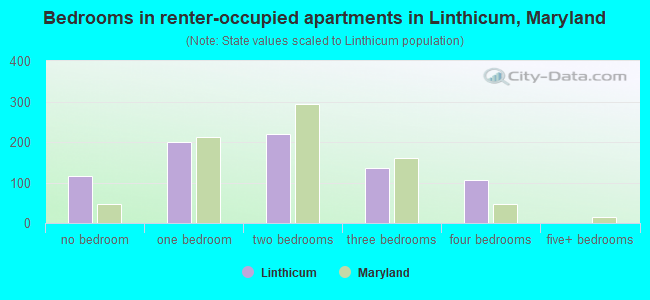
Median number of bedrooms in renter occupied houses
Mean number of bedrooms in renter occupied houses
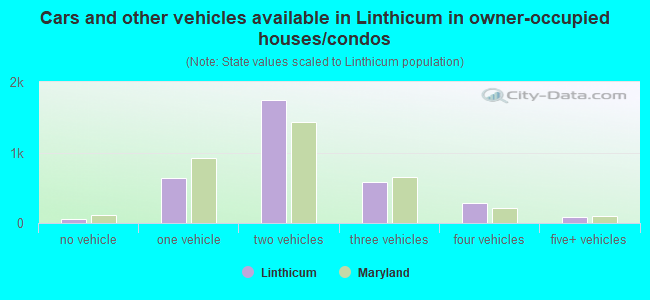
Median number of vehichles in owner occupied houses
Mean number of vehichles in owner occupied houses
Median number of vehichles in renter occupied houses
Mean number of vehichles in renter occupied houses
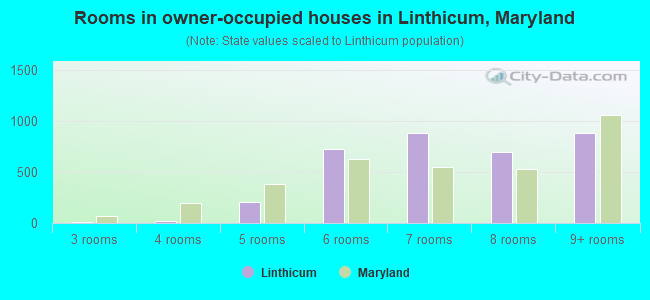
Rooms in owner-occupied houses - 1 room (%)
Rooms in owner-occupied houses - 2 rooms (%)
Rooms in owner-occupied houses - 3 rooms (%)
Rooms in owner-occupied houses - 4 rooms (%)
Rooms in owner-occupied houses - 5 rooms (%)
Rooms in owner-occupied houses - 6 rooms (%)
Rooms in owner-occupied houses - 7 rooms (%)
Rooms in owner-occupied houses - 8 rooms (%)
Rooms in owner-occupied houses - 9+ rooms (%)
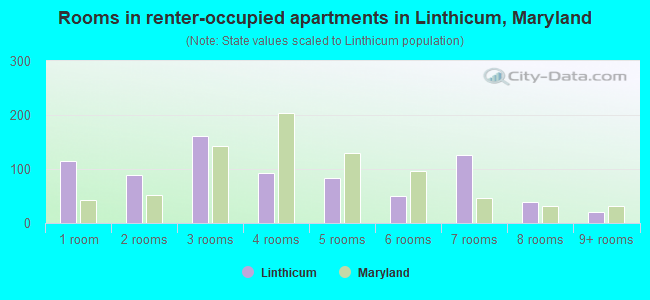
Rooms in renter-occupied houses - 1 room (%)
Rooms in renter-occupied houses - 2 rooms (%)
Rooms in renter-occupied houses - 3 rooms (%)
Rooms in renter-occupied houses - 4 rooms (%)
Rooms in renter-occupied houses - 5 rooms (%)
Rooms in renter-occupied houses - 6 rooms (%)
Rooms in renter-occupied houses - 7 rooms (%)
Rooms in renter-occupied houses - 8 rooms (%)
Rooms in renter-occupied houses - 9+ rooms (%)
Bedrooms in owner-occupied houses - no bedrooms (%)
Bedrooms in owner-occupied houses - 1 bedroom (%)
Bedrooms in owner-occupied houses - 2 bedrooms (%)
Bedrooms in owner-occupied houses - 3 bedrooms (%)
Bedrooms in owner-occupied houses - 4 bedrooms (%)
Bedrooms in owner-occupied houses - 5+ bedrooms (%)
Bedrooms in renter-occupied houses - no bedrooms (%)
Bedrooms in renter-occupied houses - 1 bedroom (%)
Bedrooms in renter-occupied houses - 2 bedrooms (%)
Bedrooms in renter-occupied houses - 3 bedrooms (%)
Bedrooms in renter-occupied houses - 4 bedrooms (%)
Bedrooms in renter-occupied houses - 5+ bedrooms (%)
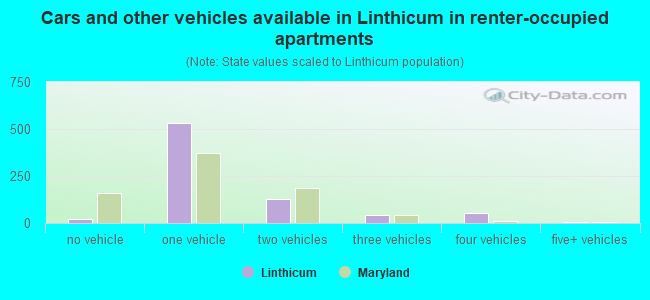
Vehicles available in owner-occupied houses - no vehicle available (%)
Vehicles available in owner-occupied houses - 1 vehicle available(%)
Vehicles available in owner-occupied houses - 2 Vehicles available (%)
Vehicles available in owner-occupied houses - 3 Vehicles available (%)
Vehicles available in owner-occupied houses - 4 Vehicles available (%)
Vehicles available in owner-occupied houses - 5+ Vehicles available (%)
Vehicles available in renter-occupied houses - no vehicle available (%)
Vehicles available in renter-occupied houses - 1 vehicle available (%)
Vehicles available in renter-occupied houses - 2 Vehicles available (%)
Vehicles available in renter-occupied houses - 3 Vehicles available (%)
Vehicles available in renter-occupied houses - 4 Vehicles available (%)
Vehicles available in renter-occupied houses - 5+ Vehicles available (%)
Housing units in structures - 1, detached (%)
Housing units in structures - 1, attached (%)
Housing units in structures - 2 (%)
Housing units in structures - 3 or 4 (%)
Housing units in structures - 5 to 9 (%)
Housing units in structures - 10 to 19 (%)
Housing units in structures - 20 to 49 (%)
Housing units in structures - 50 or more (%)
Housing units in structures - Mobile home (%)
Housing units in structures - Boat, RV, van, etc. (%)
Housing units in structures - Owners - 1, detached (%)
Housing units in structures - Owners - 1, attached (%)
Housing units in structures - Owners - 2 (%)
Housing units in structures - Owners - 3 or 4 (%)
Housing units in structures - Owners - 5 to 9 (%)
Housing units in structures - Owners - 10 to 19 (%)
Housing units in structures - Owners - 20 to 49 (%)
Housing units in structures - Owners - 50 or more (%)
Housing units in structures - Owners - Mobile home (%)
Housing units in structures - Owners - Boat, RV, van, etc. (%)
Housing units in structures - Renters - 1, detached (%)
Housing units in structures - Renters - 1, attached (%)
Housing units in structures - Renters - 2 (%)
Housing units in structures - Renters - 3 or 4 (%)
Housing units in structures - Renters - 5 to 9 (%)
Housing units in structures - Renters - 10 to 19 (%)
Housing units in structures - Renters - 20 to 49 (%)
Housing units in structures - Renters - 50 or more (%)
Housing units in structures - Renters - Mobile home (%)
Housing units in structures - Renters - Boat, RV, van, etc. (%)
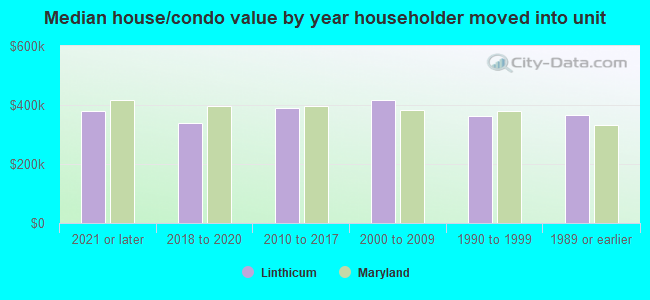
House/condo owner moved in on average (years ago)
Renter moved in on average (years ago)
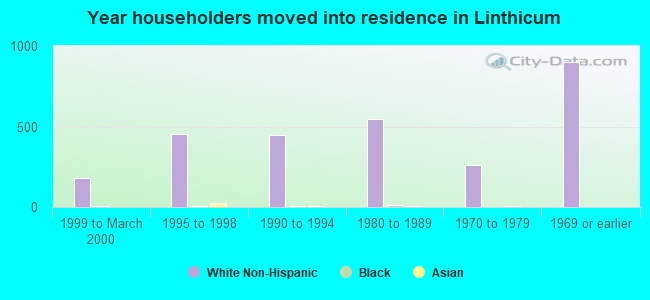
Year householder moved into unit - Moved in 1999 to March 2000 (%)
Year householder moved into unit - Moved in 1999 to March 2000 (%) - White
Year householder moved into unit - Moved in 1999 to March 2000 (%) - Black or African American
Year householder moved into unit - Moved in 1999 to March 2000 (%) - Asian
Year householder moved into unit - Moved in 1999 to March 2000 (%) - Hispanic or Latino
Year householder moved into unit - Moved in 1999 to March 2000 (%) - American Indian and Alaska Native
Year householder moved into unit - Moved in 1999 to March 2000 (%) - Multirace
Year householder moved into unit - Moved in 1999 to March 2000 (%) - Other Race
Year householder moved into unit - Moved in 1995 to 1998 (%)
Year householder moved into unit - Moved in 1995 to 1998 (%) - White
Year householder moved into unit - Moved in 1995 to 1998 (%) - Black or African American
Year householder moved into unit - Moved in 1995 to 1998 (%) - Asian
Year householder moved into unit - Moved in 1995 to 1998 (%) - Hispanic or Latino
Year householder moved into unit - Moved in 1995 to 1998 (%) - American Indian and Alaska Native
Year householder moved into unit - Moved in 1995 to 1998 (%) - Multirace
Year householder moved into unit - Moved in 1995 to 1998 (%) - Other Race
Year householder moved into unit - Moved in 1990 to 1994 (%)
Year householder moved into unit - Moved in 1990 to 1994 (%) - White
Year householder moved into unit - Moved in 1990 to 1994 (%) - Black or African American
Year householder moved into unit - Moved in 1990 to 1994 (%) - Asian
Year householder moved into unit - Moved in 1990 to 1994 (%) - Hispanic or Latino
Year householder moved into unit - Moved in 1990 to 1994 (%) - American Indian and Alaska Native
Year householder moved into unit - Moved in 1990 to 1994 (%) - Multirace
Year householder moved into unit - Moved in 1990 to 1994 (%) - Other Race
Year householder moved into unit - Moved in 1980 to 1989 (%)
Year householder moved into unit - Moved in 1980 to 1989 (%) - White
Year householder moved into unit - Moved in 1980 to 1989 (%) - Black or African American
Year householder moved into unit - Moved in 1980 to 1989 (%) - Asian
Year householder moved into unit - Moved in 1980 to 1989 (%) - Hispanic or Latino
Year householder moved into unit - Moved in 1980 to 1989 (%) - American Indian and Alaska Native
Year householder moved into unit - Moved in 1980 to 1989 (%) - Multirace
Year householder moved into unit - Moved in 1980 to 1989 (%) - Other Race
Year householder moved into unit - Moved in 1970 to 1979 (%)
Year householder moved into unit - Moved in 1970 to 1979 (%) - White
Year householder moved into unit - Moved in 1970 to 1979 (%) - Black or African American
Year householder moved into unit - Moved in 1970 to 1979 (%) - Asian
Year householder moved into unit - Moved in 1970 to 1979 (%) - Hispanic or Latino
Year householder moved into unit - Moved in 1970 to 1979 (%) - American Indian and Alaska Native
Year householder moved into unit - Moved in 1970 to 1979 (%) - Multirace
Year householder moved into unit - Moved in 1970 to 1979 (%) - Other Race
Year householder moved into unit - Moved in 1969 or earlier (%)
Year householder moved into unit - Moved in 1969 or earlier (%) - White
Year householder moved into unit - Moved in 1969 or earlier (%) - Black or African American
Year householder moved into unit - Moved in 1969 or earlier (%) - Asian
Year householder moved into unit - Moved in 1969 or earlier (%) - Hispanic or Latino
Year householder moved into unit - Moved in 1969 or earlier (%) - American Indian and Alaska Native
Year householder moved into unit - Moved in 1969 or earlier (%) - Multirace
Year householder moved into unit - Moved in 1969 or earlier (%) - Other Race
Housing units lacking complete plumbing facilities (%)
Housing units lacking complete kitchen facilities (%)
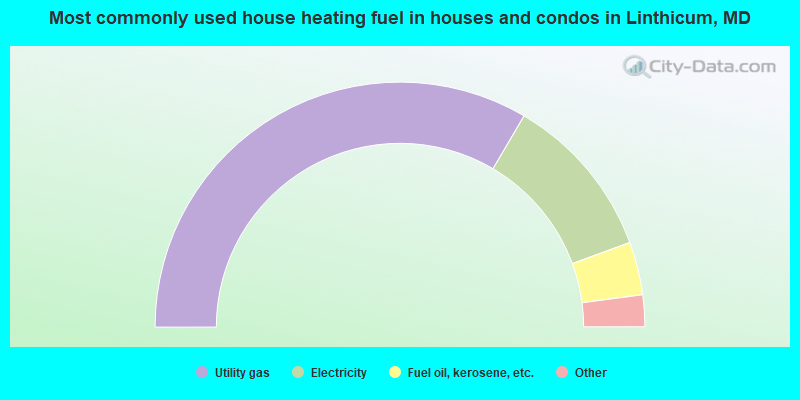
House heating fuel used in houses and condos - Utility gas (%)
House heating fuel used in houses and condos - Bottled, tank, or LP gas (%)
House heating fuel used in houses and condos - Electricity (%)
House heating fuel used in houses and condos - Fuel oil, kerosene, etc. (%)
House heating fuel used in houses and condos - Coal or coke (%)
House heating fuel used in houses and condos - Wood (%)
House heating fuel used in houses and condos - Solar energy (%)
House heating fuel used in houses and condos - Other fuel (%)
House heating fuel used in houses and condos - No fuel used (%)
House heating fuel used in apartments - Utility gas (%)
House heating fuel used in apartments - Bottled, tank, or LP gas (%)
House heating fuel used in apartments - Electricity (%)
House heating fuel used in apartments - Fuel oil, kerosene, etc. (%)
House heating fuel used in apartments - Coal or coke (%)
House heating fuel used in apartments - Wood (%)
House heating fuel used in apartments - Solar energy (%)
House heating fuel used in apartments - Other fuel (%)
House heating fuel used in apartments - No fuel used (%)
Latest news about housing in Linthicum, MD collected exclusively by city-data.com from local newspapers, TV, and radio stations
Median year house/condo built: 1958Median year apartment built: 1978Household type by relationship:
Households: 10,825
Male householders: 2,267 (474 living alone ), Female householders: 1,879 (485 living alone )2,191 spouses (2,171 opposite-sex spouses ), 262 unmarried partners , (255 opposite-sex unmarried partners ), 3,151 children (3,106 natural , 20 adopted , 25 stepchildren ), 190 grandchildren , 73 brothers or sisters , 189 parents , 0 foster children , 101 other relatives , 466 non-relatives In group quarters: 51
Size of family households: 1,364 2-persons , 495 3-persons , 514 4-persons , 315 5-persons , 77 6-persons , 30 7-or-more-persons .
Size of nonfamily households: 1,005 1-person , 289 2-persons , 35 3-persons , 50 4-persons .
1,934 married couples with children. single-parent households (103 men , 284 women ).
91.7% of residents of Linthicum speak English at home. of residents speak Spanish at home (53% speak English very well , 27% speak English well , 20% speak English not well ).of residents speak other Indo-European language at home (58% speak English very well , 9% speak English well , 17% speak English not well , 16% don't speak English at all ).of residents speak Asian or Pacific Island language at home (88% speak English very well , 10% speak English well , 1% speak English not well ).of residents speak other language at home (100% speak English very well ).
Foreign born population: 664 (6.1%)of them are naturalized citizens )
Median number of rooms in houses and condos:
Median number of rooms in apartments
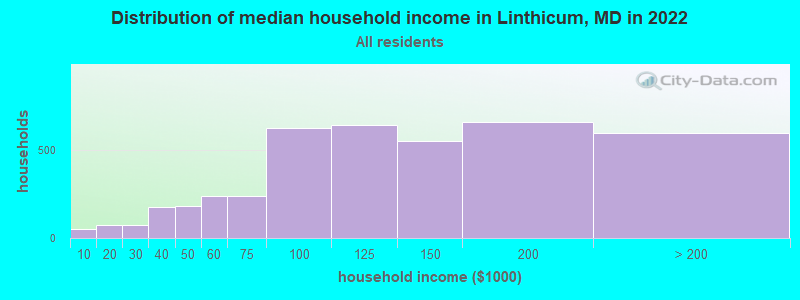
Linthicum, MD household income distribution 49 Less than $10,00074 $10,000 to $19,99976 $20,000 to $29,999177 $30,000 to $39,999182 $40,000 to $49,999241 $50,000 to $59,999237 $60,000 to $74,999625 $75,000 to $99,999639 $100,000 to $124,999552 $125,000 to $149,999658 $150,000 to $199,999596 $200,000 or more
Home value of owner - occupied houses in 2022 in Linthicum, MD 21 Less than $10,0007 $35,000 to $39,99911 $40,000 to $49,99910 $70,000 to $79,99911 $100,000 to $124,99921 $125,000 to $149,99951 $150,000 to $174,999149 $200,000 to $249,999295 $250,000 to $299,9991,358 $300,000 to $399,9991,015 $400,000 to $499,999317 $500,000 to $749,99930 $750,000 to $999,9992 $2,000,000 or moreRent paid by renters in 2022 in Linthicum, MD 117 $800 to $89975 $1,000 to $1,24957 $1,250 to $1,499285 $1,500 to $1,999142 $2,000 to $2,49976 No cash rent
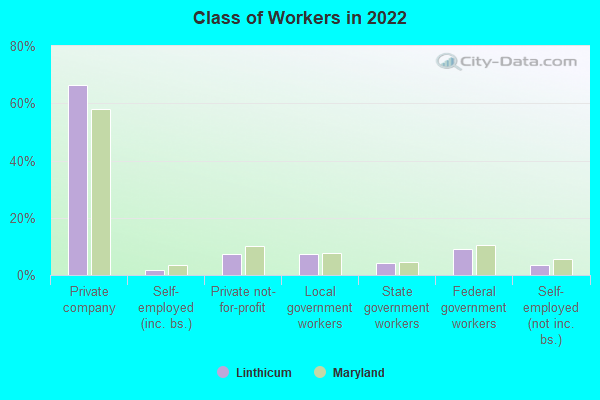
Percentage of workers working in this county: 64.9%Number of people working at home: 847 (14.4% of all workers )
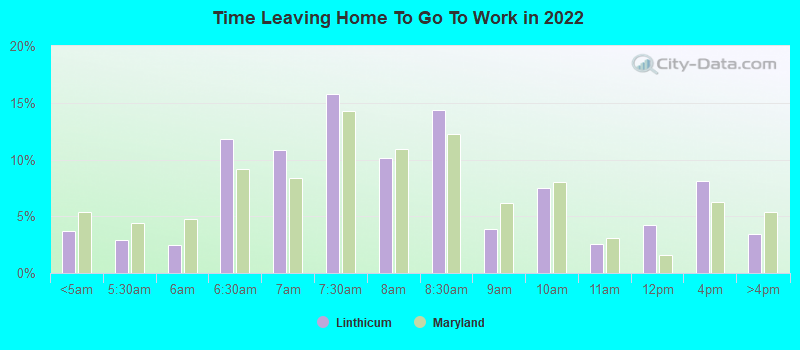
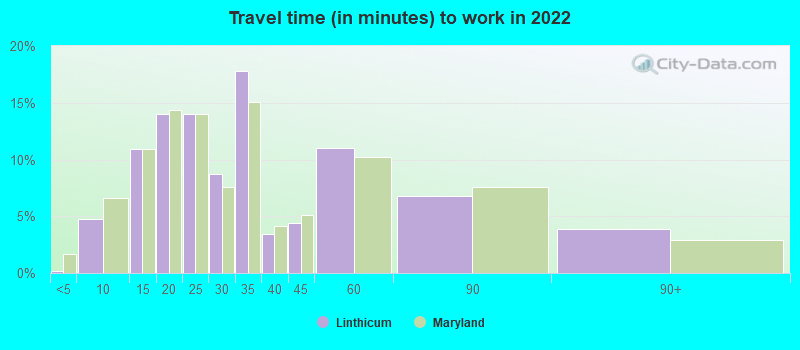
Travel time to work (commute)
Less than 5 minutes: 445 to 9 minutes: 43410 to 14 minutes: 81915 to 19 minutes: 1,10220 to 24 minutes: 78825 to 29 minutes: 44930 to 34 minutes: 71835 to 39 minutes: 11540 to 44 minutes: 12945 to 59 minutes: 26360 to 89 minutes: 11690 or more minutes: 100
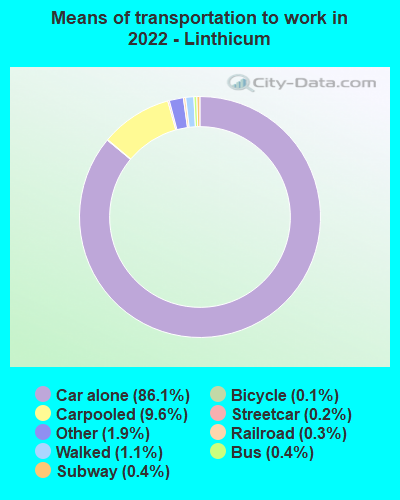
Means of transportation to work:
Drove a car alone: 12,891 (78.7%)Carpooled: 1,443 (8.8%)Bus : 30 (0.2%)Subway or elevated rail : 20 (0.1%)Long-distance train or commuter rail : 34 (0.2%)Light rail, streetcar or trolley : 24 (0.1%)Taxi: 346 (2.1%)Bicycle: 17 (0.1%)Walked: 161 (1.0%)Worked at home: 847 (5.2%)
Unemployment by race in 2022
Unemployment rate for White non-Hispanic residents 1.6% Males0.8% FemalesUnemployment rate for Black residents 2.7% Males20.1% FemalesUnemployment rate for two or more race residents 4.7% Males5.4% FemalesUnemployment rate for Hispanic or Latino residents 6.7% Females
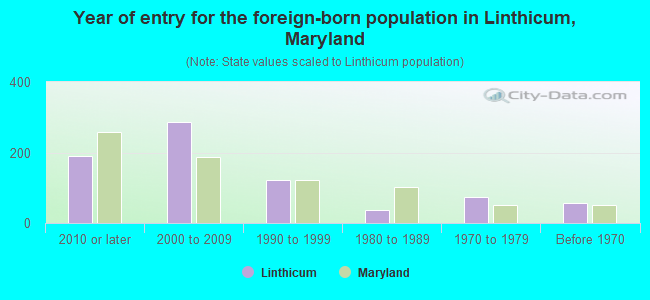
Year of entry for the foreign-born population in Linthicum, Maryland
191 2010 or later 287 2000 to 2009 123 1990 to 1999 38 1980 to 1989 74 1970 to 1979 58 Before 1970
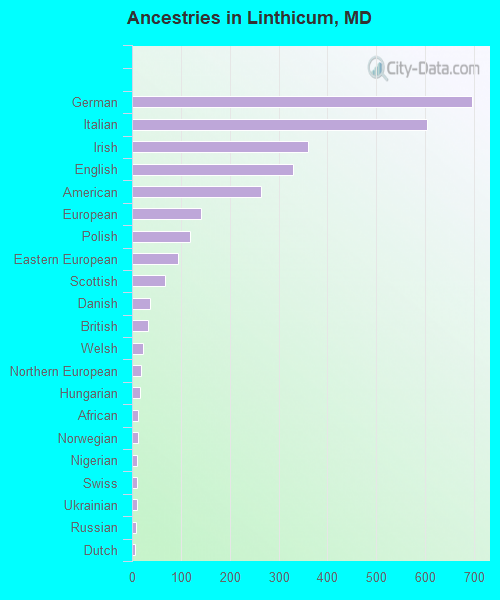
First ancestries reported:
German: 696 (16.9%)
Italian: 603 (14.6%)
Irish: 360 (8.7%)
English: 330 (8.0%)
American: 265 (6.4%)
European: 141 (3.4%)
Polish: 119 (2.9%)
Eastern European: 95 (2.3%)
Scottish: 67 (1.6%)
Danish: 37 (0.9%)
British: 32 (0.8%)
Welsh: 22 (0.5%)
Northern European: 18 (0.4%)
Hungarian: 16 (0.4%)
African: 13 (0.3%)
Norwegian: 12 (0.3%)
Nigerian: 11 (0.3%)
Swiss: 11 (0.3%)
Ukrainian: 11 (0.3%)
Russian: 8 (0.2%)
Dutch: 7 (0.2%)
Lithuanian: 6 (0.1%)
Slovak: 6 (0.1%)
Yugoslavian: 2 (0.05%)
French Canadian: 1 (0.02%) Most common places of birth for foreign-born residents (%): Bangladesh Linthicum:
21.6% (148)Maryland:
0.7% (7,124)
Korea Linthicum:
12.5% (86)Maryland:
3.4% (32,635)
Philippines Linthicum:
12.4% (85)Maryland:
3.8% (36,698)
England Linthicum:
8.7% (60)Maryland:
0.6% (5,828)
China, excluding Hong Kong and Taiwan Linthicum:
8.5% (58)Maryland:
4.6% (44,742)
Guatemala Linthicum:
6.1% (42)Maryland:
4.4% (42,350)
Pakistan Linthicum:
5.1% (35)Maryland:
1.8% (17,037)
Honduras Linthicum:
3.1% (21)Maryland:
2.5% (24,026)
Azerbaijan Linthicum:
2.8% (19)Maryland:
0.1% (1,071)
Germany Linthicum:
2.8% (19)Maryland:
1.2% (11,265)
Kenya Linthicum:
2.5% (17)Maryland:
0.8% (7,497)
Dominican Republic Linthicum:
2.3% (16)Maryland:
1.4% (13,947)
Taiwan Linthicum:
2.2% (15)Maryland:
0.9% (8,520)
Scotland Linthicum:
1.7% (12)Maryland:
0.1% (738)
Argentina Linthicum:
1.7% (12)Maryland:
0.4% (4,282)
Place of birth for U.S.-born residents:
This state: 7,179Other state: 2,686Northeast: 722Midwest: 543South: 984West: 433 90.0% of Linthicum residents lived in the same house 1 years ago.
Out of people who lived in different houses, 33.9% lived in this county.
Out of people who lived in different counties, 36.3% lived in Maryland.
Linthicum:
90.0%State average:
88.5%
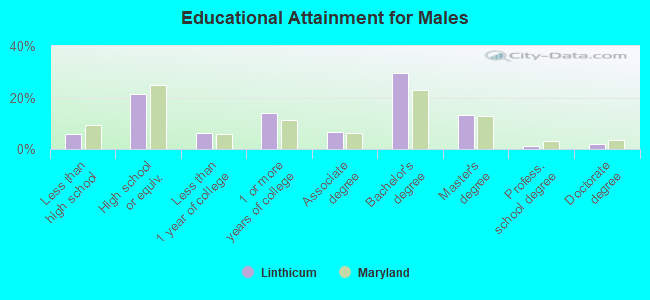
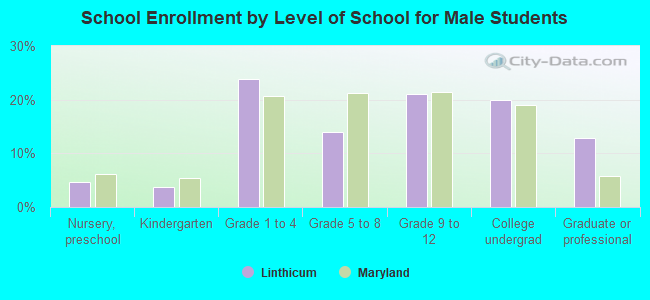
Education attainment for males 25 years and older:
No schooling: 34Nursery to 4th grade: 05th and 6th grade: 257th and 8th grade: 149th grade: 1610th grade: 3111th grade: 7212th grade, no diploma: 38High school graduate (or equivalency): 834Less than 1 year of college: 246Some college more than 1 year, no degree: 554Associate degree: 253Bachelor's degree: 1,160Master's degree: 520Professional school degree: 50Doctorate degree: 72
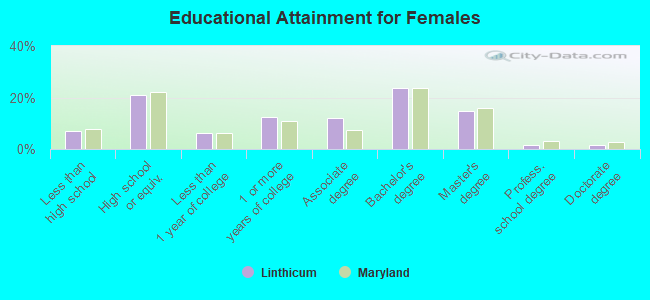
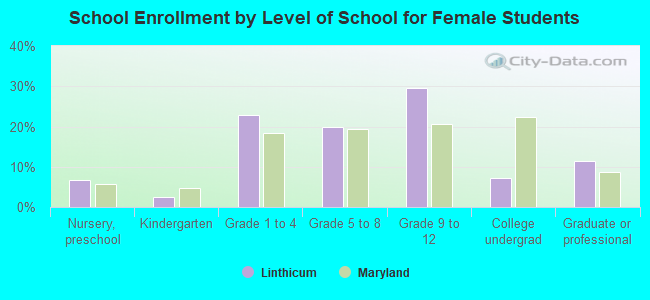
Education attainment for females 25 years and older:
No schooling: 36Nursery to 4th grade: 85th and 6th grade: 97th and 8th grade: 59th grade: 1910th grade: 5811th grade: 5812th grade, no diploma: 69High school graduate (or equivalency): 800Less than 1 year of college: 237Some college more than 1 year, no degree: 480Associate degree: 458Bachelor's degree: 904Master's degree: 572Professional school degree: 56Doctorate degree: 61
Housing units in structures:
One, detached: 3,722One, attached: 127Two: 495 to 9: 8610 to 19: 10320 to 49: 13950 or more: 205Housing units lacking complete plumbing facilities in 2022: 0.5%Housing units lacking complete kitchen facilities in 2022: 0.6%House/condo owner moved in on average 20 years ago
Renter moved in on average 1 years ago
Private vs. public school enrollment:
Students in private schools in grades 1 to 8 (elementary and middle school): 120 Students in private schools in grades 9 to 12 (high school): 155 Students in private undergraduate colleges: 37