Jump to a detailed profile or search site with Google Custom Search

Lionville-Marchwood, PA (Pennsylvania) Houses and Residents

Estimated median house or condo value in 2022: $416,138 (it was $163,800 in 2000)
Lionville-Marchwood:

$416,138
Pennsylvania:

$245,500
Lower value quartile - upper value quartile: $296,221 - $484,197

Total population: 6,189 (All urban)

Houses: 2,680 (2,598 occupied: 1,690 owner occupied, 908 renter occupied)

% of renters here:

35%
State:

31%

Housing density: 1,082 houses/condos per square mile

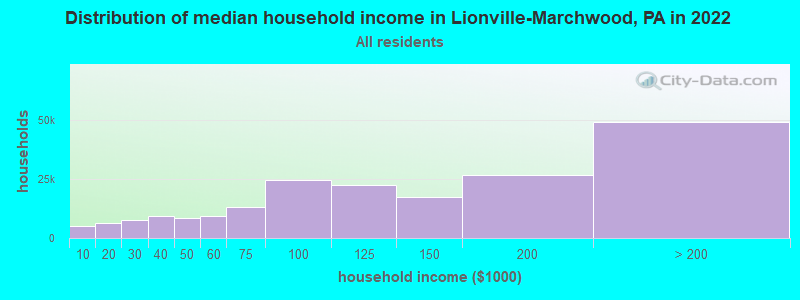
Median price asked for vacant for-sale houses and condos in 2022 in this county: $402,427.

Median contract rent in 2022: $1,590 (lower quartile is $1,406, upper quartile is $1,891)


Median rent asked for vacant for-rent units in 2022: $1,508


Median gross rent in Lionville-Marchwood, PA in 2022: $1,831

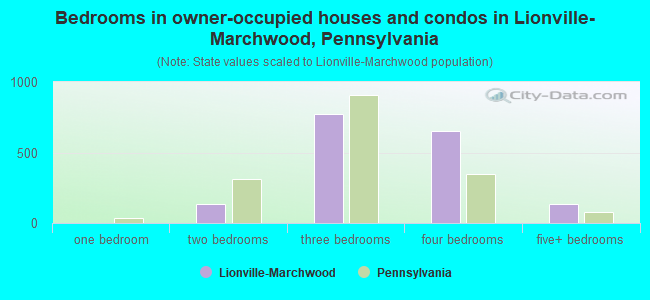
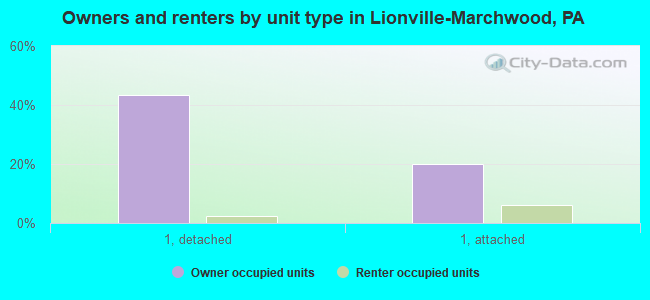
Housing units in Lionville-Marchwood with a mortgage: 1,170 (104 second mortgage, 168 home equity loan, 0 both second mortgage and home equity loan)
Houses without a mortgage: 430

Compare current foreclosures near Lionville-Marchwood, PA:

Check out more offers near Lionville-Marchwood, PA.
Powered by Foreclosure.com


Lionville-Marchwood, PA forum
Discuss Lionville-Marchwood, Pennsylvania housing on our local forum with over 2,400,000 registered users
Lionville-Marchwood, Pennsylvania Age and Sex of Residents

Household type by relationship:

Households: 485,550
  • In family households: 415,311 (98,212 male householders, 30,926 female householders)
    107,144 spouses, 150,830 children (142,968 natural, 3,496 adopted, 4,366 stepchildren), 6,188 grandchildren, 3,284 brothers or sisters, 3,754 parents, foster children, 4,217 other relatives, 7,637 non-relatives
  • In nonfamily households: 70,239 (23,940 male householders (17,335 living alone)), 29,822 female householders (24,697 living alone)), 16,477 nonrelatives
  • In group quarters: 13,336 (4,033 institutionalized population)

90,549 married couples with children.
15,662 single-parent households (3,845 men, 11,817 women).

88.7% of residents of Lionville-Marchwood speak English at home.
2.5% of residents speak Spanish at home (51% speak English very well, 23% speak English well, 26% speak English not well).
6.1% of residents speak other Indo-European language at home (67% speak English very well, 22% speak English well, 11% speak English not well).
2.2% of residents speak Asian or Pacific Island language at home (93% speak English very well, 7% speak English not well).
0.6% of residents speak other language at home (76% speak English very well, 24% speak English well).

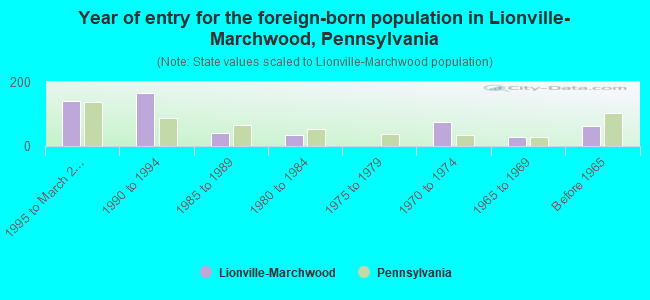
Foreign born population: 1,243 (15.8%)
(86.5% of them are naturalized citizens)

Median number of rooms in houses and condos:
Here:

7.8
State:

6.8

Median number of rooms in apartments
Here:

4.1
State:

4.3

Owner-occupied Renter-occupied
Bedrooms in owner-occupied houses and condos in Lionville-Marchwood, Pennsylvania
  • Bedrooms in owner-occupied houses and condos in Lionville-Marchwood, Pennsylvania
  • 0no bedroom
  • 01 bedroom
  • 1362 bedrooms
  • 7703 bedrooms
  • 6504 bedrooms
  • 1345+ bedrooms
Bedrooms in renter-occupied apartments in Lionville-Marchwood, Pennsylvania
  • Bedrooms in renter-occupied apartments in Lionville-Marchwood, Pennsylvania
  • 36no bedroom
  • 2441 bedroom
  • 4492 bedrooms
  • 1733 bedrooms
  • 64 bedrooms
  • 05+ bedrooms
Owner-occupied Renter-occupied
Cars and other vehicles available in Lionville-Marchwood in owner-occupied houses/condos
  • Cars and other vehicles available in Lionville-Marchwood in owner-occupied houses/condos
  • 21no vehicle
  • 4251 vehicle
  • 8832 vehicles
  • 2893 vehicles
  • 724 vehicles
  • 05+ vehicles
Cars and other vehicles available in Lionville-Marchwood in renter-occupied apartments
  • Cars and other vehicles available in Lionville-Marchwood in renter-occupied apartments
  • 10no vehicle
  • 6401 vehicle
  • 2492 vehicles
  • 93 vehicles
  • 04 vehicles
  • 05+ vehicles
Owner-occupied Renter-occupied
Rooms in owner-occupied houses in Lionville-Marchwood, Pennsylvania
  • Rooms in owner-occupied houses in Lionville-Marchwood, Pennsylvania
  • 01 room
  • 02 rooms
  • 73 rooms
  • 944 rooms
  • 1265 rooms
  • 2636 rooms
  • 3357 rooms
  • 5138 rooms
  • 3529+ rooms
Rooms in renter-occupied apartments in Lionville-Marchwood, Pennsylvania
  • Rooms in renter-occupied apartments in Lionville-Marchwood, Pennsylvania
  • 361 room
  • 82 rooms
  • 1703 rooms
  • 3094 rooms
  • 2165 rooms
  • 1206 rooms
  • 497 rooms
  • 08 rooms
  • 09+ rooms
Year house built
Breakdown of mean house values by ages of householders
Owners and renters by unit type in Lionville-Marchwood, PA
  • Lionville-Marchwood, PA household income distribution

  • Distribution of median household income in Lionville-Marchwood, PA in 2022
  • 5,070Less than $10,000
  • 6,497$10,000 to $19,999
  • 7,444$20,000 to $29,999
  • 9,216$30,000 to $39,999
  • 8,352$40,000 to $49,999
  • 9,248$50,000 to $59,999
  • 13,266$60,000 to $74,999
  • 24,565$75,000 to $99,999
  • 22,378$100,000 to $124,999
  • 17,315$125,000 to $149,999
  • 26,616$150,000 to $199,999
  • 49,280$200,000 or more

Percentage of workers working in this county: 80.5%
Number of people working at home: 995 (22.2% of all workers)

Travel time to work (commute)

  • Less than 5 minutes: 54
  • 5 to 9 minutes: 370
  • 10 to 14 minutes: 501
  • 15 to 19 minutes: 519
  • 20 to 24 minutes: 548
  • 25 to 29 minutes: 119
  • 30 to 34 minutes: 288
  • 35 to 39 minutes: 88
  • 40 to 44 minutes: 78
  • 45 to 59 minutes: 332
  • 60 to 89 minutes: 295
  • 90 or more minutes: 55

Means of transportation to work:

  • Drove a car alone: 2,941 (86.4%)
  • Carpooled: 148 (4.3%)
  • Railroad: 119 (3.5%)
  • Taxi: 12 (0.4%)
  • Bicycle: 8 (0.2%)
  • Other means: 19 (0.6%)
  • Worked at home: 158 (4.6%)
Class of Workers in 2000
Year of entry for the foreign-born population in Lionville-Marchwood, Pennsylvania
  • Year of entry for the foreign-born population in Lionville-Marchwood, Pennsylvania
  • 1411995 to March 2000
  • 1671990 to 1994
  • 401985 to 1989
  • 351980 to 1984
  • 01975 to 1979
  • 741970 to 1974
  • 281965 to 1969
  • 64Before 1965
Ancestries in Lionville-Marchwood, PA

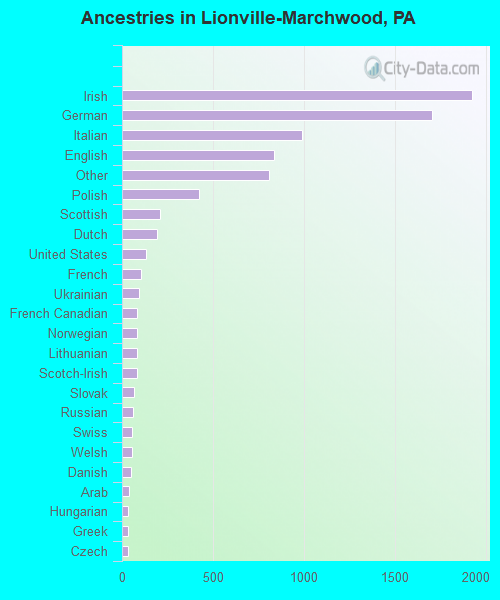
First ancestries reported:

  • Irish: 1,921 (23.5%)
  • German: 1,706 (20.8%)
  • Italian: 991 (12.1%)
  • English: 834 (10.2%)
  • Other: 810 (9.9%)
  • Polish: 424 (5.2%)
  • Scottish: 207 (2.5%)
  • Dutch: 192 (2.3%)
  • United States: 131 (1.6%)
  • French: 104 (1.3%)
  • Ukrainian: 96 (1.2%)
  • French Canadian: 85 (1.0%)
  • Norwegian: 84 (1.0%)
  • Lithuanian: 81 (1.0%)
  • Scotch-Irish: 80 (1.0%)
  • Slovak: 64 (0.8%)
  • Russian: 63 (0.8%)
  • Swiss: 57 (0.7%)
  • Welsh: 53 (0.6%)
  • Danish: 49 (0.6%)
  • Arab: 40 (0.5%)
  • Hungarian: 34 (0.4%)
  • Greek: 32 (0.4%)
  • Czech: 31 (0.4%)
  • Swedish: 17 (0.2%)

Most common places of birth for foreign-born residents (%):

India
Lionville-Marchwood:

15.7% (86)
Pennsylvania:

7.4% (37,541)

Ukraine
Lionville-Marchwood:

12.8% (70)
Pennsylvania:

3.3% (16,897)

Russia
Lionville-Marchwood:

6.6% (36)
Pennsylvania:

2.7% (13,885)

China, excluding Hong Kong and Taiwan
Lionville-Marchwood:

6.6% (36)
Pennsylvania:

4.6% (23,478)

Netherlands
Lionville-Marchwood:

6.2% (34)
Pennsylvania:

0.4% (2,265)

Vietnam
Lionville-Marchwood:

6.0% (33)
Pennsylvania:

5.2% (26,656)

Germany
Lionville-Marchwood:

5.6% (31)
Pennsylvania:

5.1% (25,685)

Poland
Lionville-Marchwood:

5.1% (28)
Pennsylvania:

2.3% (11,916)

Egypt
Lionville-Marchwood:

4.9% (27)
Pennsylvania:

0.7% (3,475)

Romania
Lionville-Marchwood:

4.6% (25)
Pennsylvania:

0.8% (4,274)

Venezuela
Lionville-Marchwood:

4.2% (23)
Pennsylvania:

0.3% (1,648)

Colombia
Lionville-Marchwood:

4.0% (22)
Pennsylvania:

1.3% (6,531)

Czechoslovakia (includes Czech Republic and Slovakia)
Lionville-Marchwood:

3.5% (19)
Pennsylvania:

0.7% (3,451)

United Kingdom
Lionville-Marchwood:

2.7% (15)
Pennsylvania:

4.6% (23,171)

Spain
Lionville-Marchwood:

2.2% (12)
Pennsylvania:

0.3% (1,422)

Other South America
Lionville-Marchwood:

2.0% (11)
Pennsylvania:

0.2% (1,095)

Yugoslavia
Lionville-Marchwood:

1.8% (10)
Pennsylvania:

0.7% (3,328)

Hong Kong
Lionville-Marchwood:

1.6% (9)
Pennsylvania:

0.6% (2,815)

Philippines
Lionville-Marchwood:

1.6% (9)
Pennsylvania:

2.2% (11,411)

Place of birth for U.S.-born residents:

  • This state: 3,753
  • Other state: 1,908
  • Northeast: 993
  • Midwest: 313
  • South: 433
  • West: 169

61% of Lionville-Marchwood residents lived in the same house 5 years ago.
   Out of people who lived in different houses, 53% lived in this county.
   Out of people who lived in different counties, 65% lived in Pennsylvania.

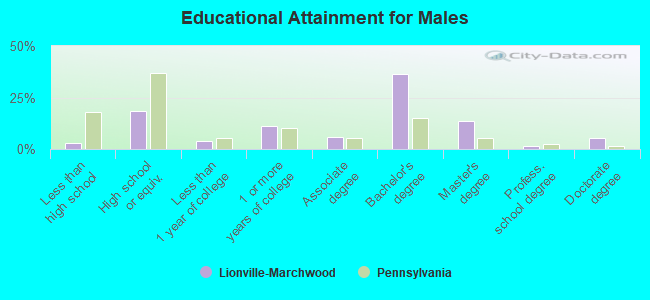
Education attainment for males 25 years and older:

  • No schooling: 0
  • Nursery to 4th grade: 0
  • 5th and 6th grade: 29
  • 7th and 8th grade: 10
  • 9th grade: 0
  • 10th grade: 18
  • 11th grade: 0
  • 12th grade, no diploma: 8
  • High school graduate (or equivalency): 393
  • Less than 1 year of college: 83
  • Some college more than 1 year, no degree: 242
  • Associate degree: 128
  • Bachelor's degree: 781
  • Master's degree: 294
  • Professional school degree: 34
  • Doctorate degree: 114
Educational Attainment for Males

Education attainment for females 25 years and older:

  • No schooling: 0
  • Nursery to 4th grade: 8
  • 5th and 6th grade: 0
  • 7th and 8th grade: 37
  • 9th grade: 0
  • 10th grade: 12
  • 11th grade: 22
  • 12th grade, no diploma: 17
  • High school graduate (or equivalency): 604
  • Less than 1 year of college: 176
  • Some college more than 1 year, no degree: 253
  • Associate degree: 158
  • Bachelor's degree: 728
  • Master's degree: 247
  • Professional school degree: 24
  • Doctorate degree: 7
Educational Attainment for Females
Lionville-Marchwood marital status for males
Lionville-Marchwood marital status for females

Housing units in structures:

  • One, detached: 1,202
  • One, attached: 699
  • Two: 33
  • 3 or 4: 181
  • 5 to 9: 174
  • 10 to 19: 233
  • 20 to 49: 100
  • 50 or more: 42
  • Boats, RVs, vans, etc.: 16
Year householders moved into residence in Lionville-Marchwood
Houses and condos Apartments
Most commonly used house heating fuel in houses and condos in Lionville-Marchwood, PA
  • 38.6%Electricity
  • 31.4%Fuel oil, kerosene, etc.
  • 29.3%Utility gas
  • 0.6%Bottled, tank, or LP gas
Most commonly used house heating fuel in apartments in Lionville-Marchwood, PA
  • 53.5%Electricity
  • 39.0%Utility gas
  • 5.1%Fuel oil, kerosene, etc.
  • 2.4%Bottled, tank, or LP gas

Private vs. public school enrollment:

Students in private schools in grades 1 to 8 (elementary and middle school): 136
Here:

19.6%
Pennsylvania:

16.0%

Students in private schools in grades 9 to 12 (high school): 100
Here:

32.1%
Pennsylvania:

13.1%

Students in private undergraduate colleges: 58
Here:

31.0%
Pennsylvania:

37.3%
School Enrollment by Level of School for Male Students
School Enrollment by Level of School for Female Students
Age and Sex of Sensory-Disabled Noninstitutionalized Residents
Age and Sex of Physically-Disabled Noninstitutionalized Residents
Age and Sex of Mentally-Disabled Noninstitutionalized Residents
Age and Sex of Self-Care Disabled Noninstitutionalized Residents
Age and Sex of Go-Outside-Home Disabled Noninstitutionalized Residents
Age and Sex of Noninstitutionalized Residents with Employment Disability