Lipan, TX (Texas) Houses and Residents
| Lipan: | $180,271 |
| Texas: | $275,400 |
Total population: 442 (Urban population: 0, Rural population: 448 (9 farm, 439 nonfarm))
Houses: 189 (139 occupied: 116 owner occupied, 23 renter occupied)
| % of renters here: | 17% |
| State: | 38% |
Housing density: 178 houses/condos per square mile
Median price asked for vacant for-sale houses and condos in 2022: $772,795.
Median contract rent in 2022: $840 (lower quartile is $589, upper quartile is $980)
Median rent asked for vacant for-rent units in 2022: $849
Median gross rent in Lipan, TX in 2022: $1,057
Housing units in Lipan with a mortgage: 63 (0 second mortgage, 0 home equity loan, 0 both second mortgage and home equity loan)
Houses without a mortgage: 0
Median household income for houses/condos with a mortgage: $83,967
Median household income for apartments without a mortgage: $36,016
Median monthly housing costs: $979
Compare current foreclosures near Lipan, TX:
| Photo | Address | Area | Beds / Baths | Price | Details |
|---|---|---|---|---|---|

|
#1
S Fm 4
Lipan, TX 76462
|
- sq. feet
|
- baths - beds |
show details | |

|
#2
County Road 524
Lipan, TX 76462
|
- sq. feet
|
- baths - beds |
show details | |

|
#3
Comanche Trl
Weatherford, TX 76087
|
1,984 sq. feet
|
2 baths 3 beds |
show details | |

|
#4
Parkview Cir
Tolar, TX 76476
|
2,052 sq. feet
|
2 baths 4 beds |
show details | |

|
#5
Appletree Ct
Granbury, TX 76048
|
1,620 sq. feet
|
2 baths 3 beds |
show details | |

|
#6
Lipan Hwy
Granbury, TX 76048
|
1,692 sq. feet
|
2 baths 3 beds |
show details | |

|
#7
Onyx Ct
Weatherford, TX 76087
|
- sq. feet
|
- baths - beds |
show details | |

|
#8
River View Rd
Millsap, TX 76066
|
- sq. feet
|
- baths - beds |
show details | |

|
#9
Olive Branch Rd
Weatherford, TX 76087
|
1,423 sq. feet
|
- baths - beds |
show details | |

|
#10
Sunflower Dr
Weatherford, TX 76087
|
1,485 sq. feet
|
- baths - beds |
show details |
| Photo | Address | Area | Beds / Baths | Price | Details |
|---|---|---|---|---|---|

|
#11
Skyline Dr
Bluff Dale, TX 76433
|
- sq. feet
|
- baths - beds |
show details | |

|
#12
Cimmaron Trl
Weatherford, TX 76087
|
600 sq. feet
|
- baths - beds |
show details | |

|
#13
Catalina Bay Blvd
Granbury, TX 76048
|
- sq. feet
|
- baths - beds |
show details | |

|
#14
W Pearl St Apt B31
Granbury, TX 76048
|
- sq. feet
|
- baths - beds |
show details | |

|
#15
Cool Jct
Millsap, TX 76066
|
1,120 sq. feet
|
- baths - beds |
show details | |

|
#16
Pioneer Trl
Weatherford, TX 76087
|
- sq. feet
|
- baths - beds |
show details | |

|
#17
Spring Ridge Cir Apt 102
Granbury, TX 76048
|
- sq. feet
|
- baths - beds |
show details | |

|
#18
N Travis St
Granbury, TX 76048
|
- sq. feet
|
- baths - beds |
show details | |

|
#19
Terrill Ln
Granbury, TX 76049
|
840 sq. feet
|
- baths - beds |
show details | |

|
#20
Pecos River Dr
Granbury, TX 76048
|
- sq. feet
|
- baths - beds |
show details |
| Photo | Address | Area | Beds / Baths | Price | Details |
|---|---|---|---|---|---|

|
#21
Meandering Hills Trl
Stephenville, TX 76401
|
- sq. feet
|
- baths - beds |
show details | |

|
#22
Brushy Rd
Granbury, TX 76048
|
2,698 sq. feet
|
- baths - beds |
show details | |

|
#23
Old Dennis Rd
Weatherford, TX 76087
|
- sq. feet
|
- baths - beds |
show details | |

|
#24
River View Rd
Millsap, TX 76066
|
160 sq. feet
|
- baths - beds |
show details | |

|
#25
Blackjack Ln
Granbury, TX 76048
|
1,340 sq. feet
|
- baths - beds |
show details | |

|
#26
Giles Ln
Santo, TX 76472
|
1,470 sq. feet
|
- baths - beds |
show details | |

|
#27
Tolar Hwy
Tolar, TX 76476
|
- sq. feet
|
- baths - beds |
show details | |

|
#28
Dixie Rd
Weatherford, TX 76087
|
1,624 sq. feet
|
- baths - beds |
show details | |

|
#29
W Virginia Trl
Granbury, TX 76048
|
- sq. feet
|
- baths - beds |
show details | |

|
#30
Cherokee Trl
Weatherford, TX 76087
|
- sq. feet
|
- baths - beds |
show details |
| Photo | Address | Area | Beds / Baths | Price | Details |
|---|---|---|---|---|---|

|
#31
S Fm 113
Millsap, TX 76066
|
1,200 sq. feet
|
- baths - beds |
show details | |

|
#32
Roberson Ct
Granbury, TX 76048
|
- sq. feet
|
- baths - beds |
show details | |

|
#33
Blueberry Trl
Granbury, TX 76048
|
840 sq. feet
|
- baths - beds |
show details | |

|
#34
De Leon Dr
Weatherford, TX 76087
|
1,020 sq. feet
|
- baths - beds |
show details | |

|
#35
Plum Bush St
Granbury, TX 76048
|
1,568 sq. feet
|
- baths - beds |
show details | |

|
#36
County Road 163
Stephenville, TX 76401
|
1,758 sq. feet
|
- baths - beds |
show details | |

|
#37
County Road 163
Stephenville, TX 76401
|
1,758 sq. feet
|
- baths - beds |
show details | |

|
#38
Kaywood Dr
Granbury, TX 76048
|
- sq. feet
|
- baths - beds |
show details | |

|
#39
Crawford Ct Apt 104
Granbury, TX 76048
|
- sq. feet
|
- baths - beds |
show details | |

|
#40
Parkside Ct
Granbury, TX 76048
|
- sq. feet
|
- baths - beds |
show details |
| Photo | Address | Area | Beds / Baths | Price | Details |
|---|---|---|---|---|---|

|
#41
Weatherford Hwy
Granbury, TX 76048
|
- sq. feet
|
- baths - beds |
show details | |

|
#42
Woodmere Trl
Granbury, TX 76048
|
- sq. feet
|
- baths - beds |
show details | |

|
#43
Southwind Rd
Mineral Wells, TX 76067
|
- sq. feet
|
- baths - beds |
show details | |

|
Check over 1 million property listings on Foreclosure.com!
|
browse all offers | |||

Latest news about housing in Lipan, TX collected exclusively by city-data.com from local newspapers, TV, and radio stations

 | Looking for home in Hood County (0 replies) |
| Texas cities or regions you've never been to (103 replies) |
| Texas vs tenessee (43 replies) |
| The Devil’s Backbone of Texas (3 replies) |
| Relocation advise, young fam, wanting rural under 200k (10 replies) |
| Looks like I am moving to Corpus Christi! (51 replies) |

Median year apartment built: 1976
Household type by relationship:
Households: 443- Male householders: 85 (18 living alone), Female householders: 58 (18 living alone)
125 spouses (125 opposite-sex spouses), 2 unmarried partners, (2 opposite-sex unmarried partners), 149 children (122 natural, 14 adopted, 12 stepchildren), 1 grandchildren, 2 brothers or sisters, 6 parents, 0 foster children, 7 other relatives, 5 non-relatives
Size of family households: 31 2-persons, 30 3-persons, 23 4-persons, 11 5-persons, 6 6-persons.
Size of nonfamily households: 36 1-person, 2 2-persons.
109 married couples with children.
6 single-parent households (1 men, 5 women).
94.5% of residents of Lipan speak English at home.
5.2% of residents speak Spanish at home (67% speak English very well, 33% speak English well).
Foreign born population: 14 (3.2%)
(57.1% of them are naturalized citizens)
| Here: | 5.5 |
| State: | 6.3 |
| Here: | 5.1 |
| State: | 4.0 |

- Bedrooms in owner-occupied houses and condos in Lipan, Texas
- 0no bedroom
- 31 bedroom
- 302 bedrooms
- 713 bedrooms
- 94 bedrooms
- 35+ bedrooms

- Bedrooms in renter-occupied apartments in Lipan, Texas
- 0no bedroom
- 01 bedroom
- 182 bedrooms
- 63 bedrooms
- 04 bedrooms
- 05+ bedrooms

- Cars and other vehicles available in Lipan in owner-occupied houses/condos
- 10no vehicle
- 371 vehicle
- 382 vehicles
- 223 vehicles
- 44 vehicles
- 45+ vehicles

- Cars and other vehicles available in Lipan in renter-occupied apartments
- 0no vehicle
- 151 vehicle
- 72 vehicles
- 23 vehicles
- 04 vehicles
- 05+ vehicles

- Rooms in owner-occupied houses in Lipan, Texas
- 01 room
- 02 rooms
- 23 rooms
- 204 rooms
- 495 rooms
- 206 rooms
- 157 rooms
- 18 rooms
- 109+ rooms

- Rooms in renter-occupied apartments in Lipan, Texas
- 01 room
- 02 rooms
- 03 rooms
- 84 rooms
- 65 rooms
- 36 rooms
- 57 rooms
- 18 rooms
- 09+ rooms


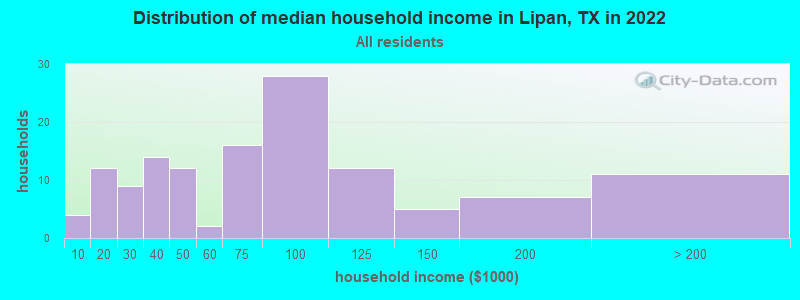
Lipan, TX household income distribution

- 4Less than $10,000
- 12$10,000 to $19,999
- 9$20,000 to $29,999
- 14$30,000 to $39,999
- 12$40,000 to $49,999
- 2$50,000 to $59,999
- 16$60,000 to $74,999
- 28$75,000 to $99,999
- 12$100,000 to $124,999
- 5$125,000 to $149,999
- 7$150,000 to $199,999
- 11$200,000 or more
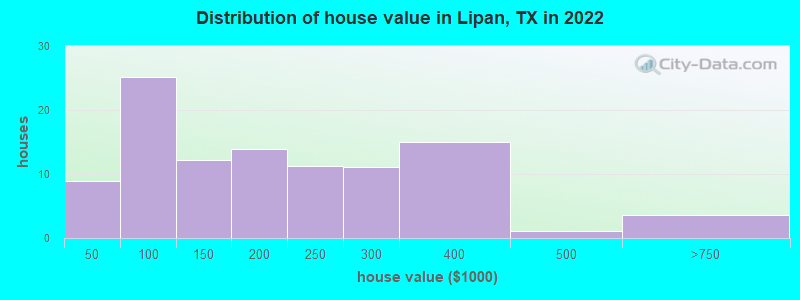
Home value of owner - occupied houses in 2022 in Lipan, TX
-
- 5Less than $10,000
- 0$15,000 to $19,999
- 0$20,000 to $24,999
- 1$40,000 to $49,999
- 0$50,000 to $59,999
- 1$60,000 to $69,999
- 2$70,000 to $79,999
- 10$80,000 to $89,999
- 7$90,000 to $99,999
- 7$100,000 to $124,999
- 4$125,000 to $149,999
- 9$150,000 to $174,999
- 4$175,000 to $199,999
- 11$200,000 to $249,999
- 11$250,000 to $299,999
- 15$300,000 to $399,999
- 1$400,000 to $499,999
- 3$500,000 to $749,999
Rent paid by renters in 2022 in Lipan, TX
-
- 1$200 to $249
- 2$550 to $599
- 2$600 to $649
- 3$700 to $749
- 2$750 to $799
- 1$800 to $899
- 1$900 to $999
- 7No cash rent


Percentage of workers working in this county: 80.2%
Number of people working at home: 18 (8.8% of all workers)
Travel time to work (commute)
- Less than 5 minutes: 29
- 5 to 9 minutes: 1
- 10 to 14 minutes: 8
- 15 to 19 minutes: 10
- 20 to 24 minutes: 37
- 25 to 29 minutes: 12
- 30 to 34 minutes: 13
- 35 to 39 minutes: 7
- 40 to 44 minutes: 0
- 45 to 59 minutes: 25
- 60 to 89 minutes: 9
- 90 or more minutes: 7
Means of transportation to work:
- Drove a car alone: 135 (75.8%)
- Carpooled: 34 (19.1%)
- Walked: 5 (2.8%)
- Worked at home: 4 (2.2%)

- Unemployment by race in 2022
- Unemployment rate for White non-Hispanic residents
- 4.1%Males
- Unemployment rate for two or more race residents
- 58.9%Females
- Unemployment rate for Hispanic or Latino residents
- 46.6%Females

- Year of entry for the foreign-born population in Lipan, Texas
- 62010 or later
- 12000 to 2009
- 21990 to 1999
- 01980 to 1989
- 121970 to 1979
- 0Before 1970

First ancestries reported:
- American: 76 (39.9%)
- English: 23 (12.1%)
- Irish: 6 (3.2%)
- German: 5 (2.6%)
- European: 1 (0.5%)
- French: 1 (0.5%)
- Scotch-Irish: 1 (0.5%)
Most common places of birth for foreign-born residents (%):
| Lipan: | 40.0% (4) |
| Texas: | 48.4% (2,411,723) |
| Lipan: | 30.0% (3) |
| Texas: | 1.1% (55,371) |
| Lipan: | 20.0% (2) |
| Texas: | 2.3% (115,558) |
Place of birth for U.S.-born residents:
- This state: 361
- Other state: 52
- Northeast: 5
- Midwest: 8
- South: 14
- West: 24
93.7% of Lipan residents lived in the same house 1 years ago.
Out of people who lived in different houses, 18.8% lived in this county.
Out of people who lived in different counties, 47.6% lived in Texas.
| Lipan: | 93.7% |
| State average: | 85.7% |
Education attainment for males 25 years and older:
- No schooling: 0
- Nursery to 4th grade: 0
- 5th and 6th grade: 1
- 7th and 8th grade: 0
- 9th grade: 7
- 10th grade: 0
- 11th grade: 0
- 12th grade, no diploma: 0
- High school graduate (or equivalency): 65
- Less than 1 year of college: 19
- Some college more than 1 year, no degree: 20
- Associate degree: 5
- Bachelor's degree: 21
- Master's degree: 8
- Professional school degree: 0
- Doctorate degree: 0

Education attainment for females 25 years and older:
- No schooling: 0
- Nursery to 4th grade: 0
- 5th and 6th grade: 4
- 7th and 8th grade: 0
- 9th grade: 9
- 10th grade: 1
- 11th grade: 1
- 12th grade, no diploma: 2
- High school graduate (or equivalency): 43
- Less than 1 year of college: 15
- Some college more than 1 year, no degree: 26
- Associate degree: 7
- Bachelor's degree: 14
- Master's degree: 4
- Professional school degree: 0
- Doctorate degree: 0


Housing units in structures:
- One, detached: 161
- One, attached: 1
- 3 or 4: 2
- 20 to 49: 2
- Mobile homes: 20
- Boats, RVs, vans, etc.: 2
Median worth of mobile homes: $90,005
Housing units lacking complete kitchen facilities in 2022: 19.6%
House/condo owner moved in on average 14 years ago
Renter moved in on average 5 years ago

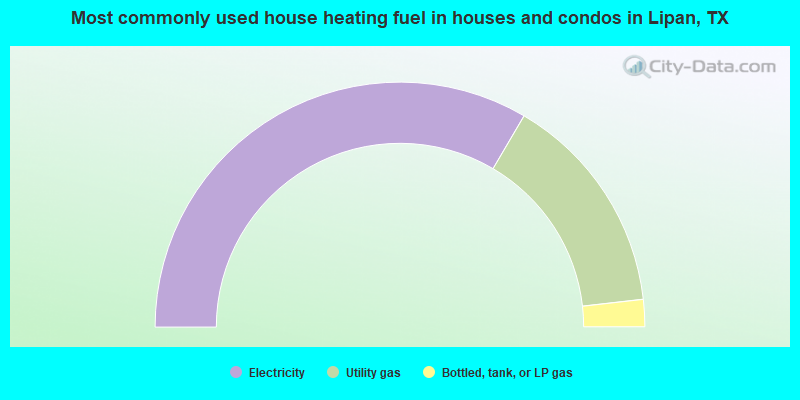
- 67.0%Electricity
- 29.5%Utility gas
- 3.6%Bottled, tank, or LP gas
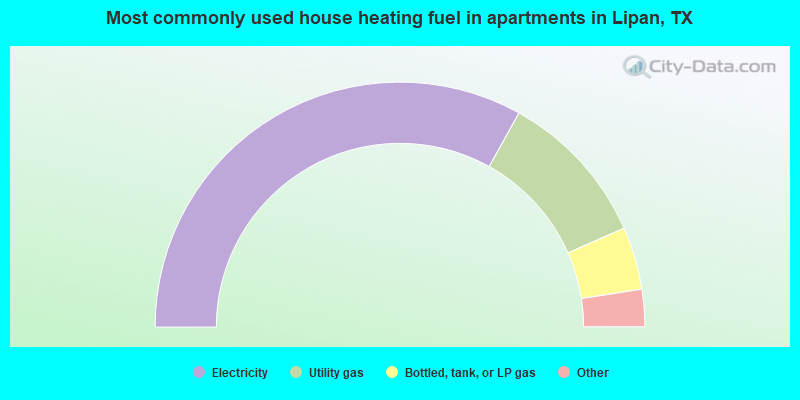
- 69.6%Electricity
- 21.7%Utility gas
- 8.7%Bottled, tank, or LP gas
Private vs. public school enrollment:
| Here: | 8.2% |
| Texas: | 8.8% |
| Here: | 45.5% |
| Texas: | 8.0% |
| Here: | 0.0% |
| Texas: | 16.2% |


