Lithia Springs, GA (Georgia) Houses and Residents
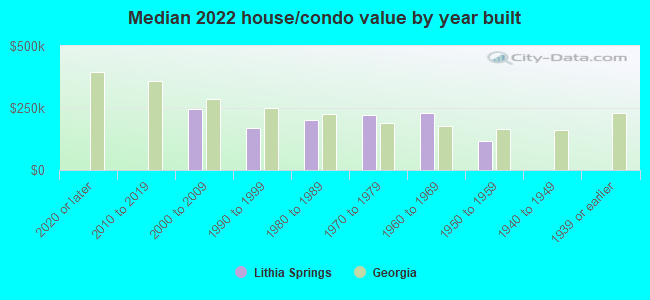
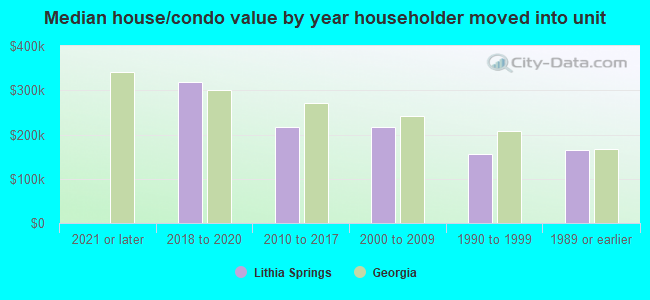
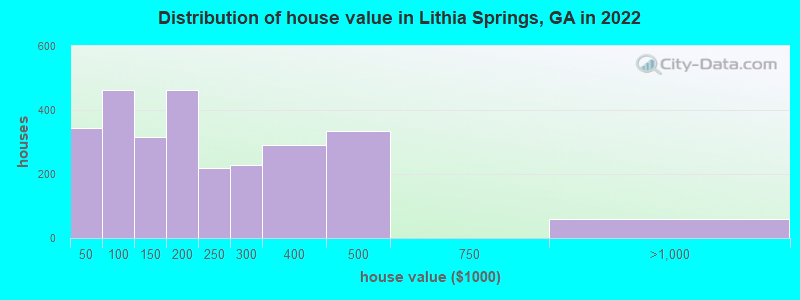
Estimated median house or condo value in 2022: $222,749 (it was $78,700 in 2000 )
Lithia Springs:
$222,749Georgia:
$297,400
Lower value quartile - upper value quartile: $150,719 - $261,430Total population: 15,491 (Urban population: 2,165, Rural population: 0)
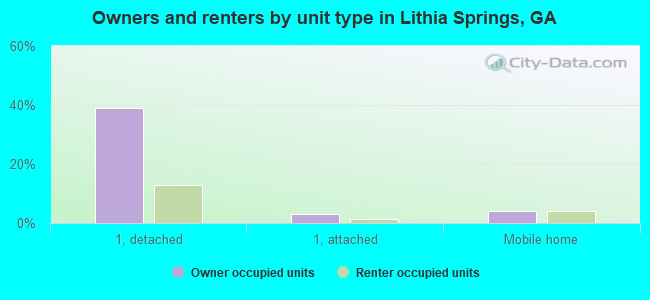
Houses: 7,620 (6,990 occupied: 2,982 owner occupied, 4,024 renter occupied )
% of renters here:
57%State:
34%
Housing density: 3,448 houses/condos per square mile
Median price asked for vacant for-sale houses and condos in 2022 in this county: $167,905.
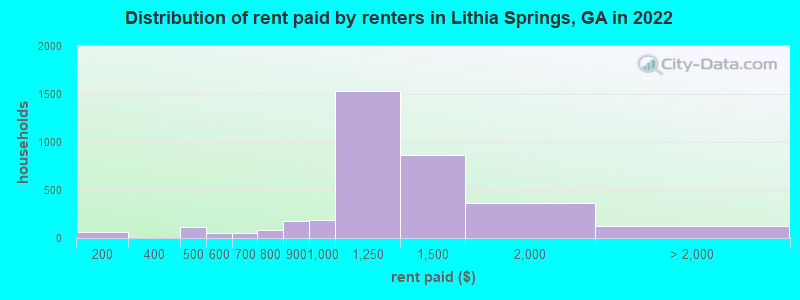
Median contract rent in 2022: $1,297 (lower quartile is $1,107, upper quartile is $1,514)
Median rent asked for vacant for-rent units in 2022: $1,665
Median gross rent in Lithia Springs, GA in 2022: $1,332
Housing units in Lithia Springs with a mortgage: 1,867 (104 second mortgage, 0 home equity loan, 20 both second mortgage and home equity loan )Houses without a mortgage: 0
Median household income for houses/condos with a mortgage: $59,389
Median household income for apartments without a mortgage: $52,577
Median monthly housing costs: $1,195
Data:
Median house or condo value ($)
Median house or condo value ($ change since 2000)
Median house or condo value ($) - White
Median house or condo value ($) - Black or African American
Median house or condo value ($) - Asian
Median house or condo value ($) - Hispanic or Latino
Median house or condo value ($) - American Indian and Alaska Native
Median house or condo value ($) - Multirace
Median house or condo value ($) - Other Race
Median price asked for mobile homes ($)
Household density (households per square mile)
Mean house or condo value by units in structure - 1, detached ($)
Mean house or condo value by units in structure - 1, attached ($)
Mean house or condo value by units in structure - 2 ($)
Mean house or condo value by units in structure by units in structure - 3 or 4 ($)
Mean house or condo value by units in structure - 5 or more ($)
Mean house or condo value by units in structure - Boat, RV, van, etc. ($)
Mean house or condo value by units in structure - Mobile home ($)
Median contract rent ($)
Median contract rent - Lower quartile ($)
Median contract rent - Upper quartile ($)
Median gross rent ($)
Urban houses (%)
Rural houses (%)
Houses occupied (%)
Houses occupied (% change since 2000)
Houses owner occupied (%)
Houses owner occupied (% change since 2000)
Houses renter occupied (%)
Houses renter occupied (% change since 2000)
Vacant housing units - For rent (%)
Vacant housing units - For rent (% change since 2000)
Vacant housing units - For sale only (%)
Vacant housing units - For sale only (% change since 2000)
Vacant housing units - Rented or sold, not occupied (%)
Vacant housing units - Rented or sold, not occupied (% change since 2000)
Vacant housing units - For seasonal, recreational, or occasional use (%)
Vacant housing units - For seasonal, recreational, or occasional use (% change since 2000)
Vacant housing units - For migrant workers (%)
Vacant housing units - For migrant workers (% change since 2000)
Vacant housing units - Other vacant (%)
Vacant housing units - Other vacant (% change since 2000)
Median monthly housing costs ($)
Median household income for houses/condos with a mortgage ($)
Median household income for houses/condos without a mortgage ($)
Median household income ($)
Median household income ($) - White
Median household income ($) - Black or African American
Median household income ($) - Asian
Median household income ($) - Hispanic or Latino
Median household income ($) - American Indian and Alaska Native
Median household income ($) - Multirace
Median household income ($) - Other Race
Mortgage status - with mortgage (%)
Mortgage status - with second mortgage (%)
Mortgage status - with home equity loan (%)
Mortgage status - with both second mortgage and home equity loan (%)
Mortgage status - without a mortgage (%)
Median year house/condo built
Median year apartment built
Household type by relationship - Male householder living alone (%)
Household type by relationship - Male householder not living alone (%)
Household type by relationship - Female householder living alone (%)
Household type by relationship - Female householder not living alone (%)
Household type by relationship - Opposite-Sex spouse (%)
Household type by relationship - Same-Sex spouse (%)
Household type by relationship - Opposite-Sex unmarried partner (%)
Household type by relationship - Same-Sex unmarried partner (%)
Household type by relationship - In group quarters (%)
Size of family households - 2-person household (%)
Size of family households - 3-person household (%)
Size of family households - 4-person household (%)
Size of family households - 5-person household (%)
Size of family households - 6-person household (%)
Size of family households - 7-or-more-person household (%)
Size of nonfamily households - 1-person household (%)
Size of nonfamily households - 2-person household (%)
Size of nonfamily households - 3-person household (%)
Size of nonfamily households - 4-person household (%)
Size of nonfamily households - 5-person household (%)
Size of nonfamily households - 6-person household (%)
Size of nonfamily households - 7-or-moreperson household (%)
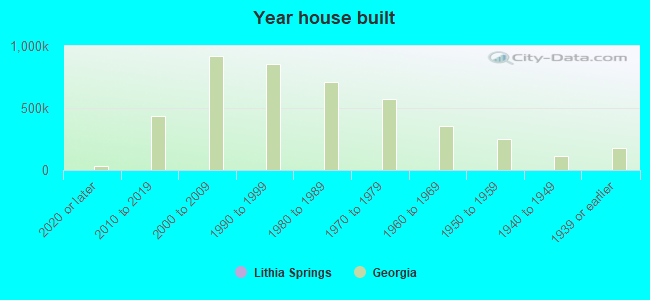
Year house built - Built 2010 or later (%)
Year house built - Built 2000 to 2009 (%)
Year house built - Built 1990 to 1999 (%)
Year house built - Built 1980 to 1989 (%)
Year house built - Built 1970 to 1979 (%)
Year house built - Built 1960 to 1969 (%)
Year house built - Built 1950 to 1959 (%)
Year house built - Built 1940 to 1949 (%)
Year house built - Built 1939 or earlier (%)
Median number of rooms in houses and condos
Median number of rooms in apartments
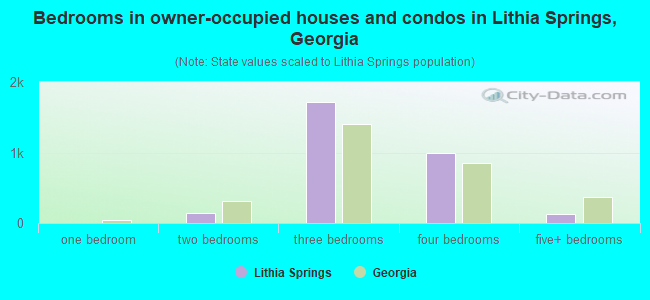
Median number of bedrooms in owner occupied houses
Mean number of bedrooms in owner occupied houses
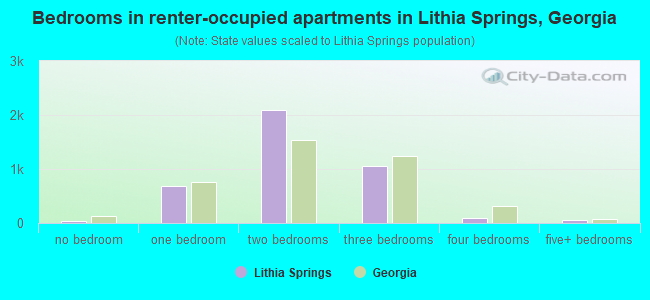
Median number of bedrooms in renter occupied houses
Mean number of bedrooms in renter occupied houses
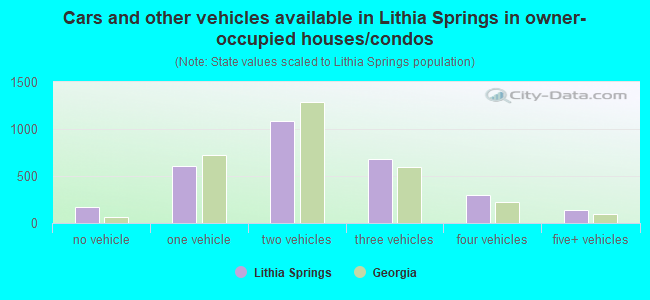
Median number of vehichles in owner occupied houses
Mean number of vehichles in owner occupied houses
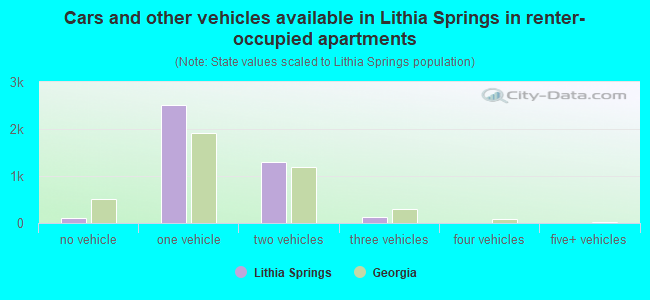
Median number of vehichles in renter occupied houses
Mean number of vehichles in renter occupied houses
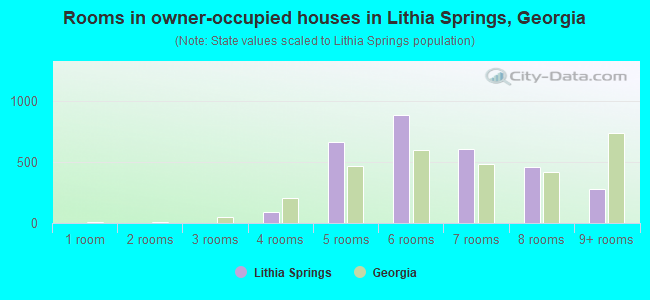
Rooms in owner-occupied houses - 1 room (%)
Rooms in owner-occupied houses - 2 rooms (%)
Rooms in owner-occupied houses - 3 rooms (%)
Rooms in owner-occupied houses - 4 rooms (%)
Rooms in owner-occupied houses - 5 rooms (%)
Rooms in owner-occupied houses - 6 rooms (%)
Rooms in owner-occupied houses - 7 rooms (%)
Rooms in owner-occupied houses - 8 rooms (%)
Rooms in owner-occupied houses - 9+ rooms (%)
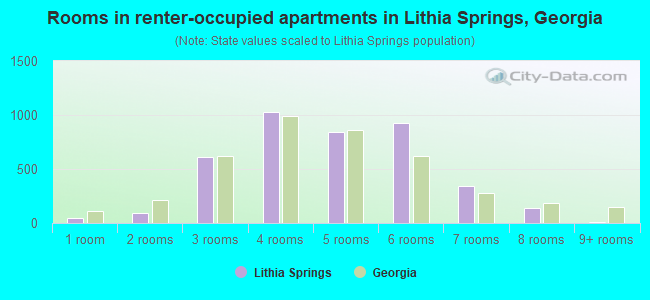
Rooms in renter-occupied houses - 1 room (%)
Rooms in renter-occupied houses - 2 rooms (%)
Rooms in renter-occupied houses - 3 rooms (%)
Rooms in renter-occupied houses - 4 rooms (%)
Rooms in renter-occupied houses - 5 rooms (%)
Rooms in renter-occupied houses - 6 rooms (%)
Rooms in renter-occupied houses - 7 rooms (%)
Rooms in renter-occupied houses - 8 rooms (%)
Rooms in renter-occupied houses - 9+ rooms (%)
Bedrooms in owner-occupied houses - no bedrooms (%)
Bedrooms in owner-occupied houses - 1 bedroom (%)
Bedrooms in owner-occupied houses - 2 bedrooms (%)
Bedrooms in owner-occupied houses - 3 bedrooms (%)
Bedrooms in owner-occupied houses - 4 bedrooms (%)
Bedrooms in owner-occupied houses - 5+ bedrooms (%)
Bedrooms in renter-occupied houses - no bedrooms (%)
Bedrooms in renter-occupied houses - 1 bedroom (%)
Bedrooms in renter-occupied houses - 2 bedrooms (%)
Bedrooms in renter-occupied houses - 3 bedrooms (%)
Bedrooms in renter-occupied houses - 4 bedrooms (%)
Bedrooms in renter-occupied houses - 5+ bedrooms (%)
Vehicles available in owner-occupied houses - no vehicle available (%)
Vehicles available in owner-occupied houses - 1 vehicle available(%)
Vehicles available in owner-occupied houses - 2 Vehicles available (%)
Vehicles available in owner-occupied houses - 3 Vehicles available (%)
Vehicles available in owner-occupied houses - 4 Vehicles available (%)
Vehicles available in owner-occupied houses - 5+ Vehicles available (%)
Vehicles available in renter-occupied houses - no vehicle available (%)
Vehicles available in renter-occupied houses - 1 vehicle available (%)
Vehicles available in renter-occupied houses - 2 Vehicles available (%)
Vehicles available in renter-occupied houses - 3 Vehicles available (%)
Vehicles available in renter-occupied houses - 4 Vehicles available (%)
Vehicles available in renter-occupied houses - 5+ Vehicles available (%)
Housing units in structures - 1, detached (%)
Housing units in structures - 1, attached (%)
Housing units in structures - 2 (%)
Housing units in structures - 3 or 4 (%)
Housing units in structures - 5 to 9 (%)
Housing units in structures - 10 to 19 (%)
Housing units in structures - 20 to 49 (%)
Housing units in structures - 50 or more (%)
Housing units in structures - Mobile home (%)
Housing units in structures - Boat, RV, van, etc. (%)
Housing units in structures - Owners - 1, detached (%)
Housing units in structures - Owners - 1, attached (%)
Housing units in structures - Owners - 2 (%)
Housing units in structures - Owners - 3 or 4 (%)
Housing units in structures - Owners - 5 to 9 (%)
Housing units in structures - Owners - 10 to 19 (%)
Housing units in structures - Owners - 20 to 49 (%)
Housing units in structures - Owners - 50 or more (%)
Housing units in structures - Owners - Mobile home (%)
Housing units in structures - Owners - Boat, RV, van, etc. (%)
Housing units in structures - Renters - 1, detached (%)
Housing units in structures - Renters - 1, attached (%)
Housing units in structures - Renters - 2 (%)
Housing units in structures - Renters - 3 or 4 (%)
Housing units in structures - Renters - 5 to 9 (%)
Housing units in structures - Renters - 10 to 19 (%)
Housing units in structures - Renters - 20 to 49 (%)
Housing units in structures - Renters - 50 or more (%)
Housing units in structures - Renters - Mobile home (%)
Housing units in structures - Renters - Boat, RV, van, etc. (%)
House/condo owner moved in on average (years ago)
Renter moved in on average (years ago)
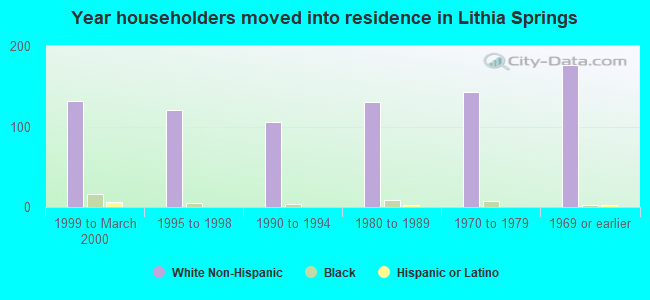
Year householder moved into unit - Moved in 1999 to March 2000 (%)
Year householder moved into unit - Moved in 1999 to March 2000 (%) - White
Year householder moved into unit - Moved in 1999 to March 2000 (%) - Black or African American
Year householder moved into unit - Moved in 1999 to March 2000 (%) - Asian
Year householder moved into unit - Moved in 1999 to March 2000 (%) - Hispanic or Latino
Year householder moved into unit - Moved in 1999 to March 2000 (%) - American Indian and Alaska Native
Year householder moved into unit - Moved in 1999 to March 2000 (%) - Multirace
Year householder moved into unit - Moved in 1999 to March 2000 (%) - Other Race
Year householder moved into unit - Moved in 1995 to 1998 (%)
Year householder moved into unit - Moved in 1995 to 1998 (%) - White
Year householder moved into unit - Moved in 1995 to 1998 (%) - Black or African American
Year householder moved into unit - Moved in 1995 to 1998 (%) - Asian
Year householder moved into unit - Moved in 1995 to 1998 (%) - Hispanic or Latino
Year householder moved into unit - Moved in 1995 to 1998 (%) - American Indian and Alaska Native
Year householder moved into unit - Moved in 1995 to 1998 (%) - Multirace
Year householder moved into unit - Moved in 1995 to 1998 (%) - Other Race
Year householder moved into unit - Moved in 1990 to 1994 (%)
Year householder moved into unit - Moved in 1990 to 1994 (%) - White
Year householder moved into unit - Moved in 1990 to 1994 (%) - Black or African American
Year householder moved into unit - Moved in 1990 to 1994 (%) - Asian
Year householder moved into unit - Moved in 1990 to 1994 (%) - Hispanic or Latino
Year householder moved into unit - Moved in 1990 to 1994 (%) - American Indian and Alaska Native
Year householder moved into unit - Moved in 1990 to 1994 (%) - Multirace
Year householder moved into unit - Moved in 1990 to 1994 (%) - Other Race
Year householder moved into unit - Moved in 1980 to 1989 (%)
Year householder moved into unit - Moved in 1980 to 1989 (%) - White
Year householder moved into unit - Moved in 1980 to 1989 (%) - Black or African American
Year householder moved into unit - Moved in 1980 to 1989 (%) - Asian
Year householder moved into unit - Moved in 1980 to 1989 (%) - Hispanic or Latino
Year householder moved into unit - Moved in 1980 to 1989 (%) - American Indian and Alaska Native
Year householder moved into unit - Moved in 1980 to 1989 (%) - Multirace
Year householder moved into unit - Moved in 1980 to 1989 (%) - Other Race
Year householder moved into unit - Moved in 1970 to 1979 (%)
Year householder moved into unit - Moved in 1970 to 1979 (%) - White
Year householder moved into unit - Moved in 1970 to 1979 (%) - Black or African American
Year householder moved into unit - Moved in 1970 to 1979 (%) - Asian
Year householder moved into unit - Moved in 1970 to 1979 (%) - Hispanic or Latino
Year householder moved into unit - Moved in 1970 to 1979 (%) - American Indian and Alaska Native
Year householder moved into unit - Moved in 1970 to 1979 (%) - Multirace
Year householder moved into unit - Moved in 1970 to 1979 (%) - Other Race
Year householder moved into unit - Moved in 1969 or earlier (%)
Year householder moved into unit - Moved in 1969 or earlier (%) - White
Year householder moved into unit - Moved in 1969 or earlier (%) - Black or African American
Year householder moved into unit - Moved in 1969 or earlier (%) - Asian
Year householder moved into unit - Moved in 1969 or earlier (%) - Hispanic or Latino
Year householder moved into unit - Moved in 1969 or earlier (%) - American Indian and Alaska Native
Year householder moved into unit - Moved in 1969 or earlier (%) - Multirace
Year householder moved into unit - Moved in 1969 or earlier (%) - Other Race
Housing units lacking complete plumbing facilities (%)
Housing units lacking complete kitchen facilities (%)
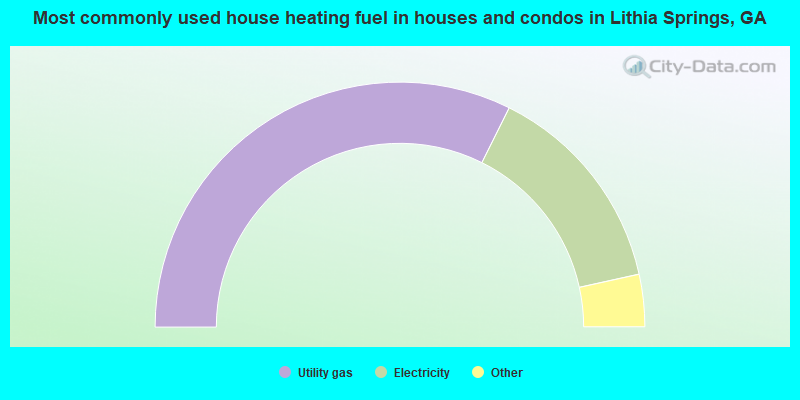
House heating fuel used in houses and condos - Utility gas (%)
House heating fuel used in houses and condos - Bottled, tank, or LP gas (%)
House heating fuel used in houses and condos - Electricity (%)
House heating fuel used in houses and condos - Fuel oil, kerosene, etc. (%)
House heating fuel used in houses and condos - Coal or coke (%)
House heating fuel used in houses and condos - Wood (%)
House heating fuel used in houses and condos - Solar energy (%)
House heating fuel used in houses and condos - Other fuel (%)
House heating fuel used in houses and condos - No fuel used (%)
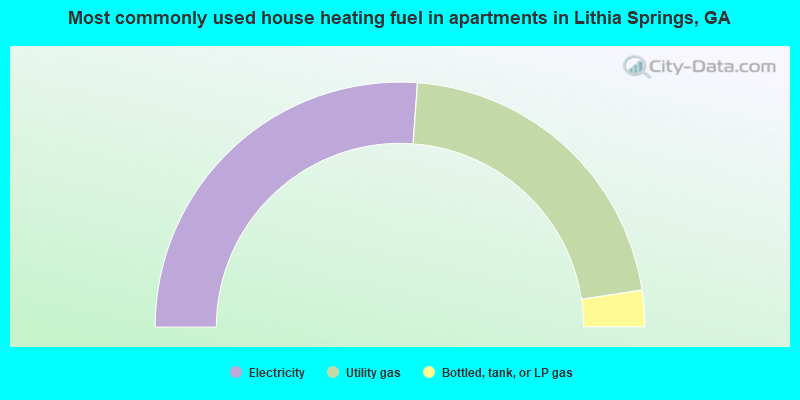
House heating fuel used in apartments - Utility gas (%)
House heating fuel used in apartments - Bottled, tank, or LP gas (%)
House heating fuel used in apartments - Electricity (%)
House heating fuel used in apartments - Fuel oil, kerosene, etc. (%)
House heating fuel used in apartments - Coal or coke (%)
House heating fuel used in apartments - Wood (%)
House heating fuel used in apartments - Solar energy (%)
House heating fuel used in apartments - Other fuel (%)
House heating fuel used in apartments - No fuel used (%)
Median year house/condo built: 1983Median year apartment built: 1992Household type by relationship:
Households: 16,305
Male householders: 3,456 (1,203 living alone ), Female householders: 3,390 (1,242 living alone )2,229 spouses (2,169 opposite-sex spouses ), 679 unmarried partners , (598 opposite-sex unmarried partners ), 4,594 children (4,371 natural , 82 adopted , 140 stepchildren ), 349 grandchildren , 198 brothers or sisters , 322 parents , 0 foster children , 403 other relatives , 666 non-relatives In group quarters: 15
Size of family households: 1,806 2-persons , 1,373 3-persons , 578 4-persons , 168 5-persons , 45 6-persons , 148 7-or-more-persons .
Size of nonfamily households: 2,334 1-person , 425 2-persons , 43 3-persons , 27 4-persons .
1,036 married couples with children. single-parent households (1,176 men , 1,477 women ).
69.8% of residents of Lithia Springs speak English at home. of residents speak Spanish at home (59% speak English very well , 20% speak English well , 17% speak English not well , 4% don't speak English at all ).of residents speak other Indo-European language at home (71% speak English very well , 14% speak English well , 7% speak English not well , 9% don't speak English at all ).of residents speak Asian or Pacific Island language at home (34% speak English very well , 66% speak English well ).of residents speak other language at home (100% speak English very well ).
Foreign born population: 3,599 (22.1%)of them are naturalized citizens )
Median number of rooms in houses and condos:
Median number of rooms in apartments
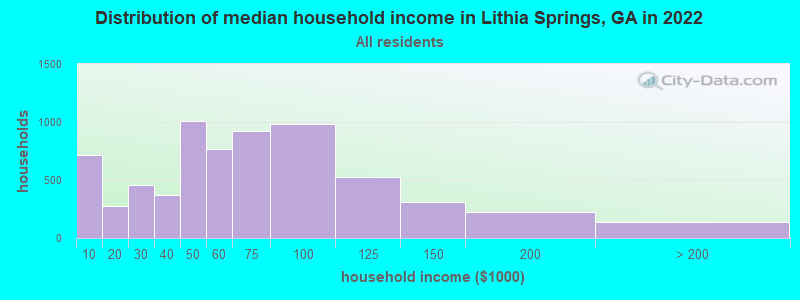
Lithia Springs, GA household income distribution 712 Less than $10,000274 $10,000 to $19,999461 $20,000 to $29,999370 $30,000 to $39,9991,007 $40,000 to $49,999766 $50,000 to $59,999926 $60,000 to $74,999984 $75,000 to $99,999522 $100,000 to $124,999310 $125,000 to $149,999220 $150,000 to $199,999136 $200,000 or more
Home value of owner - occupied houses in 2022 in Lithia Springs, GA 140 Less than $10,00023 $10,000 to $14,99969 $15,000 to $19,99919 $20,000 to $24,99981 $30,000 to $34,9998 $35,000 to $39,999350 $50,000 to $59,99943 $60,000 to $69,9998 $70,000 to $79,99959 $80,000 to $89,99984 $100,000 to $124,999230 $125,000 to $149,999213 $150,000 to $174,999249 $175,000 to $199,999220 $200,000 to $249,999227 $250,000 to $299,999289 $300,000 to $399,999334 $400,000 to $499,99960 $750,000 to $999,999Rent paid by renters in 2022 in Lithia Springs, GA 61 $100 to $14995 $400 to $44918 $450 to $49952 $550 to $59952 $600 to $64986 $700 to $749171 $800 to $899192 $900 to $9991,528 $1,000 to $1,249867 $1,250 to $1,499361 $1,500 to $1,999123 No cash rent
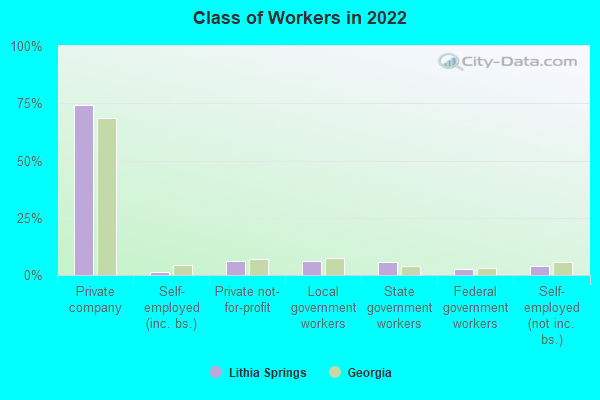
Percentage of workers working in this county: 39.8%Number of people working at home: 1,123 (13.5% of all workers )
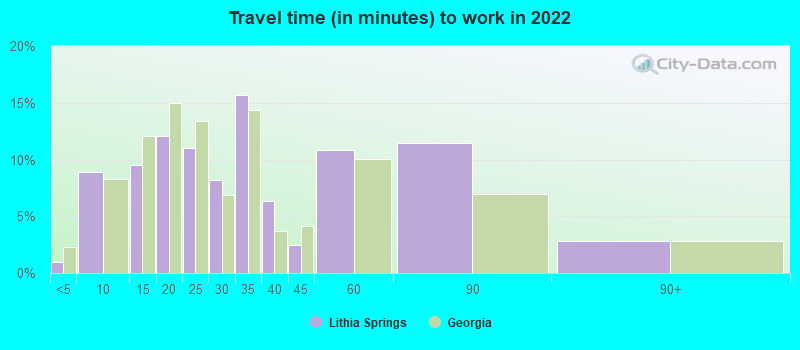
Travel time to work (commute)
Less than 5 minutes: 1955 to 9 minutes: 25610 to 14 minutes: 1,02115 to 19 minutes: 1,23520 to 24 minutes: 81125 to 29 minutes: 30230 to 34 minutes: 1,05035 to 39 minutes: 34740 to 44 minutes: 40045 to 59 minutes: 1,19460 to 89 minutes: 43590 or more minutes: 129
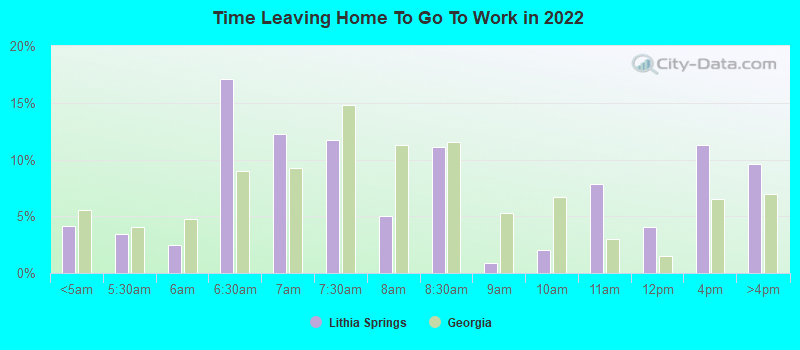
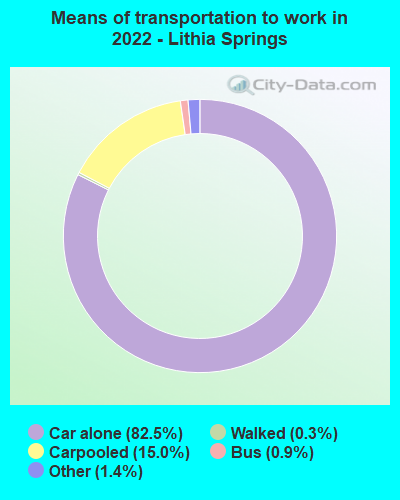
Means of transportation to work:
Drove a car alone: 6,801 (71.5%)Carpooled: 1,290 (13.6%)Bus : 55 (0.6%)Taxi: 118 (1.2%)Walked: 30 (0.3%)Worked at home: 1,123 (11.8%)
Unemployment by race in 2022
Unemployment rate for White non-Hispanic residents 0.5% Males9.1% FemalesUnemployment rate for Black residents 1.8% Males4.2% FemalesUnemployment rate for Hispanic or Latino residents 2.5% Females
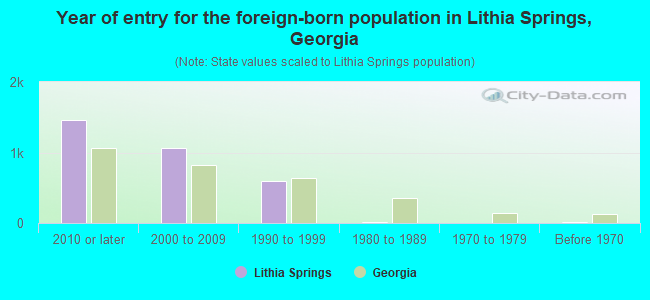
Year of entry for the foreign-born population in Lithia Springs, Georgia
1,466 2010 or later 1,063 2000 to 2009 590 1990 to 1999 10 1980 to 1989 4 1970 to 1979 17 Before 1970
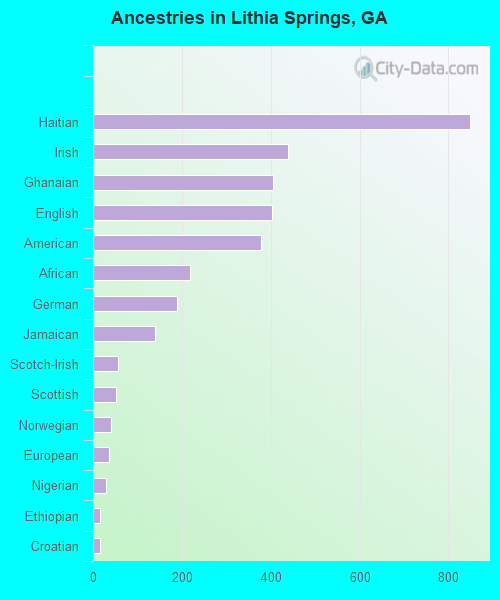
First ancestries reported:
Haitian: 849 (7.5%)
Irish: 438 (3.9%)
Ghanaian: 405 (3.6%)
English: 404 (3.6%)
American: 379 (3.4%)
African: 218 (1.9%)
German: 189 (1.7%)
Jamaican: 139 (1.2%)
Scotch-Irish: 56 (0.5%)
Scottish: 52 (0.5%)
Norwegian: 41 (0.4%)
European: 35 (0.3%)
Nigerian: 30 (0.3%)
Ethiopian: 16 (0.1%)
Croatian: 15 (0.1%) Most common places of birth for foreign-born residents (%): Mexico Lithia Springs:
30.4% (1,077)Georgia:
20.0% (223,400)
Haiti Lithia Springs:
18.1% (640)Georgia:
1.6% (17,476)
Ghana Lithia Springs:
13.6% (481)Georgia:
1.0% (11,747)
Venezuela Lithia Springs:
11.9% (422)Georgia:
1.7% (19,012)
El Salvador Lithia Springs:
8.3% (294)Georgia:
2.5% (27,794)
Jamaica Lithia Springs:
3.8% (133)Georgia:
4.6% (51,270)
India Lithia Springs:
3.6% (129)Georgia:
9.2% (103,325)
Nigeria Lithia Springs:
3.0% (106)Georgia:
2.5% (27,846)
Dominican Republic Lithia Springs:
2.6% (93)Georgia:
1.1% (11,847)
Honduras Lithia Springs:
1.7% (62)Georgia:
2.1% (23,500)
Nicaragua Lithia Springs:
1.6% (56)Georgia:
0.3% (3,839)
Place of birth for U.S.-born residents:
This state: 6,335Other state: 6,403Northeast: 998Midwest: 1,585South: 3,524West: 277 89.1% of Lithia Springs residents lived in the same house 1 years ago.
Out of people who lived in different houses, 26.7% lived in this county.
Out of people who lived in different counties, 73.6% lived in Georgia.
Lithia Springs:
89.1%State average:
86.6%
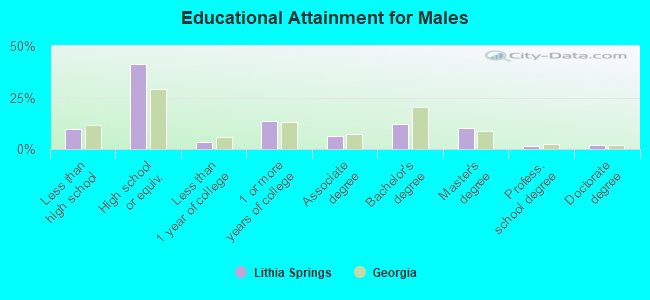
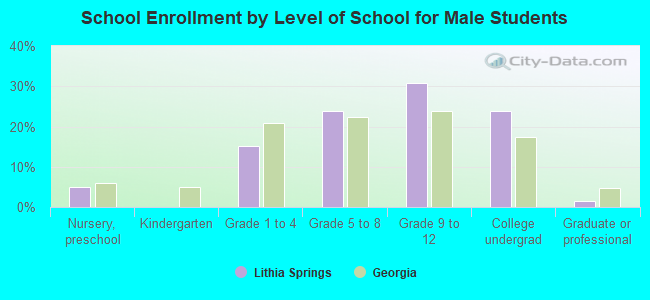
Education attainment for males 25 years and older:
No schooling: 40Nursery to 4th grade: 05th and 6th grade: 347th and 8th grade: 1209th grade: 8510th grade: 1011th grade: 1212th grade, no diploma: 160High school graduate (or equivalency): 1,975Less than 1 year of college: 173Some college more than 1 year, no degree: 660Associate degree: 309Bachelor's degree: 587Master's degree: 480Professional school degree: 67Doctorate degree: 85
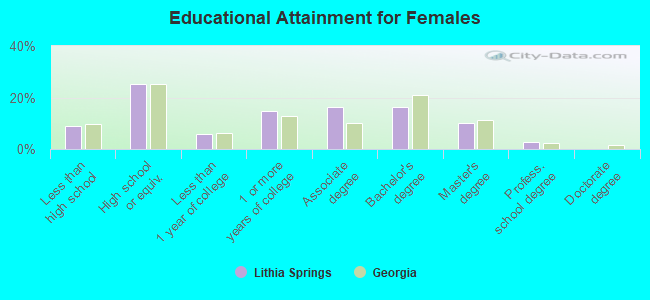
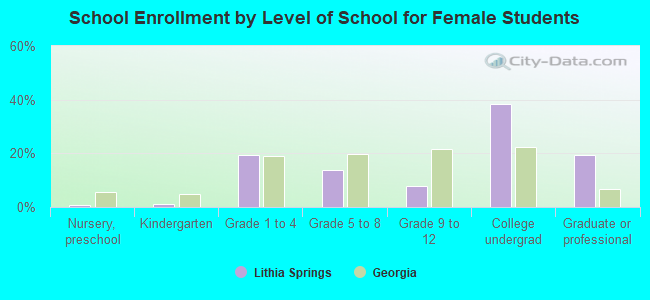
Education attainment for females 25 years and older:
No schooling: 19Nursery to 4th grade: 05th and 6th grade: 1147th and 8th grade: 1269th grade: 5210th grade: 7911th grade: 2712th grade, no diploma: 85High school graduate (or equivalency): 1,408Less than 1 year of college: 328Some college more than 1 year, no degree: 833Associate degree: 904Bachelor's degree: 908Master's degree: 576Professional school degree: 149Doctorate degree: 0
Housing units in structures:
One, detached: 3,965One, attached: 280Two: 833 or 4: 1635 to 9: 97010 to 19: 1,30020 to 49: 20050 or more: 128Mobile homes: 527Median worth of mobile homes: $50,813
Housing units lacking complete plumbing facilities in 2022: 0.7%Housing units lacking complete kitchen facilities in 2022: 0.6%House/condo owner moved in on average 11 years ago
Renter moved in on average 2 years ago
Private vs. public school enrollment:
Students in private schools in grades 1 to 8 (elementary and middle school): 189 Students in private schools in grades 9 to 12 (high school): 194 Students in private undergraduate colleges: 392