Little Mountain, SC (South Carolina) Houses and Residents
| Little Mountain: | $300,291 |
| South Carolina: | $254,600 |
Mean price in 2022:
Detached houses: $297,419
Here: $297,419 State: $368,255 Mobile homes: $51,596
Here: $51,596 State: $102,531
Total population: 294 (Urban population: 0, Rural population: 233 (all nonfarm))
Houses: 236 (170 occupied: 157 owner occupied, 16 renter occupied)
| % of renters here: | 9% |
| State: | 28% |
Housing density: 223 houses/condos per square mile
Median price asked for vacant for-sale houses and condos in 2022: $711,979.
Median rent asked for vacant for-rent units in 2022: $642
Median gross rent in Little Mountain, SC in 2022: $745
Housing units in Little Mountain with a mortgage: 82 (0 second mortgage, 0 home equity loan, 0 both second mortgage and home equity loan)
Houses without a mortgage: 1
Median household income for houses/condos with a mortgage: $102,968
Median household income for apartments without a mortgage: $50,944
Median monthly housing costs: $717
Compare current foreclosures near Little Mountain, SC:
| Photo | Address | Area | Beds / Baths | Price | Details |
|---|---|---|---|---|---|

|
#1
Wash Lever Rd
Little Mountain, SC 29075
|
2,176 sq. feet
|
3 baths 4 beds |
show details | |

|
#2
Meadowlark Rd
Little Mountain, SC 29075
|
- sq. feet
|
- baths - beds |
show details | |

|
#3
Brookview Rd
Columbia, SC 29212
|
1,721 sq. feet
|
2 baths 3 beds |
$270,000
|
show details |

|
#4
Doctor Bowers Rd
Little Mountain, SC 29075
|
- sq. feet
|
- baths - beds |
show details | |

|
#5
Wheeland School Rd
Little Mountain, SC 29075
|
- sq. feet
|
- baths - beds |
show details | |

|
#6
Rolling Creek Cir
Irmo, SC 29063
|
3,993 sq. feet
|
3 baths 4 beds |
show details | |

|
#7
Myrtle St
Newberry, SC 29108
|
3,495 sq. feet
|
2 baths 3 beds |
show details | |

|
#8
Hilton Village Dr
Chapin, SC 29036
|
3,239 sq. feet
|
3 baths 4 beds |
show details | |

|
#9
Shawn Ct
Irmo, SC 29063
|
1,801 sq. feet
|
3 baths 4 beds |
show details | |

|
#10
Carolina Highway 34
Newberry, SC 29108
|
- sq. feet
|
- baths - beds |
$580,000
|
show details |
| Photo | Address | Area | Beds / Baths | Price | Details |
|---|---|---|---|---|---|

|
#11
Jones Rd
Irmo, SC 29063
|
3,717 sq. feet
|
4 baths 4 beds |
show details | |

|
#12
Superior Cir
Chapin, SC 29036
|
2,342 sq. feet
|
2 baths 3 beds |
show details | |

|
#13
Common Reed Dr
Gilbert, SC 29054
|
1,793 sq. feet
|
2 baths 3 beds |
show details | |

|
#14
Arrow Shores Cir
Chapin, SC 29036
|
1,563 sq. feet
|
1 baths 3 beds |
show details | |

|
#15
Kennerly Rd
Irmo, SC 29063
|
2,967 sq. feet
|
2 baths 3 beds |
show details | |

|
#16
Danby Ct
Columbia, SC 29212
|
2,044 sq. feet
|
2 baths 3 beds |
show details | |

|
#17
E Dean Rd
Irmo, SC 29063
|
1,200 sq. feet
|
2 baths 3 beds |
show details | |

|
#18
Thornhill Rd
Columbia, SC 29212
|
1,797 sq. feet
|
2 baths 3 beds |
show details | |

|
#19
Hope Creek Dr
Irmo, SC 29063
|
2,296 sq. feet
|
2 baths 4 beds |
show details | |

|
#20
Coldwater Ct
Irmo, SC 29063
|
3,347 sq. feet
|
3 baths 4 beds |
show details |
| Photo | Address | Area | Beds / Baths | Price | Details |
|---|---|---|---|---|---|

|
#21
Waltham Abby Rd
Columbia, SC 29212
|
1,784 sq. feet
|
2 baths 3 beds |
show details | |

|
#22
Beech Branch Dr
Irmo, SC 29063
|
1,292 sq. feet
|
2 baths 3 beds |
show details | |

|
#23
Blue Lake Dr
Lexington, SC 29072
|
2,344 sq. feet
|
2 baths 4 beds |
show details | |

|
#24
Gallatin Cir
Irmo, SC 29063
|
1,942 sq. feet
|
2 baths 3 beds |
show details | |

|
#25
Tuscany Ct
Irmo, SC 29063
|
1,248 sq. feet
|
2 baths 2 beds |
show details | |

|
#26
Diana Rd
Gilbert, SC 29054
|
1,625 sq. feet
|
1 baths 3 beds |
show details | |

|
#27
Wild Spring Ct
Lexington, SC 29072
|
1,821 sq. feet
|
3 baths 3 beds |
show details | |

|
#28
Stonemont Dr
Irmo, SC 29063
|
3,072 sq. feet
|
3 baths 5 beds |
show details | |

|
#29
Blue Lake Ln
Lexington, SC 29072
|
1,204 sq. feet
|
2 baths 3 beds |
show details | |

|
#30
Stephenson Ln
Columbia, SC 29212
|
2,400 sq. feet
|
3 baths 4 beds |
show details |
| Photo | Address | Area | Beds / Baths | Price | Details |
|---|---|---|---|---|---|

|
#31
Top Flight Ct
Irmo, SC 29063
|
2,812 sq. feet
|
2 baths 4 beds |
show details | |

|
#32
Dutch Dr
Irmo, SC 29063
|
1,638 sq. feet
|
2 baths 4 beds |
show details | |

|
#33
Winesett Ct
Irmo, SC 29063
|
1,617 sq. feet
|
2 baths 3 beds |
show details | |

|
#34
Saint Albans Rd
Irmo, SC 29063
|
1,230 sq. feet
|
2 baths 3 beds |
show details | |

|
#35
River Song Rd
Irmo, SC 29063
|
1,501 sq. feet
|
2 baths 3 beds |
show details | |

|
#36
White Falls Cir
Columbia, SC 29212
|
3,428 sq. feet
|
3 baths 4 beds |
show details | |

|
#37
Harmon Creek Dr
Lexington, SC 29072
|
2,490 sq. feet
|
2 baths 5 beds |
show details | |

|
#38
Northstone Ct
Irmo, SC 29063
|
1,290 sq. feet
|
2 baths 3 beds |
show details | |

|
#39
Bookman Mill Rd
Irmo, SC 29063
|
3,136 sq. feet
|
2 baths 5 beds |
show details | |

|
#40
N Royal Tower Dr
Irmo, SC 29063
|
1,188 sq. feet
|
2 baths 3 beds |
show details |
| Photo | Address | Area | Beds / Baths | Price | Details |
|---|---|---|---|---|---|

|
#41
Wharfsdale Rd
Irmo, SC 29063
|
1,048 sq. feet
|
2 baths 3 beds |
show details | |

|
#42
Governors Grant Blvd
Lexington, SC 29072
|
2,453 sq. feet
|
2 baths 3 beds |
show details | |

|
#43
London Pride Rd
Irmo, SC 29063
|
2,269 sq. feet
|
2 baths 3 beds |
show details | |

|
#44
Audubon Oaks Way
Irmo, SC 29063
|
2,027 sq. feet
|
2 baths 4 beds |
show details | |

|
#45
Farming Creek Way
Lexington, SC 29072
|
1,502 sq. feet
|
2 baths 3 beds |
show details | |

|
#46
Cockspur Rd
Irmo, SC 29063
|
1,248 sq. feet
|
2 baths 3 beds |
show details | |

|
#47
Sweet Thorne Rd
Irmo, SC 29063
|
1,368 sq. feet
|
2 baths 3 beds |
show details | |

|
#48
Lely Ct
Irmo, SC 29063
|
1,446 sq. feet
|
2 baths 3 beds |
show details | |

|
#49
Kenton Dr
Irmo, SC 29063
|
1,301 sq. feet
|
2 baths 3 beds |
show details | |

|
Check over 1 million property listings on Foreclosure.com!
|
browse all offers | |||


 | Out-of-market OTA TV reception in Columbia area? (60 replies) |
| What is your favorite local TV newscast? (44 replies) |
| Why are there no hotels at the Chapin I-26 exit? (15 replies) |
| Researching places to live in SC (52 replies) |
| What towns/areas for: kids, veggie garden and safety near Lexington? (9 replies) |
| Moving to Prosperity? (6 replies) |

Median year apartment built: 1955
Household type by relationship:
Households: 468- Male householders: 114 (15 living alone), Female householders: 55 (21 living alone)
101 spouses (101 opposite-sex spouses), 0 unmarried partners, (0 opposite-sex unmarried partners), 161 children (161 natural, 0 adopted, 0 stepchildren), 16 grandchildren, 0 brothers or sisters, 0 parents, 0 foster children, 19 other relatives, 0 non-relatives
Size of family households: 56 2-persons, 28 3-persons, 40 4-persons, 6 5-persons, 3 6-persons.
Size of nonfamily households: 37 1-person.
126 married couples with children.
1 single-parent households (0 men, 1 women).
99.8% of residents of Little Mountain speak English at home.
| Here: | 6.4 |
| State: | 6.4 |
| Here: | 6.5 |
| State: | 4.5 |

- Bedrooms in owner-occupied houses and condos in Little Mountain, South Carolina
- 1no bedroom
- 01 bedroom
- 82 bedrooms
- 903 bedrooms
- 504 bedrooms
- 85+ bedrooms

- Bedrooms in renter-occupied apartments in Little Mountain, South Carolina
- 0no bedroom
- 01 bedroom
- 12 bedrooms
- 113 bedrooms
- 54 bedrooms
- 05+ bedrooms

- Cars and other vehicles available in Little Mountain in owner-occupied houses/condos
- 0no vehicle
- 221 vehicle
- 742 vehicles
- 523 vehicles
- 24 vehicles
- 75+ vehicles

- Cars and other vehicles available in Little Mountain in renter-occupied apartments
- 0no vehicle
- 41 vehicle
- 72 vehicles
- 03 vehicles
- 54 vehicles
- 05+ vehicles

- Rooms in owner-occupied houses in Little Mountain, South Carolina
- 11 room
- 02 rooms
- 03 rooms
- 44 rooms
- 315 rooms
- 506 rooms
- 247 rooms
- 218 rooms
- 269+ rooms

- Rooms in renter-occupied apartments in Little Mountain, South Carolina
- 01 room
- 02 rooms
- 03 rooms
- 04 rooms
- 15 rooms
- 76 rooms
- 87 rooms
- 08 rooms
- 09+ rooms


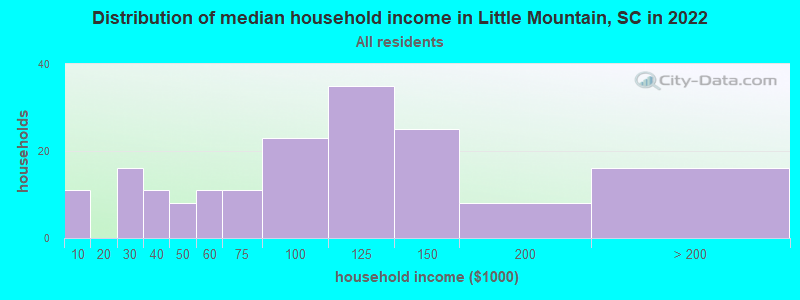
Little Mountain, SC household income distribution

- 11Less than $10,000
- 16$20,000 to $29,999
- 11$30,000 to $39,999
- 8$40,000 to $49,999
- 11$50,000 to $59,999
- 11$60,000 to $74,999
- 23$75,000 to $99,999
- 35$100,000 to $124,999
- 25$125,000 to $149,999
- 8$150,000 to $199,999
- 16$200,000 or more
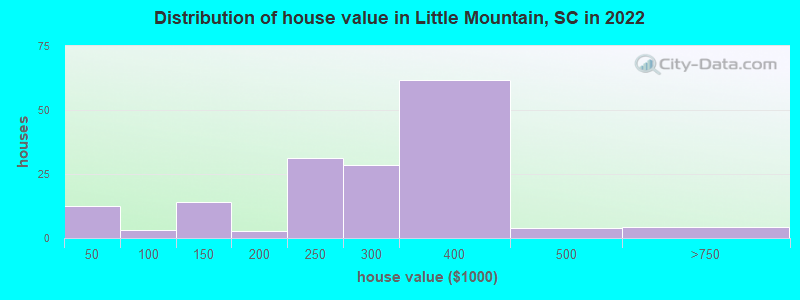
Home value of owner - occupied houses in 2022 in Little Mountain, SC
-
- 7Less than $10,000
- 3$10,000 to $14,999
- 0$20,000 to $24,999
- 1$30,000 to $34,999
- 3$90,000 to $99,999
- 3$100,000 to $124,999
- 10$125,000 to $149,999
- 0$150,000 to $174,999
- 1$175,000 to $199,999
- 31$200,000 to $249,999
- 28$250,000 to $299,999
- 61$300,000 to $399,999
- 3$400,000 to $499,999
- 4$500,000 to $749,999
Rent paid by renters in 2022 in Little Mountain, SC
-
- 0$300 to $349
- 5$350 to $399
- 1$600 to $649
- 2$1,500 to $1,999
- 4No cash rent


Percentage of workers working in this county: 54.4%
Number of people working at home: 30 (13.8% of all workers)
Travel time to work (commute)
- Less than 5 minutes: 13
- 5 to 9 minutes: 8
- 10 to 14 minutes: 11
- 15 to 19 minutes: 32
- 20 to 24 minutes: 30
- 25 to 29 minutes: 10
- 30 to 34 minutes: 22
- 35 to 39 minutes: 19
- 40 to 44 minutes: 0
- 45 to 59 minutes: 18
- 60 to 89 minutes: 19
- 90 or more minutes: 0
Means of transportation to work:
- Drove a car alone: 105 (77.8%)
- Carpooled: 22 (16.3%)
- Worked at home: 8 (5.9%)

- Unemployment by race in 2022
- Unemployment rate for White non-Hispanic residents
- 1.5%Males

First ancestries reported:
- German: 155 (58.1%)
- American: 49 (18.4%)
- English: 27 (10.1%)
- Scotch-Irish: 7 (2.6%)
- British: 2 (0.7%)
- European: 2 (0.7%)
- French: 2 (0.7%)
- Icelander: 2 (0.7%)
- Polish: 1 (0.4%)
- Scottish: 1 (0.4%)
Place of birth for U.S.-born residents:
- This state: 373
- Other state: 85
- Northeast: 1
- Midwest: 11
- South: 70
- West: 0
94.2% of Little Mountain residents lived in the same house 1 years ago.
Out of people who lived in different houses, 0.0% lived in this county.
Out of people who lived in different counties, 100.0% lived in South Carolina.
| Little Mountain: | 94.2% |
| State average: | 86.5% |
Education attainment for males 25 years and older:
- No schooling: 0
- Nursery to 4th grade: 0
- 5th and 6th grade: 0
- 7th and 8th grade: 0
- 9th grade: 0
- 10th grade: 0
- 11th grade: 0
- 12th grade, no diploma: 0
- High school graduate (or equivalency): 26
- Less than 1 year of college: 7
- Some college more than 1 year, no degree: 24
- Associate degree: 36
- Bachelor's degree: 34
- Master's degree: 11
- Professional school degree: 4
- Doctorate degree: 0

Education attainment for females 25 years and older:
- No schooling: 0
- Nursery to 4th grade: 0
- 5th and 6th grade: 3
- 7th and 8th grade: 0
- 9th grade: 0
- 10th grade: 0
- 11th grade: 0
- 12th grade, no diploma: 0
- High school graduate (or equivalency): 24
- Less than 1 year of college: 15
- Some college more than 1 year, no degree: 9
- Associate degree: 28
- Bachelor's degree: 61
- Master's degree: 14
- Professional school degree: 2
- Doctorate degree: 3


Housing units in structures:
- One, detached: 178
- 3 or 4: 11
- 5 to 9: 27
- Mobile homes: 18
Median worth of mobile homes: $10,891
Housing units lacking complete kitchen facilities in 2022: 16.2%
House/condo owner moved in on average 14 years ago
Renter moved in on average 9 years ago

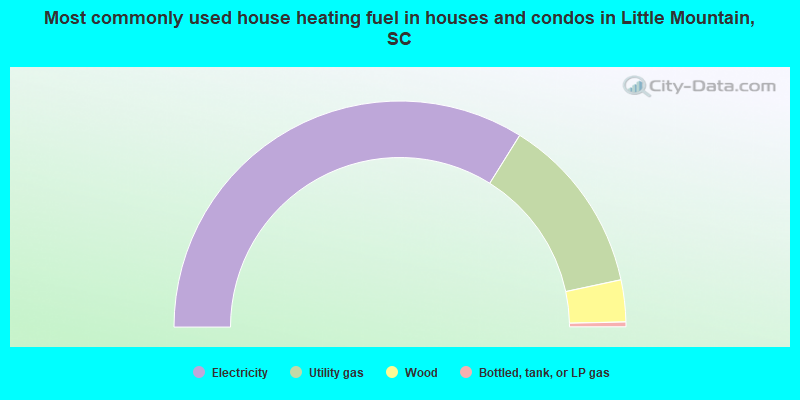
- 67.8%Electricity
- 25.5%Utility gas
- 6.0%Wood
- 0.7%Bottled, tank, or LP gas
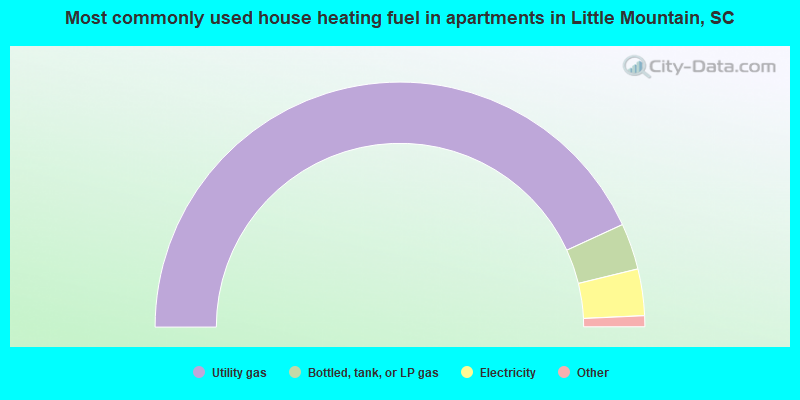
- 87.5%Utility gas
- 6.2%Bottled, tank, or LP gas
- 6.2%Electricity
Private vs. public school enrollment:
| Here: | 0.0% |
| South Carolina: | 14.4% |
| Here: | 33.3% |
| South Carolina: | 11.1% |
| Here: | 0.0% |
| South Carolina: | 21.9% |


