Little River, SC (South Carolina) Houses and Residents
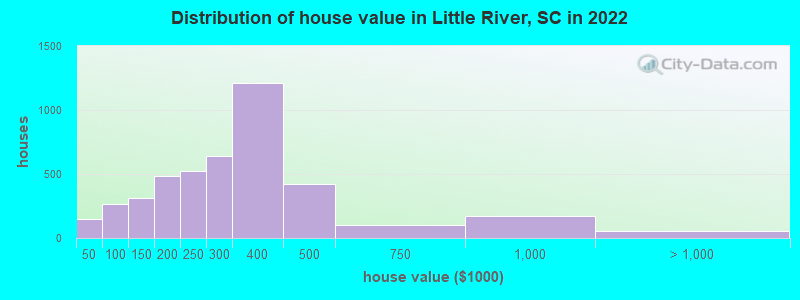
Estimated median house or condo value in 2022: $288,355 (it was $118,000 in 2000 )
Little River:
$288,355South Carolina:
$254,600
Lower value quartile - upper value quartile: $189,225 - $384,779Mean price in 2022: Detached houses: $322,538 Here:
$322,538State:
$368,255
Townhouses or other attached units: $221,460 Here:
$221,460State:
$292,023
In 2-unit structures: $212,507 Here:
$212,507State:
$358,283
In 3-to-4-unit structures: $336,889 Here:
$336,889State:
$230,702
In 5-or-more-unit structures: $303,210 Here:
$303,210State:
$326,361
Mobile homes: $71,860 Here:
$71,860State:
$102,531
Total population: 8,960 (Urban population: 5,235 (4,698 inside urbanized areas, 537 inside urban clusters ), Rural population: 1,669 (all nonfarm) )
Houses: 7,688 (5,205 occupied: 4,229 owner occupied, 1,410 renter occupied )
% of renters here:
25%State:
28%
Housing density: 735 houses/condos per square mile
Median price asked for vacant for-sale houses and condos in 2022: $117,118.
Median contract rent in 2022: $1,139 (lower quartile is $905, upper quartile is $1,558)
Median rent asked for vacant for-rent units in 2022: $6,762
Median gross rent in Little River, SC in 2022: $1,262
Housing units in Little River with a mortgage: 2,318 (115 second mortgage, 0 home equity loan, 114 both second mortgage and home equity loan )Houses without a mortgage: 116
Median household income for houses/condos with a mortgage: $70,315
Median household income for apartments without a mortgage: $68,101
Median monthly housing costs: $943
Data:
Median house or condo value ($)
Median house or condo value ($ change since 2000)
Median house or condo value ($) - White
Median house or condo value ($) - Black or African American
Median house or condo value ($) - Asian
Median house or condo value ($) - Hispanic or Latino
Median house or condo value ($) - American Indian and Alaska Native
Median house or condo value ($) - Multirace
Median house or condo value ($) - Other Race
Median price asked for mobile homes ($)
Household density (households per square mile)
Mean house or condo value by units in structure - 1, detached ($)
Mean house or condo value by units in structure - 1, attached ($)
Mean house or condo value by units in structure - 2 ($)
Mean house or condo value by units in structure by units in structure - 3 or 4 ($)
Mean house or condo value by units in structure - 5 or more ($)
Mean house or condo value by units in structure - Boat, RV, van, etc. ($)
Mean house or condo value by units in structure - Mobile home ($)
Median contract rent ($)
Median contract rent - Lower quartile ($)
Median contract rent - Upper quartile ($)
Median gross rent ($)
Urban houses (%)
Rural houses (%)
Houses occupied (%)
Houses occupied (% change since 2000)
Houses owner occupied (%)
Houses owner occupied (% change since 2000)
Houses renter occupied (%)
Houses renter occupied (% change since 2000)
Vacant housing units - For rent (%)
Vacant housing units - For rent (% change since 2000)
Vacant housing units - For sale only (%)
Vacant housing units - For sale only (% change since 2000)
Vacant housing units - Rented or sold, not occupied (%)
Vacant housing units - Rented or sold, not occupied (% change since 2000)
Vacant housing units - For seasonal, recreational, or occasional use (%)
Vacant housing units - For seasonal, recreational, or occasional use (% change since 2000)
Vacant housing units - For migrant workers (%)
Vacant housing units - For migrant workers (% change since 2000)
Vacant housing units - Other vacant (%)
Vacant housing units - Other vacant (% change since 2000)
Median monthly housing costs ($)
Median household income for houses/condos with a mortgage ($)
Median household income for houses/condos without a mortgage ($)
Median household income ($)
Median household income ($) - White
Median household income ($) - Black or African American
Median household income ($) - Asian
Median household income ($) - Hispanic or Latino
Median household income ($) - American Indian and Alaska Native
Median household income ($) - Multirace
Median household income ($) - Other Race
Mortgage status - with mortgage (%)
Mortgage status - with second mortgage (%)
Mortgage status - with home equity loan (%)
Mortgage status - with both second mortgage and home equity loan (%)
Mortgage status - without a mortgage (%)
Median year house/condo built
Median year apartment built
Household type by relationship - Male householder living alone (%)
Household type by relationship - Male householder not living alone (%)
Household type by relationship - Female householder living alone (%)
Household type by relationship - Female householder not living alone (%)
Household type by relationship - Opposite-Sex spouse (%)
Household type by relationship - Same-Sex spouse (%)
Household type by relationship - Opposite-Sex unmarried partner (%)
Household type by relationship - Same-Sex unmarried partner (%)
Household type by relationship - In group quarters (%)
Size of family households - 2-person household (%)
Size of family households - 3-person household (%)
Size of family households - 4-person household (%)
Size of family households - 5-person household (%)
Size of family households - 6-person household (%)
Size of family households - 7-or-more-person household (%)
Size of nonfamily households - 1-person household (%)
Size of nonfamily households - 2-person household (%)
Size of nonfamily households - 3-person household (%)
Size of nonfamily households - 4-person household (%)
Size of nonfamily households - 5-person household (%)
Size of nonfamily households - 6-person household (%)
Size of nonfamily households - 7-or-moreperson household (%)
Year house built - Built 2010 or later (%)
Year house built - Built 2000 to 2009 (%)
Year house built - Built 1990 to 1999 (%)
Year house built - Built 1980 to 1989 (%)
Year house built - Built 1970 to 1979 (%)
Year house built - Built 1960 to 1969 (%)
Year house built - Built 1950 to 1959 (%)
Year house built - Built 1940 to 1949 (%)
Year house built - Built 1939 or earlier (%)
Median number of rooms in houses and condos
Median number of rooms in apartments
Median number of bedrooms in owner occupied houses
Mean number of bedrooms in owner occupied houses
Median number of bedrooms in renter occupied houses
Mean number of bedrooms in renter occupied houses
Median number of vehichles in owner occupied houses
Mean number of vehichles in owner occupied houses
Median number of vehichles in renter occupied houses
Mean number of vehichles in renter occupied houses
Rooms in owner-occupied houses - 1 room (%)
Rooms in owner-occupied houses - 2 rooms (%)
Rooms in owner-occupied houses - 3 rooms (%)
Rooms in owner-occupied houses - 4 rooms (%)
Rooms in owner-occupied houses - 5 rooms (%)
Rooms in owner-occupied houses - 6 rooms (%)
Rooms in owner-occupied houses - 7 rooms (%)
Rooms in owner-occupied houses - 8 rooms (%)
Rooms in owner-occupied houses - 9+ rooms (%)
Rooms in renter-occupied houses - 1 room (%)
Rooms in renter-occupied houses - 2 rooms (%)
Rooms in renter-occupied houses - 3 rooms (%)
Rooms in renter-occupied houses - 4 rooms (%)
Rooms in renter-occupied houses - 5 rooms (%)
Rooms in renter-occupied houses - 6 rooms (%)
Rooms in renter-occupied houses - 7 rooms (%)
Rooms in renter-occupied houses - 8 rooms (%)
Rooms in renter-occupied houses - 9+ rooms (%)
Bedrooms in owner-occupied houses - no bedrooms (%)
Bedrooms in owner-occupied houses - 1 bedroom (%)
Bedrooms in owner-occupied houses - 2 bedrooms (%)
Bedrooms in owner-occupied houses - 3 bedrooms (%)
Bedrooms in owner-occupied houses - 4 bedrooms (%)
Bedrooms in owner-occupied houses - 5+ bedrooms (%)
Bedrooms in renter-occupied houses - no bedrooms (%)
Bedrooms in renter-occupied houses - 1 bedroom (%)
Bedrooms in renter-occupied houses - 2 bedrooms (%)
Bedrooms in renter-occupied houses - 3 bedrooms (%)
Bedrooms in renter-occupied houses - 4 bedrooms (%)
Bedrooms in renter-occupied houses - 5+ bedrooms (%)
Vehicles available in owner-occupied houses - no vehicle available (%)
Vehicles available in owner-occupied houses - 1 vehicle available(%)
Vehicles available in owner-occupied houses - 2 Vehicles available (%)
Vehicles available in owner-occupied houses - 3 Vehicles available (%)
Vehicles available in owner-occupied houses - 4 Vehicles available (%)
Vehicles available in owner-occupied houses - 5+ Vehicles available (%)
Vehicles available in renter-occupied houses - no vehicle available (%)
Vehicles available in renter-occupied houses - 1 vehicle available (%)
Vehicles available in renter-occupied houses - 2 Vehicles available (%)
Vehicles available in renter-occupied houses - 3 Vehicles available (%)
Vehicles available in renter-occupied houses - 4 Vehicles available (%)
Vehicles available in renter-occupied houses - 5+ Vehicles available (%)
Housing units in structures - 1, detached (%)
Housing units in structures - 1, attached (%)
Housing units in structures - 2 (%)
Housing units in structures - 3 or 4 (%)
Housing units in structures - 5 to 9 (%)
Housing units in structures - 10 to 19 (%)
Housing units in structures - 20 to 49 (%)
Housing units in structures - 50 or more (%)
Housing units in structures - Mobile home (%)
Housing units in structures - Boat, RV, van, etc. (%)
Housing units in structures - Owners - 1, detached (%)
Housing units in structures - Owners - 1, attached (%)
Housing units in structures - Owners - 2 (%)
Housing units in structures - Owners - 3 or 4 (%)
Housing units in structures - Owners - 5 to 9 (%)
Housing units in structures - Owners - 10 to 19 (%)
Housing units in structures - Owners - 20 to 49 (%)
Housing units in structures - Owners - 50 or more (%)
Housing units in structures - Owners - Mobile home (%)
Housing units in structures - Owners - Boat, RV, van, etc. (%)
Housing units in structures - Renters - 1, detached (%)
Housing units in structures - Renters - 1, attached (%)
Housing units in structures - Renters - 2 (%)
Housing units in structures - Renters - 3 or 4 (%)
Housing units in structures - Renters - 5 to 9 (%)
Housing units in structures - Renters - 10 to 19 (%)
Housing units in structures - Renters - 20 to 49 (%)
Housing units in structures - Renters - 50 or more (%)
Housing units in structures - Renters - Mobile home (%)
Housing units in structures - Renters - Boat, RV, van, etc. (%)
House/condo owner moved in on average (years ago)
Renter moved in on average (years ago)
Year householder moved into unit - Moved in 1999 to March 2000 (%)
Year householder moved into unit - Moved in 1999 to March 2000 (%) - White
Year householder moved into unit - Moved in 1999 to March 2000 (%) - Black or African American
Year householder moved into unit - Moved in 1999 to March 2000 (%) - Asian
Year householder moved into unit - Moved in 1999 to March 2000 (%) - Hispanic or Latino
Year householder moved into unit - Moved in 1999 to March 2000 (%) - American Indian and Alaska Native
Year householder moved into unit - Moved in 1999 to March 2000 (%) - Multirace
Year householder moved into unit - Moved in 1999 to March 2000 (%) - Other Race
Year householder moved into unit - Moved in 1995 to 1998 (%)
Year householder moved into unit - Moved in 1995 to 1998 (%) - White
Year householder moved into unit - Moved in 1995 to 1998 (%) - Black or African American
Year householder moved into unit - Moved in 1995 to 1998 (%) - Asian
Year householder moved into unit - Moved in 1995 to 1998 (%) - Hispanic or Latino
Year householder moved into unit - Moved in 1995 to 1998 (%) - American Indian and Alaska Native
Year householder moved into unit - Moved in 1995 to 1998 (%) - Multirace
Year householder moved into unit - Moved in 1995 to 1998 (%) - Other Race
Year householder moved into unit - Moved in 1990 to 1994 (%)
Year householder moved into unit - Moved in 1990 to 1994 (%) - White
Year householder moved into unit - Moved in 1990 to 1994 (%) - Black or African American
Year householder moved into unit - Moved in 1990 to 1994 (%) - Asian
Year householder moved into unit - Moved in 1990 to 1994 (%) - Hispanic or Latino
Year householder moved into unit - Moved in 1990 to 1994 (%) - American Indian and Alaska Native
Year householder moved into unit - Moved in 1990 to 1994 (%) - Multirace
Year householder moved into unit - Moved in 1990 to 1994 (%) - Other Race
Year householder moved into unit - Moved in 1980 to 1989 (%)
Year householder moved into unit - Moved in 1980 to 1989 (%) - White
Year householder moved into unit - Moved in 1980 to 1989 (%) - Black or African American
Year householder moved into unit - Moved in 1980 to 1989 (%) - Asian
Year householder moved into unit - Moved in 1980 to 1989 (%) - Hispanic or Latino
Year householder moved into unit - Moved in 1980 to 1989 (%) - American Indian and Alaska Native
Year householder moved into unit - Moved in 1980 to 1989 (%) - Multirace
Year householder moved into unit - Moved in 1980 to 1989 (%) - Other Race
Year householder moved into unit - Moved in 1970 to 1979 (%)
Year householder moved into unit - Moved in 1970 to 1979 (%) - White
Year householder moved into unit - Moved in 1970 to 1979 (%) - Black or African American
Year householder moved into unit - Moved in 1970 to 1979 (%) - Asian
Year householder moved into unit - Moved in 1970 to 1979 (%) - Hispanic or Latino
Year householder moved into unit - Moved in 1970 to 1979 (%) - American Indian and Alaska Native
Year householder moved into unit - Moved in 1970 to 1979 (%) - Multirace
Year householder moved into unit - Moved in 1970 to 1979 (%) - Other Race
Year householder moved into unit - Moved in 1969 or earlier (%)
Year householder moved into unit - Moved in 1969 or earlier (%) - White
Year householder moved into unit - Moved in 1969 or earlier (%) - Black or African American
Year householder moved into unit - Moved in 1969 or earlier (%) - Asian
Year householder moved into unit - Moved in 1969 or earlier (%) - Hispanic or Latino
Year householder moved into unit - Moved in 1969 or earlier (%) - American Indian and Alaska Native
Year householder moved into unit - Moved in 1969 or earlier (%) - Multirace
Year householder moved into unit - Moved in 1969 or earlier (%) - Other Race
Housing units lacking complete plumbing facilities (%)
Housing units lacking complete kitchen facilities (%)
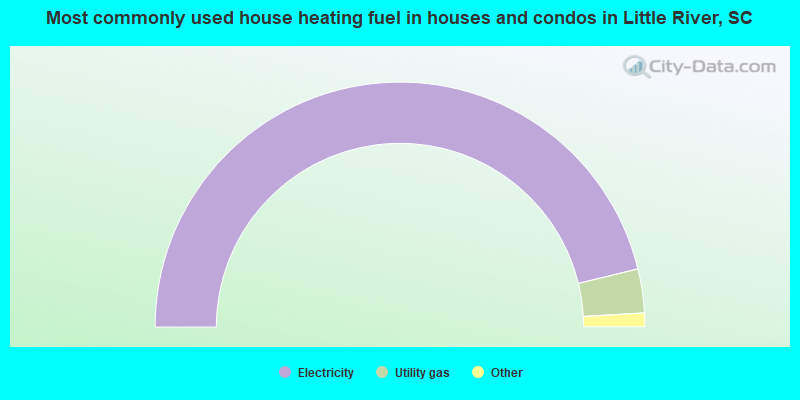
House heating fuel used in houses and condos - Utility gas (%)
House heating fuel used in houses and condos - Bottled, tank, or LP gas (%)
House heating fuel used in houses and condos - Electricity (%)
House heating fuel used in houses and condos - Fuel oil, kerosene, etc. (%)
House heating fuel used in houses and condos - Coal or coke (%)
House heating fuel used in houses and condos - Wood (%)
House heating fuel used in houses and condos - Solar energy (%)
House heating fuel used in houses and condos - Other fuel (%)
House heating fuel used in houses and condos - No fuel used (%)
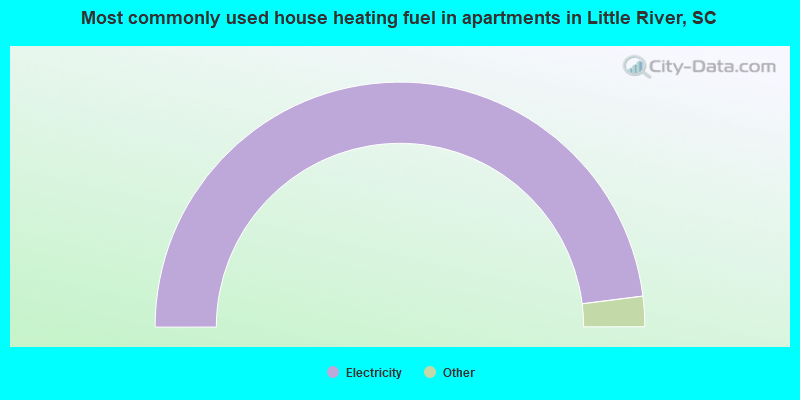
House heating fuel used in apartments - Utility gas (%)
House heating fuel used in apartments - Bottled, tank, or LP gas (%)
House heating fuel used in apartments - Electricity (%)
House heating fuel used in apartments - Fuel oil, kerosene, etc. (%)
House heating fuel used in apartments - Coal or coke (%)
House heating fuel used in apartments - Wood (%)
House heating fuel used in apartments - Solar energy (%)
House heating fuel used in apartments - Other fuel (%)
House heating fuel used in apartments - No fuel used (%)
Median year house/condo built: 1999Median year apartment built: 1997Household type by relationship:
Households: 10,545
Male householders: 2,532 (738 living alone ), Female householders: 2,789 (1,161 living alone )2,559 spouses (2,544 opposite-sex spouses ), 356 unmarried partners , (356 opposite-sex unmarried partners ), 1,564 children (1,499 natural , 22 adopted , 41 stepchildren ), 85 grandchildren , 106 brothers or sisters , 59 parents , 0 foster children , 134 other relatives , 345 non-relatives In group quarters: 11
Size of family households: 2,793 2-persons , 314 3-persons , 160 4-persons , 99 5-persons , 7 7-or-more-persons .
Size of nonfamily households: 1,912 1-person , 423 2-persons , 15 3-persons .
606 married couples with children. single-parent households (81 men , 373 women ).
97.0% of residents of Little River speak English at home. of residents speak Spanish at home (97% speak English very well , 3% speak English not well ).of residents speak other Indo-European language at home (97% speak English very well , 3% speak English not well ).of residents speak Asian or Pacific Island language at home (100% speak English very well ).
Foreign born population: 417 (4.0%)of them are naturalized citizens )
Median number of rooms in houses and condos:
Median number of rooms in apartments
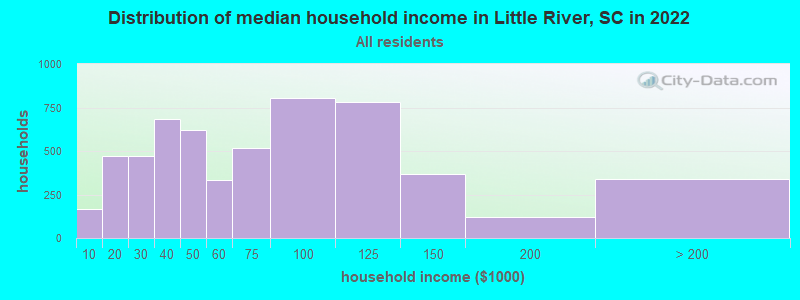
Little River, SC household income distribution 164 Less than $10,000473 $10,000 to $19,999472 $20,000 to $29,999686 $30,000 to $39,999618 $40,000 to $49,999333 $50,000 to $59,999515 $60,000 to $74,999802 $75,000 to $99,999782 $100,000 to $124,999367 $125,000 to $149,999119 $150,000 to $199,999341 $200,000 or more
Home value of owner - occupied houses in 2022 in Little River, SC 14 Less than $10,0009 $20,000 to $24,99913 $25,000 to $29,999111 $40,000 to $49,99922 $50,000 to $59,9997 $60,000 to $69,99919 $70,000 to $79,99952 $80,000 to $89,99952 $90,000 to $99,999171 $100,000 to $124,999141 $125,000 to $149,999268 $150,000 to $174,999219 $175,000 to $199,999520 $200,000 to $249,999643 $250,000 to $299,9991,209 $300,000 to $399,999417 $400,000 to $499,999101 $500,000 to $749,999169 $750,000 to $999,99917 $1,000,000 to $1,499,99941 $2,000,000 or moreRent paid by renters in 2022 in Little River, SC 34 $200 to $24936 $400 to $44912 $450 to $499109 $600 to $64917 $650 to $69916 $700 to $74910 $750 to $79969 $800 to $899234 $900 to $999198 $1,000 to $1,249288 $1,250 to $1,499314 $1,500 to $1,99978 No cash rent
Percentage of workers working in this county: 84.0%Number of people working at home: 641 (15.8% of all workers )
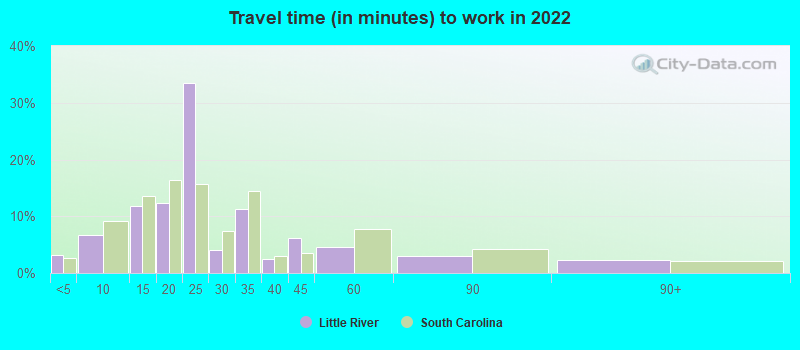
Travel time to work (commute)
Less than 5 minutes: 1255 to 9 minutes: 32110 to 14 minutes: 26415 to 19 minutes: 57820 to 24 minutes: 73725 to 29 minutes: 37830 to 34 minutes: 37135 to 39 minutes: 2940 to 44 minutes: 8345 to 59 minutes: 40960 to 89 minutes: 9690 or more minutes: 135
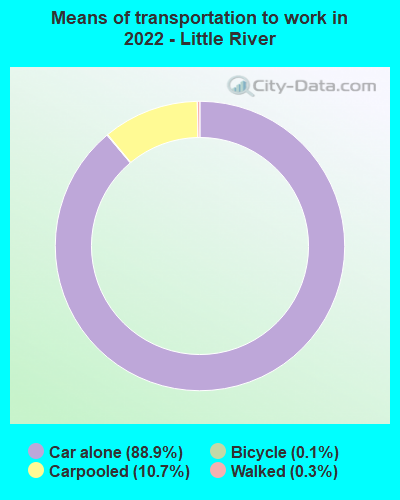
Means of transportation to work:
Drove a car alone: 3,187 (73.9%)Carpooled: 470 (10.9%)Bicycle: 5 (0.1%)Walked: 11 (0.3%)Worked at home: 641 (14.9%)
Unemployment by race in 2022
Unemployment rate for White non-Hispanic residents 3.4% Males1.3% FemalesUnemployment rate for Black residents 13.2% Males
Year of entry for the foreign-born population in Little River, South Carolina
53 2010 or later 97 2000 to 2009 47 1990 to 1999 0 1980 to 1989 37 1970 to 1979 122 Before 1970
First ancestries reported:
English: 1,034 (17.4%)
European: 1,021 (17.2%)
American: 903 (15.2%)
German: 424 (7.1%)
Italian: 407 (6.8%)
Irish: 365 (6.1%)
Scotch-Irish: 228 (3.8%)
Polish: 139 (2.3%)
Hungarian: 123 (2.1%)
Albanian: 119 (2.0%)
Scottish: 62 (1.0%)
British: 42 (0.7%)
Slovak: 41 (0.7%)
Bulgarian: 35 (0.6%)
Armenian: 24 (0.4%)
Greek: 19 (0.3%)
French Canadian: 18 (0.3%)
French: 17 (0.3%)
Danish: 13 (0.2%)
Norwegian: 10 (0.2%)
Welsh: 10 (0.2%)
Dutch: 7 (0.1%)
Northern European: 7 (0.1%)
Pennsylvania German: 7 (0.1%) Most common places of birth for foreign-born residents (%): Albania Little River:
25.7% (95)South Carolina:
0.2% (495)
El Salvador Little River:
14.4% (53)South Carolina:
1.1% (2,998)
Philippines Little River:
10.8% (40)South Carolina:
4.1% (11,031)
Dominican Republic Little River:
7.3% (27)South Carolina:
0.9% (2,357)
Bulgaria Little River:
7.0% (26)South Carolina:
0.2% (566)
Mexico Little River:
7.0% (26)South Carolina:
22.5% (60,774)
Greece Little River:
6.8% (25)South Carolina:
0.5% (1,296)
Switzerland Little River:
6.5% (24)South Carolina:
0.1% (403)
Hungary Little River:
5.7% (21)South Carolina:
0.2% (622)
Bosnia and Herzegovina Little River:
4.6% (17)South Carolina:
0.2% (410)
Denmark Little River:
3.0% (11)South Carolina:
0.1% (347)
Bahamas Little River:
2.7% (10)South Carolina:
0.2% (445)
Germany Little River:
2.4% (9)South Carolina:
3.7% (9,982)
Canada Little River:
2.4% (9)South Carolina:
3.0% (8,193)
United Kingdom, excluding England and Scotland Little River:
1.9% (7)South Carolina:
1.2% (3,296)
England Little River:
1.9% (7)South Carolina:
1.9% (5,117)
Place of birth for U.S.-born residents:
This state: 2,331Other state: 7,748Northeast: 2,725Midwest: 930South: 3,681West: 325 83.2% of Little River residents lived in the same house 1 years ago.
Out of people who lived in different houses, 21.7% lived in this county.
Out of people who lived in different counties, 4.0% lived in South Carolina.
Little River:
83.2%State average:
86.5%
Education attainment for males 25 years and older:
No schooling: 15Nursery to 4th grade: 435th and 6th grade: 07th and 8th grade: 09th grade: 2110th grade: 5011th grade: 2412th grade, no diploma: 234High school graduate (or equivalency): 1,033Less than 1 year of college: 464Some college more than 1 year, no degree: 817Associate degree: 380Bachelor's degree: 956Master's degree: 262Professional school degree: 27Doctorate degree: 0
Education attainment for females 25 years and older:
No schooling: 0Nursery to 4th grade: 05th and 6th grade: 147th and 8th grade: 09th grade: 2010th grade: 20311th grade: 12212th grade, no diploma: 26High school graduate (or equivalency): 1,537Less than 1 year of college: 461Some college more than 1 year, no degree: 642Associate degree: 726Bachelor's degree: 739Master's degree: 264Professional school degree: 47Doctorate degree: 29
Housing units in structures:
One, detached: 3,300One, attached: 579Two: 723 or 4: 1505 to 9: 1,04910 to 19: 1,27020 to 49: 67650 or more: 38Mobile homes: 549Median worth of mobile homes: $60,290
Housing units lacking complete plumbing facilities in 2022: 0.3%Housing units lacking complete kitchen facilities in 2022: 0.3%House/condo owner moved in on average 7 years ago
Renter moved in on average 2 years ago
Private vs. public school enrollment:
Students in private schools in grades 1 to 8 (elementary and middle school): 74 Here:
14.1%South Carolina:
14.4%
Students in private schools in grades 9 to 12 (high school): 0 Here:
0.0%South Carolina:
11.1%
Students in private undergraduate colleges: 5 Here:
3.0%South Carolina:
21.9%