Little Silver, NJ (New Jersey) Houses and Residents
| Little Silver: | $907,685 |
| New Jersey: | $428,900 |
Mean price in 2022:
Detached houses: $1,125,249
Here: $1,125,249 State: $537,591 Townhouses or other attached units: $723,627
Here: $723,627 State: $381,113 In 5-or-more-unit structures: $630,505
Here: $630,505 State: $368,745
Total population: 5,918 (All urban)
Houses: 2,350 (2,260 occupied: 2,211 owner occupied, 87 renter occupied)
| % of renters here: | 4% |
| State: | 35% |
Housing density: 848 houses/condos per square mile
Median price asked for vacant for-sale houses and condos in 2022 in this county: $430,351.
Median contract rent in 2022: over $2,000
Median gross rent in Little Silver, NJ in 2022: over $2,000
Housing units in Little Silver with a mortgage: 1,600 (229 second mortgage, 0 home equity loan, 225 both second mortgage and home equity loan)
Houses without a mortgage: 131
Median household income for houses/condos with a mortgage: $238,084
Median household income for apartments without a mortgage: $152,247
Median monthly housing costs: $3,168
Compare current foreclosures near Little Silver, NJ:
| Photo | Address | Area | Beds / Baths | Price | Details |
|---|---|---|---|---|---|

|
#1
Silverside Ave
Little Silver, NJ 07739
|
2,111 sq. feet
|
- baths - beds |
show details | |

|
#2
Maple Ave
Little Silver, NJ 07739
|
3,687 sq. feet
|
- baths - beds |
show details | |

|
#3
Rumson Rd
Little Silver, NJ 07739
|
1,429 sq. feet
|
- baths - beds |
show details | |

|
#4
Rumson Rd
Little Silver, NJ 07739
|
1,429 sq. feet
|
- baths - beds |
show details | |

|
#5
Branch Ave
Little Silver, NJ 07739
|
- sq. feet
|
- baths - beds |
show details | |

|
#6
Rumson Rd
Little Silver, NJ 07739
|
1,792 sq. feet
|
- baths - beds |
show details | |

|
#7
Henry St
Keyport, NJ 07735
|
800 sq. feet
|
1 baths 2 beds |
$219,350
|
show details |

|
#8
Warren Street
Keyport, NJ 07735
|
2,889 sq. feet
|
2 baths 7 beds |
$459,900
|
show details |

|
#9
Russell St # G
Staten Island, NY 10308
|
642 sq. feet
|
1 baths 1 beds |
$185,000
|
show details |

|
#10
Catherine St
South Amboy, NJ 08879
|
2,266 sq. feet
|
3 baths 4 beds |
$351,900
|
show details |
| Photo | Address | Area | Beds / Baths | Price | Details |
|---|---|---|---|---|---|

|
#11
Harrison Ave
Little Silver, NJ 07739
|
- sq. feet
|
- baths - beds |
show details | |

|
#12
-11 Spring St
Red Bank, NJ 07701
|
1,096 sq. feet
|
1 baths 2 beds |
show details | |

|
#13
Crawford Street
Red Bank, NJ 07701
|
1,280 sq. feet
|
1 baths 2 beds |
show details | |

|
#14
Kilmer Dr
Englishtown, NJ 07726
|
1,960 sq. feet
|
2 baths 4 beds |
show details | |

|
#15
Shady Ln
Howell, NJ 07731
|
1,464 sq. feet
|
1 baths 4 beds |
show details | |

|
#16
20th Ave
Brick, NJ 08724
|
1,428 sq. feet
|
2 baths 3 beds |
show details | |

|
#17
Athens Ave
South Amboy, NJ 08879
|
1,790 sq. feet
|
2 baths 3 beds |
show details | |

|
#18
Princeton Ct
Allenwood, NJ 08720
|
2,970 sq. feet
|
1 baths 4 beds |
show details | |

|
#19
Main St
Middletown, NJ 07748
|
- sq. feet
|
1 baths 2 beds |
show details | |

|
#20
Dock St
Keyport, NJ 07735
|
1,362 sq. feet
|
2 baths 3 beds |
show details |
| Photo | Address | Area | Beds / Baths | Price | Details |
|---|---|---|---|---|---|

|
#21
1st Ave
Asbury Park, NJ 07712
|
1,318 sq. feet
|
1 baths 2 beds |
show details | |

|
#22
Creamery Ct
Freehold, NJ 07728
|
1,510 sq. feet
|
1 baths 3 beds |
show details | |

|
#23
Drummond Ave
Neptune, NJ 07753
|
928 sq. feet
|
1 baths 2 beds |
show details | |

|
#24
Maurice Ave
Holmdel, NJ 07733
|
1,296 sq. feet
|
2 baths 3 beds |
show details | |

|
#25
Dudley St
Long Branch, NJ 07740
|
1,668 sq. feet
|
1 baths 3 beds |
show details | |

|
#26
Bloomfield Rd
Englishtown, NJ 07726
|
3,053 sq. feet
|
3 baths 4 beds |
show details | |

|
#27
Morningside Ave
Keyport, NJ 07735
|
1,228 sq. feet
|
2 baths 3 beds |
show details | |

|
#28
9th Ave
Neptune, NJ 07753
|
992 sq. feet
|
1 baths 2 beds |
show details | |

|
#29
Wilson Ave
Matawan, NJ 07747
|
1,464 sq. feet
|
2 baths 3 beds |
show details | |

|
#30
Highland Ave
Long Branch, NJ 07740
|
2,608 sq. feet
|
2 baths 5 beds |
show details |
| Photo | Address | Area | Beds / Baths | Price | Details |
|---|---|---|---|---|---|

|
#31
Amboy Rd
Staten Island, NY 10308
|
2,670 sq. feet
|
2 baths 2 beds |
show details | |

|
#32
Netherwood Dr
Keyport, NJ 07735
|
876 sq. feet
|
1 baths 3 beds |
show details | |

|
#33
Potter Rd
Freehold, NJ 07728
|
4,062 sq. feet
|
3 baths 5 beds |
show details | |

|
#34
Morning Dew Ct
Old Bridge, NJ 08857
|
1,793 sq. feet
|
2 baths 3 beds |
show details | |

|
#35
Denise Ct
Englishtown, NJ 07726
|
3,070 sq. feet
|
3 baths 5 beds |
show details | |

|
#36
Alba Ln
West Long Branch, NJ 07764
|
5,483 sq. feet
|
6 baths 5 beds |
show details | |

|
#37
Cheyenne St
Asbury Park, NJ 07712
|
1,840 sq. feet
|
2 baths 3 beds |
show details | |

|
#38
Arthur Kill Rd
Staten Island, NY 10307
|
1,800 sq. feet
|
3 baths 3 beds |
show details | |

|
#39
Crine Rd
Morganville, NJ 07751
|
3,058 sq. feet
|
3 baths 5 beds |
show details | |

|
#40
Hammock Ln
Staten Island, NY 10312
|
2,000 sq. feet
|
1 baths 3 beds |
show details |
| Photo | Address | Area | Beds / Baths | Price | Details |
|---|---|---|---|---|---|

|
#41
Lorillard Ave
Keyport, NJ 07735
|
762 sq. feet
|
1 baths 2 beds |
show details | |

|
#42
Lewis St
Perth Amboy, NJ 08861
|
2,115 sq. feet
|
4 baths 5 beds |
show details | |

|
#43
Dora Ln
Holmdel, NJ 07733
|
4,783 sq. feet
|
2 baths 4 beds |
show details | |

|
#44
Pkwy Dr
Freehold, NJ 07728
|
1,262 sq. feet
|
1 baths 2 beds |
show details | |

|
#45
Jupiter St
Middletown, NJ 07748
|
2,040 sq. feet
|
2 baths 4 beds |
show details | |

|
#46
Bridle Path
Neptune, NJ 07753
|
1,992 sq. feet
|
1 baths 3 beds |
show details | |

|
#47
Susan Ln
Brielle, NJ 08730
|
- sq. feet
|
2 baths 2 beds |
show details | |

|
#48
Rankin Rd
Brielle, NJ 08730
|
- sq. feet
|
3 baths 4 beds |
show details | |

|
#49
Beach 46th St
Brooklyn, NY 11224
|
- sq. feet
|
4 baths 5 beds |
show details | |

|
Check over 1 million property listings on Foreclosure.com!
|
browse all offers | |||


 | Ocean Township vs Little Silver for diverse family (53 replies) |
| What Do You Think An Honest Future Of Atlantic City Is? (72 replies) |
| Train to midtown from Little Silver (3 replies) |
| NJT Coastline and/or NEC Lines Were Suspended Mon, Wed, Thurs, and Today! (21 replies) |
| NJ - Holmdel / Colts Neck - low inventory / insanely high property taxes (113 replies) |
| Little Silver? (9 replies) |

Median year apartment built: 1994
Household type by relationship:
Households: 6,113- Male householders: 1,247 (79 living alone), Female householders: 1,004 (221 living alone)
1,597 spouses (1,597 opposite-sex spouses), 188 unmarried partners, (188 opposite-sex unmarried partners), 1,997 children (1,953 natural, 20 adopted, 24 stepchildren), 22 grandchildren, 26 brothers or sisters, 9 parents, 0 foster children, 0 other relatives, 22 non-relatives
Size of family households: 705 2-persons, 595 3-persons, 409 4-persons, 137 5-persons, 24 6-persons.
Size of nonfamily households: 299 1-person, 145 2-persons.
1,289 married couples with children.
99 single-parent households (55 men, 44 women).
94.2% of residents of Little Silver speak English at home.
0.2% of residents speak Spanish at home (100% speak English very well).
3.6% of residents speak other Indo-European language at home (80% speak English very well, 10% speak English well, 10% speak English not well).
1.3% of residents speak other language at home (100% speak English very well).
Foreign born population: 295 (4.8%)
(48.5% of them are naturalized citizens)
| Here: | 7.9 |
| State: | 6.8 |
| Here: | 7.5 |
| State: | 3.9 |

- Bedrooms in owner-occupied houses and condos in Little Silver, New Jersey
- 0no bedroom
- 01 bedroom
- 1242 bedrooms
- 8463 bedrooms
- 9484 bedrooms
- 2945+ bedrooms

- Bedrooms in renter-occupied apartments in Little Silver, New Jersey
- 0no bedroom
- 01 bedroom
- 632 bedrooms
- 143 bedrooms
- 104 bedrooms
- 05+ bedrooms

- Cars and other vehicles available in Little Silver in owner-occupied houses/condos
- 20no vehicle
- 3831 vehicle
- 1,2732 vehicles
- 4873 vehicles
- 304 vehicles
- 185+ vehicles

- Cars and other vehicles available in Little Silver in renter-occupied apartments
- 0no vehicle
- 141 vehicle
- 742 vehicles
- 03 vehicles
- 04 vehicles
- 05+ vehicles

- Rooms in owner-occupied houses in Little Silver, New Jersey
- 01 room
- 02 rooms
- 03 rooms
- 204 rooms
- 1425 rooms
- 2346 rooms
- 4077 rooms
- 7818 rooms
- 6269+ rooms

- Rooms in renter-occupied apartments in Little Silver, New Jersey
- 01 room
- 02 rooms
- 03 rooms
- 04 rooms
- 05 rooms
- 336 rooms
- 107 rooms
- 458 rooms
- 09+ rooms


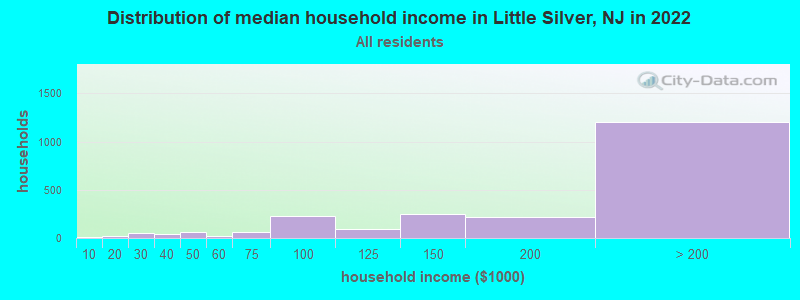
Little Silver, NJ household income distribution

- 12Less than $10,000
- 22$10,000 to $19,999
- 55$20,000 to $29,999
- 37$30,000 to $39,999
- 67$40,000 to $49,999
- 21$50,000 to $59,999
- 65$60,000 to $74,999
- 226$75,000 to $99,999
- 95$100,000 to $124,999
- 253$125,000 to $149,999
- 214$150,000 to $199,999
- 1,203$200,000 or more
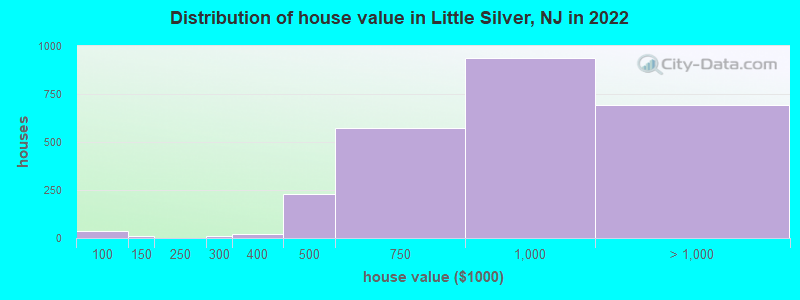
Home value of owner - occupied houses in 2022 in Little Silver, NJ
-
- 33$70,000 to $79,999
- 10$125,000 to $149,999
- 9$250,000 to $299,999
- 19$300,000 to $399,999
- 229$400,000 to $499,999
- 571$500,000 to $749,999
- 938$750,000 to $999,999
- 473$1,000,000 to $1,499,999
- 146$1,500,000 to $1,999,999
- 72$2,000,000 or more
Rent paid by renters in 2022 in Little Silver, NJ
-
- 11Less than $100
- 15$2,500 to $2,999
- 49$3,500 or more
- 11No cash rent


Percentage of workers working in this county: 78.9%
Number of people working at home: 1,082 (33.6% of all workers)
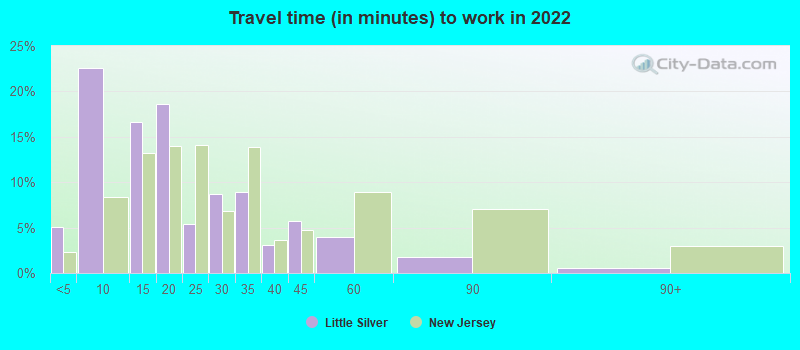
Travel time to work (commute)
- Less than 5 minutes: 151
- 5 to 9 minutes: 496
- 10 to 14 minutes: 542
- 15 to 19 minutes: 211
- 20 to 24 minutes: 31
- 25 to 29 minutes: 48
- 30 to 34 minutes: 178
- 35 to 39 minutes: 87
- 40 to 44 minutes: 0
- 45 to 59 minutes: 85
- 60 to 89 minutes: 114
- 90 or more minutes: 382
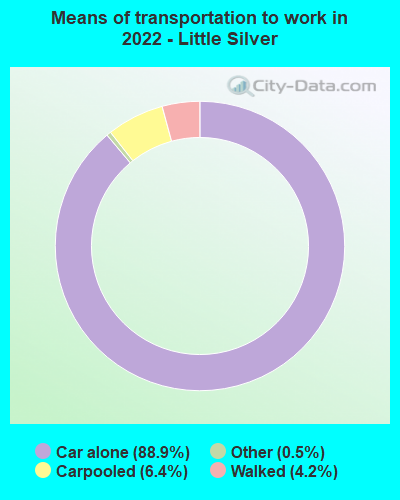
Means of transportation to work:
- Drove a car alone: 1,670 (57.5%)
- Carpooled: 143 (4.9%)
- Taxi: 15 (0.5%)
- Walked: 117 (4.0%)
- Worked at home: 1,082 (37.3%)

- Unemployment by race in 2022
- Unemployment rate for White non-Hispanic residents
- 3.5%Males
- 0.3%Females

- Year of entry for the foreign-born population in Little Silver, New Jersey
- 562010 or later
- 832000 to 2009
- 371990 to 1999
- 461980 to 1989
- 441970 to 1979
- 143Before 1970

First ancestries reported:
- Irish: 464 (21.0%)
- Italian: 439 (19.9%)
- German: 157 (7.1%)
- American: 147 (6.7%)
- English: 132 (6.0%)
- British: 94 (4.3%)
- Polish: 67 (3.0%)
- French: 56 (2.5%)
- Greek: 54 (2.4%)
- Swedish: 50 (2.3%)
- Romanian: 40 (1.8%)
- Scotch-Irish: 29 (1.3%)
- European: 23 (1.0%)
- Lithuanian: 20 (0.9%)
- Ukrainian: 20 (0.9%)
- Scottish: 17 (0.8%)
- Dutch: 16 (0.7%)
- Maltese: 15 (0.7%)
- Eastern European: 14 (0.6%)
- Russian: 13 (0.6%)
- Armenian: 11 (0.5%)
Most common places of birth for foreign-born residents (%):
| Little Silver: | 20.1% (59) |
| New Jersey: | 0.5% (10,886) |
| Little Silver: | 15.0% (44) |
| New Jersey: | 0.4% (8,146) |
| Little Silver: | 11.6% (34) |
| New Jersey: | 0.3% (6,033) |
| Little Silver: | 11.2% (33) |
| New Jersey: | 2.3% (48,811) |
| Little Silver: | 7.1% (21) |
| New Jersey: | 0.8% (17,217) |
| Little Silver: | 6.8% (20) |
| New Jersey: | 1.1% (22,760) |
| Little Silver: | 6.1% (18) |
| New Jersey: | 0.3% (6,882) |
| Little Silver: | 4.1% (12) |
| New Jersey: | 1.5% (33,198) |
| Little Silver: | 3.4% (10) |
| New Jersey: | 0.6% (12,793) |
| Little Silver: | 3.1% (9) |
| New Jersey: | 0.1% (2,405) |
Place of birth for U.S.-born residents:
- This state: 3,769
- Other state: 2,021
- Northeast: 1,106
- Midwest: 268
- South: 565
- West: 118
94.9% of Little Silver residents lived in the same house 1 years ago.
Out of people who lived in different houses, 37.8% lived in this county.
Out of people who lived in different counties, 100.0% lived in New Jersey.
| Little Silver: | 94.9% |
| State average: | 90.4% |
Education attainment for males 25 years and older:
- No schooling: 23
- Nursery to 4th grade: 0
- 5th and 6th grade: 0
- 7th and 8th grade: 0
- 9th grade: 0
- 10th grade: 0
- 11th grade: 0
- 12th grade, no diploma: 0
- High school graduate (or equivalency): 118
- Less than 1 year of college: 19
- Some college more than 1 year, no degree: 116
- Associate degree: 49
- Bachelor's degree: 1,050
- Master's degree: 631
- Professional school degree: 165
- Doctorate degree: 16

Education attainment for females 25 years and older:
- No schooling: 0
- Nursery to 4th grade: 7
- 5th and 6th grade: 0
- 7th and 8th grade: 0
- 9th grade: 0
- 10th grade: 0
- 11th grade: 0
- 12th grade, no diploma: 15
- High school graduate (or equivalency): 215
- Less than 1 year of college: 34
- Some college more than 1 year, no degree: 187
- Associate degree: 126
- Bachelor's degree: 958
- Master's degree: 607
- Professional school degree: 75
- Doctorate degree: 29


Housing units in structures:
- One, detached: 1,993
- One, attached: 221
- 3 or 4: 20
- 5 to 9: 59
- Mobile homes: 56
House/condo owner moved in on average 9 years ago
Renter moved in on average 0 years ago

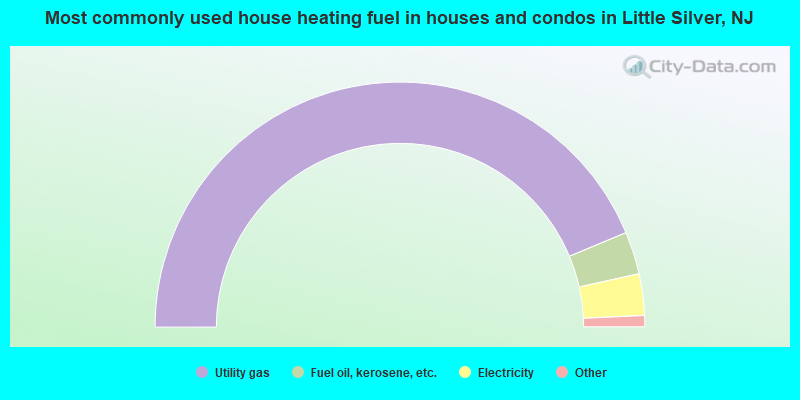
- 87.6%Utility gas
- 5.6%Fuel oil, kerosene, etc.
- 5.5%Electricity
- 0.8%Bottled, tank, or LP gas
- 0.6%Other fuel
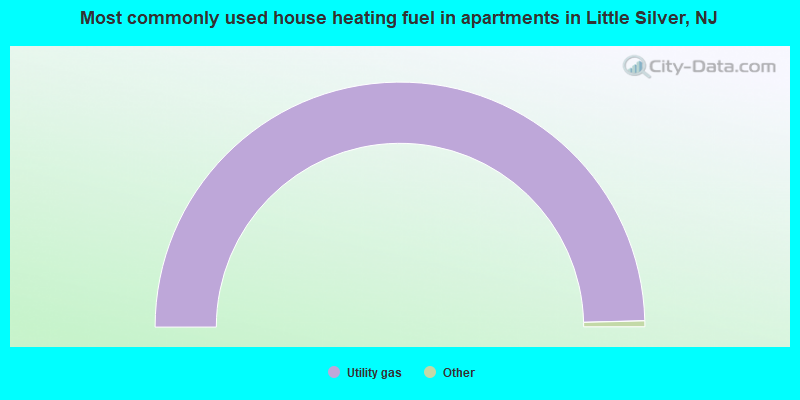
- 100.0%Utility gas
Private vs. public school enrollment:
| Here: | 9.6% |
| New Jersey: | 12.3% |
| Here: | 53.7% |
| New Jersey: | 13.1% |
| Here: | 42.6% |
| New Jersey: | 33.2% |


