Live Oak, CA (California) Houses and Residents
| Live Oak: | $958,372 |
| California: | $715,900 |
Mean price in 2022:
Detached houses: $1,418,963
Here: $1,418,963 State: $988,808 Townhouses or other attached units: $852,052
Here: $852,052 State: $838,546 In 2-unit structures: $505,596
Here: $505,596 State: $1,138,100 In 3-to-4-unit structures: $903,066
Here: $903,066 State: $824,253 In 5-or-more-unit structures: $493,475
Here: $493,475 State: $730,996 Mobile homes: $361,266
Here: $361,266 State: $184,506
Total population: 17,158 (Urban population: 16,499, Rural population: 0)
Houses: 6,748 (6,442 occupied: 3,851 owner occupied, 2,518 renter occupied)
| % of renters here: | 40% |
| State: | 44% |
Housing density: 2,087 houses/condos per square mile
Median price asked for vacant for-sale houses and condos in 2022: $822,751.
Median contract rent in 2022: over $2,000 (lower quartile is $1,280, upper quartile is over $2,000)
Median rent asked for vacant for-rent units in 2022: $4,829
Median gross rent in Live Oak, CA in 2022: over $2,000
Housing units in Live Oak with a mortgage: 2,416 (331 second mortgage, 0 home equity loan, 274 both second mortgage and home equity loan)
Houses without a mortgage: 35
Median household income for houses/condos with a mortgage: $139,722
Median household income for apartments without a mortgage: $83,827
Median monthly housing costs: $2,104
Compare current foreclosures near Live Oak, CA:
| Photo | Address | Area | Beds / Baths | Price | Details |
|---|---|---|---|---|---|

|
#1
Sebina Ct
Live Oak, CA 95953
|
1,264 sq. feet
|
2 baths 3 beds |
show details | |

|
#2
Fir St
Live Oak, CA 95953
|
- sq. feet
|
2 baths 3 beds |
show details | |

|
#3
Poplar Way
Live Oak, CA 95953
|
- sq. feet
|
3 baths 5 beds |
show details | |

|
#4
Kent Ave
Live Oak, CA 95953
|
- sq. feet
|
3 baths 4 beds |
show details | |

|
#5
Cannon Way
Live Oak, CA 95953
|
- sq. feet
|
2 baths 4 beds |
show details | |

|
#6
Fir St
Live Oak, CA 95953
|
- sq. feet
|
2 baths 3 beds |
show details | |

|
#7
Luther Rd
Live Oak, CA 95953
|
- sq. feet
|
- baths - beds |
show details | |

|
#8
Broadway Apt 10
Live Oak, CA 95953
|
- sq. feet
|
- baths - beds |
show details | |

|
#9
Orchard Way
Live Oak, CA 95953
|
- sq. feet
|
- baths - beds |
show details | |

|
#10
Paseo Rd
Live Oak, CA 95953
|
- sq. feet
|
- baths - beds |
show details |
| Photo | Address | Area | Beds / Baths | Price | Details |
|---|---|---|---|---|---|

|
#11
Oro Bangor Hwy
Oroville, CA 95966
|
1,304 sq. feet
|
2 baths 3 beds |
$218,900
|
show details |

|
#12
Claremont Dr
Oroville, CA 95966
|
2,031 sq. feet
|
2 baths 2 beds |
$459,000
|
show details |

|
#13
Nuestro Rd
Live Oak, CA 95953
|
- sq. feet
|
- baths - beds |
show details | |

|
#14
Elgin St
Oroville, CA 95966
|
1,092 sq. feet
|
1 baths 2 beds |
$66,680
|
show details |

|
#15
Johnson Ln
Gridley, CA 95948
|
700 sq. feet
|
1 baths 2 beds |
$19,080
|
show details |

|
#16
Roseben Ave
Oroville, CA 95966
|
1,760 sq. feet
|
1 baths 3 beds |
$28,557
|
show details |

|
#17
A St
Oroville, CA 95966
|
672 sq. feet
|
1 baths 2 beds |
$13,097
|
show details |

|
#18
Johnson Clan Ave
Gridley, CA 95948
|
3,331 sq. feet
|
4 baths 4 beds |
$13,559
|
show details |

|
#19
Tehama Ave
Oroville, CA 95965
|
892 sq. feet
|
1 baths 2 beds |
$31,831
|
show details |

|
#20
E 22nd St
Marysville, CA 95901
|
1,176 sq. feet
|
2 baths 3 beds |
show details |
| Photo | Address | Area | Beds / Baths | Price | Details |
|---|---|---|---|---|---|

|
#21
Turkey Hollow Trl
Browns Valley, CA 95918
|
2,117 sq. feet
|
2 baths 3 beds |
show details | |

|
#22
Lincoln Blvd
Oroville, CA 95966
|
1,110 sq. feet
|
2 baths 3 beds |
show details | |

|
#23
Feather Ave
Oroville, CA 95965
|
1,310 sq. feet
|
2 baths 3 beds |
show details | |

|
#24
Tehama Ave
Oroville, CA 95965
|
1,344 sq. feet
|
2 baths 3 beds |
show details | |

|
#25
Colusa Hwy
Yuba City, CA 95993
|
2,586 sq. feet
|
2 baths 4 beds |
show details | |

|
#26
Chestnut St
Yuba City, CA 95991
|
640 sq. feet
|
1 baths 2 beds |
show details | |

|
#27
Erle Rd
Marysville, CA 95901
|
1,224 sq. feet
|
1 baths 3 beds |
show details | |

|
#28
Dawn Dr
Marysville, CA 95901
|
3,661 sq. feet
|
2 baths 3 beds |
show details | |

|
#29
Bandy Way
Yuba City, CA 95991
|
752 sq. feet
|
1 baths 2 beds |
show details | |

|
#30
Norby Ct
Olivehurst, CA 95961
|
3,210 sq. feet
|
3 baths 5 beds |
show details |
| Photo | Address | Area | Beds / Baths | Price | Details |
|---|---|---|---|---|---|

|
#31
Norby Ct
Olivehurst, CA 95961
|
3,210 sq. feet
|
3 baths 5 beds |
show details | |

|
#32
Skinner Ave
Olivehurst, CA 95961
|
2,820 sq. feet
|
2 baths 4 beds |
show details | |

|
#33
Lincoln Blvd
Oroville, CA 95966
|
1,968 sq. feet
|
1 baths 2 beds |
show details | |

|
#34
Fruitland Rd
Marysville, CA 95901
|
1,504 sq. feet
|
2 baths 2 beds |
show details | |

|
#35
Crystal Ct
Olivehurst, CA 95961
|
1,915 sq. feet
|
2 baths 3 beds |
show details | |

|
#36
Marcos Ln
Marysville, CA 95901
|
1,352 sq. feet
|
2 baths 3 beds |
show details | |

|
#37
Acacia Way
Olivehurst, CA 95961
|
1,187 sq. feet
|
2 baths 4 beds |
show details | |

|
#38
Cricket Ln
Oroville, CA 95966
|
- sq. feet
|
- baths - beds |
$16,200
|
show details |

|
#39
D St
Biggs, CA 95917
|
- sq. feet
|
- baths - beds |
$31,892
|
show details |

|
#40
Waterhole Loop
Marysville, CA 95901
|
1,633 sq. feet
|
2 baths 3 beds |
show details |
| Photo | Address | Area | Beds / Baths | Price | Details |
|---|---|---|---|---|---|

|
#41
Boardwalk Dr
Marysville, CA 95901
|
2,276 sq. feet
|
2 baths 5 beds |
show details | |

|
#42
Ravine Ct
Marysville, CA 95901
|
1,870 sq. feet
|
2 baths 3 beds |
show details | |

|
#43
Karen Way
Olivehurst, CA 95961
|
1,092 sq. feet
|
1 baths 3 beds |
show details | |

|
#44
Grier Ave
Oroville, CA 95966
|
- sq. feet
|
- baths - beds |
$17,138
|
show details |

|
#45
Shela Ct
Oroville, CA 95966
|
- sq. feet
|
- baths - beds |
$55,412
|
show details |

|
#46
Tadpole Way
Marysville, CA 95901
|
1,859 sq. feet
|
2 baths 3 beds |
show details | |

|
#47
S Gledhill Ave
Olivehurst, CA 95961
|
1,338 sq. feet
|
1 baths 3 beds |
show details | |

|
#48
Grier Ave
Oroville, CA 95966
|
- sq. feet
|
- baths - beds |
$22,278
|
show details |

|
#49
Grubbs Rd
Oroville, CA 95966
|
- sq. feet
|
- baths - beds |
$4,402
|
show details |

|
Check over 1 million property listings on Foreclosure.com!
|
browse all offers | |||


 | California has a lot of pine trees (57 replies) |
| Temple city house on busy street vs Alhambra house? (2 replies) |
| Morgan Hill high school students sent home for Cinco de Mayo clothing choice (71 replies) |
| Arcadia vs. Monrovia vs. Azusa for 24 y/o professional? (8 replies) |
| Boston-Morgan Hill (11 replies) |
| need advice on moving to Santa Cruz (67 replies) |

Median year apartment built: 1973
Household type by relationship:
Households: 17,430- Male householders: 2,966 (640 living alone), Female householders: 3,334 (1,017 living alone)
2,766 spouses (2,717 opposite-sex spouses), 720 unmarried partners, (680 opposite-sex unmarried partners), 4,191 children (3,864 natural, 147 adopted, 179 stepchildren), 197 grandchildren, 477 brothers or sisters, 154 parents, 9 foster children, 457 other relatives, 1,341 non-relatives
- In group quarters: 812
Size of family households: 1,406 2-persons, 1,061 3-persons, 934 4-persons, 274 5-persons, 108 6-persons, 107 7-or-more-persons.
Size of nonfamily households: 1,676 1-person, 527 2-persons, 156 3-persons, 84 4-persons, 18 5-persons.
1,905 married couples with children.
764 single-parent households (191 men, 573 women).
72.1% of residents of Live Oak speak English at home.
20.3% of residents speak Spanish at home (63% speak English very well, 17% speak English well, 13% speak English not well, 7% don't speak English at all).
3.8% of residents speak other Indo-European language at home (64% speak English very well, 36% speak English well).
3.5% of residents speak Asian or Pacific Island language at home (47% speak English very well, 43% speak English well, 5% speak English not well, 5% don't speak English at all).
0.2% of residents speak other language at home (27% speak English very well, 51% speak English well, 22% speak English not well).
Foreign born population: 2,579 (14.8%)
(43.9% of them are naturalized citizens)
| Here: | 5.1 |
| State: | 6.0 |
| Here: | 4.0 |
| State: | 3.9 |

- Bedrooms in owner-occupied houses and condos in Live Oak, California
- 90no bedroom
- 1641 bedroom
- 1,0992 bedrooms
- 2,0073 bedrooms
- 3304 bedrooms
- 1615+ bedrooms

- Bedrooms in renter-occupied apartments in Live Oak, California
- 147no bedroom
- 4841 bedroom
- 1,0422 bedrooms
- 6523 bedrooms
- 1694 bedrooms
- 255+ bedrooms

- Cars and other vehicles available in Live Oak in owner-occupied houses/condos
- 62no vehicle
- 1,1201 vehicle
- 1,5782 vehicles
- 6493 vehicles
- 3314 vehicles
- 1105+ vehicles

- Cars and other vehicles available in Live Oak in renter-occupied apartments
- 320no vehicle
- 8401 vehicle
- 6942 vehicles
- 3663 vehicles
- 1934 vehicles
- 1055+ vehicles

- Rooms in owner-occupied houses in Live Oak, California
- 391 room
- 402 rooms
- 3103 rooms
- 9584 rooms
- 9505 rooms
- 7746 rooms
- 3737 rooms
- 2308 rooms
- 1769+ rooms

- Rooms in renter-occupied apartments in Live Oak, California
- 1371 room
- 1852 rooms
- 4473 rooms
- 7764 rooms
- 4065 rooms
- 4376 rooms
- 567 rooms
- 508 rooms
- 259+ rooms


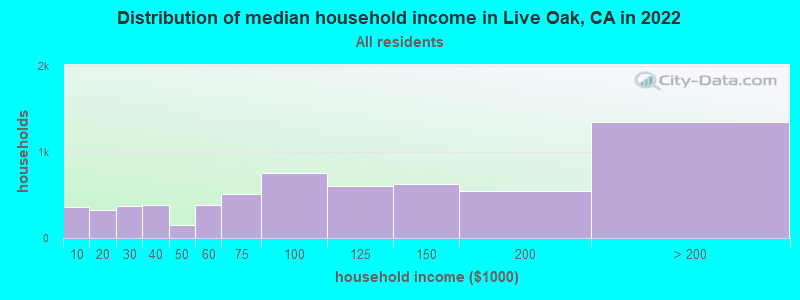
Live Oak, CA household income distribution

- 360Less than $10,000
- 321$10,000 to $19,999
- 372$20,000 to $29,999
- 380$30,000 to $39,999
- 156$40,000 to $49,999
- 379$50,000 to $59,999
- 511$60,000 to $74,999
- 761$75,000 to $99,999
- 605$100,000 to $124,999
- 624$125,000 to $149,999
- 550$150,000 to $199,999
- 1,351$200,000 or more
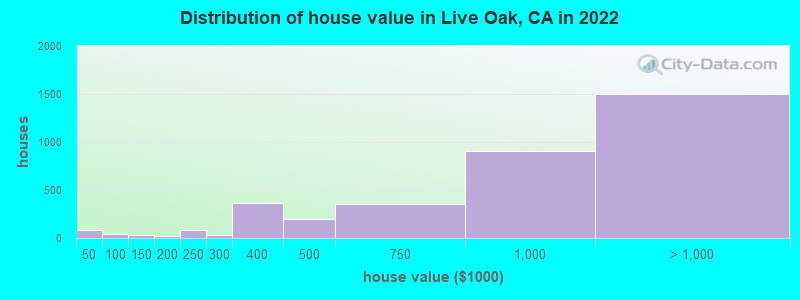
Home value of owner - occupied houses in 2022 in Live Oak, CA
-
- 31Less than $10,000
- 12$10,000 to $14,999
- 6$20,000 to $24,999
- 25$30,000 to $34,999
- 8$40,000 to $49,999
- 16$50,000 to $59,999
- 8$60,000 to $69,999
- 4$90,000 to $99,999
- 6$100,000 to $124,999
- 21$125,000 to $149,999
- 15$150,000 to $174,999
- 9$175,000 to $199,999
- 81$200,000 to $249,999
- 33$250,000 to $299,999
- 365$300,000 to $399,999
- 197$400,000 to $499,999
- 358$500,000 to $749,999
- 906$750,000 to $999,999
- 1,075$1,000,000 to $1,499,999
- 220$1,500,000 to $1,999,999
- 207$2,000,000 or more
Rent paid by renters in 2022 in Live Oak, CA
-
- 104Less than $100
- 28$150 to $199
- 47$200 to $249
- 75$250 to $299
- 61$300 to $349
- 37$400 to $449
- 6$450 to $499
- 91$500 to $549
- 34$600 to $649
- 8$650 to $699
- 10$700 to $749
- 45$800 to $899
- 5$900 to $999
- 84$1,000 to $1,249
- 240$1,250 to $1,499
- 338$1,500 to $1,999
- 302$2,000 to $2,499
- 485$2,500 to $2,999
- 236$3,000 to $3,499
- 346$3,500 or more
- 58No cash rent


Percentage of workers working in this county: 87.2%
Number of people working at home: 1,662 (18.9% of all workers)
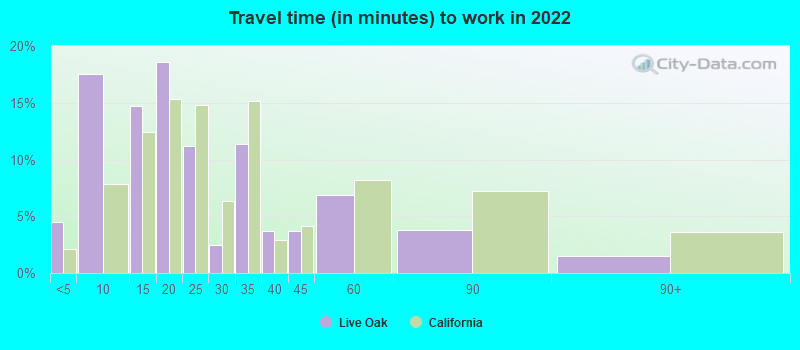
Travel time to work (commute)
- Less than 5 minutes: 123
- 5 to 9 minutes: 874
- 10 to 14 minutes: 1,242
- 15 to 19 minutes: 1,673
- 20 to 24 minutes: 938
- 25 to 29 minutes: 199
- 30 to 34 minutes: 495
- 35 to 39 minutes: 228
- 40 to 44 minutes: 228
- 45 to 59 minutes: 699
- 60 to 89 minutes: 307
- 90 or more minutes: 109
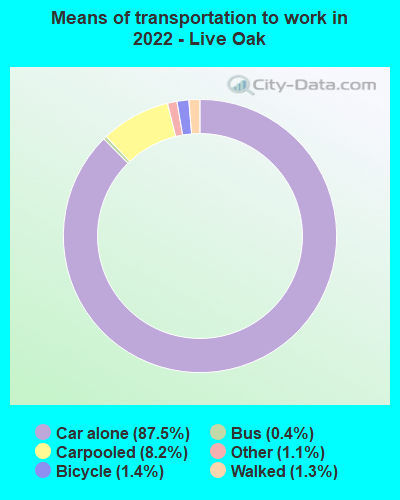
Means of transportation to work:
- Drove a car alone: 5,085 (66.7%)
- Carpooled: 530 (7.0%)
- Bus: 35 (0.5%)
- Taxi: 72 (0.9%)
- Bicycle: 93 (1.2%)
- Walked: 76 (1.0%)
- Worked at home: 1,662 (21.8%)

- Unemployment by race in 2022
- Unemployment rate for White non-Hispanic residents
- 3.6%Males
- 4.7%Females
- Unemployment rate for Asian residents
- 8.2%Males
- Unemployment rate for other race residents
- 1.2%Males
- 6.5%Females
- Unemployment rate for two or more race residents
- 2.7%Males
- 3.8%Females
- Unemployment rate for Hispanic or Latino residents
- 4.7%Males
- 3.5%Females

- Year of entry for the foreign-born population in Live Oak, California
- 6532010 or later
- 8512000 to 2009
- 4581990 to 1999
- 8821980 to 1989
- 3501970 to 1979
- 468Before 1970

First ancestries reported:
- English: 509 (6.7%)
- German: 495 (6.5%)
- Italian: 381 (5.0%)
- Irish: 306 (4.0%)
- American: 284 (3.8%)
- European: 202 (2.7%)
- Iranian: 157 (2.1%)
- Scottish: 152 (2.0%)
- Norwegian: 103 (1.4%)
- Scotch-Irish: 81 (1.1%)
- Scandinavian: 79 (1.0%)
- French: 70 (0.9%)
- British: 52 (0.7%)
- Polish: 51 (0.7%)
- Portuguese: 42 (0.6%)
- Canadian: 39 (0.5%)
- Ukrainian: 38 (0.5%)
- Syrian: 31 (0.4%)
- Russian: 31 (0.4%)
- Kenyan: 31 (0.4%)
- Eastern European: 30 (0.4%)
- Danish: 28 (0.4%)
- Czech: 26 (0.3%)
- French Canadian: 24 (0.3%)
- Swedish: 20 (0.3%)
- Northern European: 15 (0.2%)
- Hungarian: 13 (0.2%)
- Ethiopian: 10 (0.1%)
- Brazilian: 9 (0.1%)
- Romanian: 9 (0.1%)
- Trinidadian and Tobagonian: 9 (0.1%)
- Dutch: 8 (0.1%)
- Egyptian: 8 (0.1%)
- Greek: 7 (0.09%)
- Turkish: 7 (0.09%)
- Armenian: 6 (0.08%)
- Finnish: 5 (0.07%)
Most common places of birth for foreign-born residents (%):
| Live Oak: | 38.5% (969) |
| California: | 37.2% (3,881,193) |
| Live Oak: | 8.7% (218) |
| California: | 4.2% (440,287) |
| Live Oak: | 6.0% (152) |
| California: | 0.7% (73,304) |
| Live Oak: | 5.6% (142) |
| California: | 6.6% (684,672) |
| Live Oak: | 5.4% (136) |
| California: | 2.0% (206,004) |
| Live Oak: | 3.8% (95) |
| California: | 0.2% (18,925) |
| Live Oak: | 3.5% (87) |
| California: | 0.6% (65,335) |
| Live Oak: | 3.2% (81) |
| California: | 7.8% (818,297) |
| Live Oak: | 2.9% (72) |
| California: | 4.9% (512,335) |
| Live Oak: | 2.1% (53) |
| California: | 1.2% (127,477) |
| Live Oak: | 1.7% (42) |
| California: | 0.3% (31,439) |
| Live Oak: | 1.6% (40) |
| California: | 0.7% (74,025) |
Place of birth for U.S.-born residents:
- This state: 11,614
- Other state: 3,001
- Northeast: 982
- Midwest: 725
- South: 596
- West: 708
84.4% of Live Oak residents lived in the same house 1 years ago.
Out of people who lived in different houses, 30.7% lived in this county.
Out of people who lived in different counties, 86.4% lived in California.
| Live Oak: | 84.4% |
| State average: | 88.9% |
Education attainment for males 25 years and older:
- No schooling: 186
- Nursery to 4th grade: 19
- 5th and 6th grade: 50
- 7th and 8th grade: 11
- 9th grade: 78
- 10th grade: 48
- 11th grade: 49
- 12th grade, no diploma: 223
- High school graduate (or equivalency): 1,194
- Less than 1 year of college: 445
- Some college more than 1 year, no degree: 1,163
- Associate degree: 510
- Bachelor's degree: 1,636
- Master's degree: 420
- Professional school degree: 84
- Doctorate degree: 124

Education attainment for females 25 years and older:
- No schooling: 83
- Nursery to 4th grade: 64
- 5th and 6th grade: 34
- 7th and 8th grade: 49
- 9th grade: 96
- 10th grade: 5
- 11th grade: 63
- 12th grade, no diploma: 139
- High school graduate (or equivalency): 909
- Less than 1 year of college: 402
- Some college more than 1 year, no degree: 913
- Associate degree: 529
- Bachelor's degree: 1,711
- Master's degree: 917
- Professional school degree: 246
- Doctorate degree: 82


Housing units in structures:
- One, detached: 3,445
- One, attached: 763
- Two: 258
- 3 or 4: 449
- 5 to 9: 96
- 10 to 19: 299
- 20 to 49: 226
- 50 or more: 317
- Mobile homes: 890
Median worth of mobile homes: $389,893
Housing units lacking complete kitchen facilities in 2022: 2.5%
House/condo owner moved in on average 9 years ago
Renter moved in on average 3 years ago

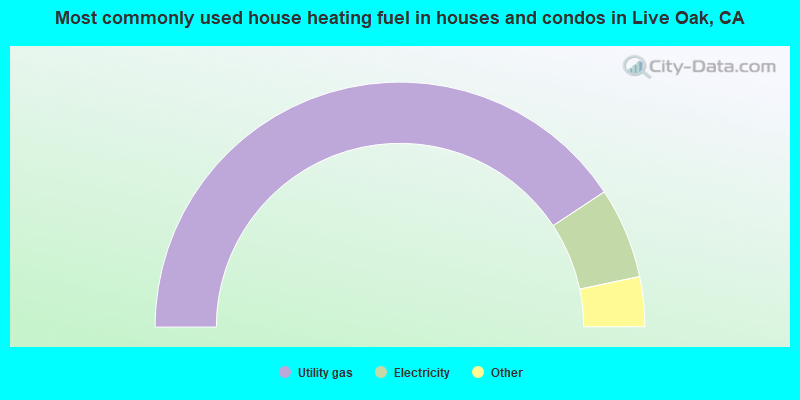
- 81.4%Utility gas
- 12.0%Electricity
- 2.7%Bottled, tank, or LP gas
- 1.3%No fuel used
- 1.0%Wood
- 0.9%Fuel oil, kerosene, etc.
- 0.4%Solar energy
- 0.3%Other fuel
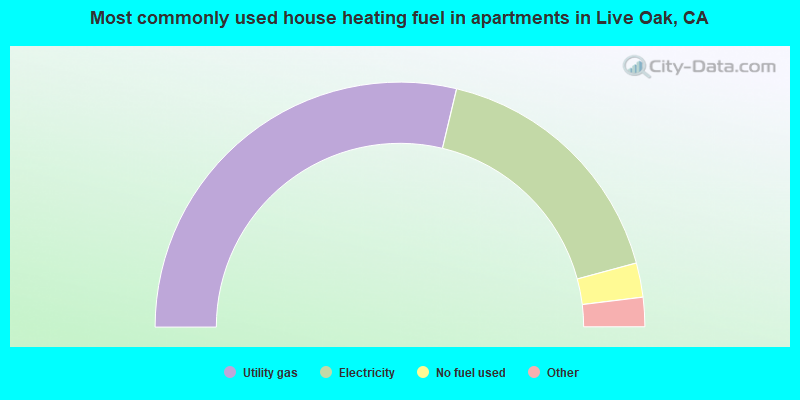
- 57.5%Utility gas
- 34.2%Electricity
- 4.5%No fuel used
- 2.7%Bottled, tank, or LP gas
- 0.8%Wood
- 0.3%Solar energy
Private vs. public school enrollment:
| Here: | 8.5% |
| California: | 10.5% |
| Here: | 3.4% |
| California: | 8.5% |
| Here: | 13.7% |
| California: | 15.9% |


