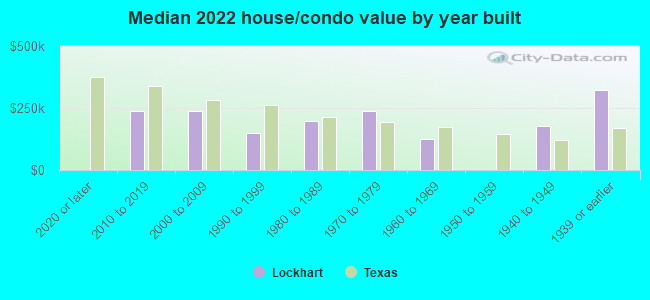
Lockhart, TX (Texas) Houses and Residents
| Lockhart: | $225,527 |
| Texas: | $275,400 |
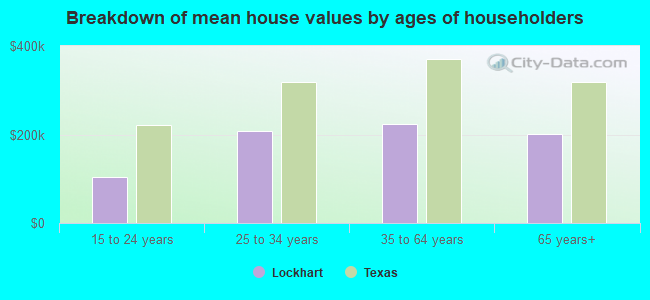
Mean price in 2022:
Detached houses: $232,803
Here: $232,803 State: $369,058 Townhouses or other attached units: $95,764
Here: $95,764 State: $327,631 Mobile homes: $45,379
Here: $45,379 State: $124,413
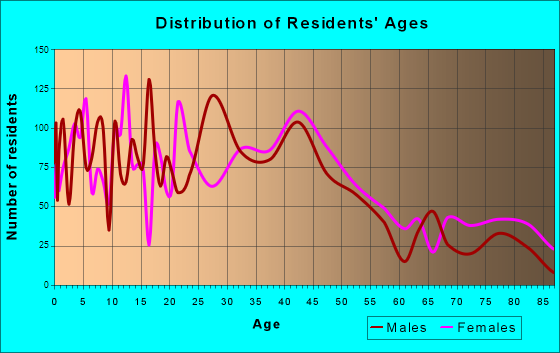
Total population: 13,232 (Urban population: 10,578 (all inside urban clusters), Rural population: 837 (all nonfarm))
Houses: 5,467 (4,901 occupied: 3,066 owner occupied, 1,908 renter occupied)
| % of renters here: | 38% |
| State: | 38% |
Housing density: 486 houses/condos per square mile
Median price asked for vacant for-sale houses and condos in 2022: $571,061.
Median contract rent in 2022: $976 (lower quartile is $736, upper quartile is $1,232)
Median rent asked for vacant for-rent units in 2022: $1,168
Median gross rent in Lockhart, TX in 2022: $1,156
Housing units in Lockhart with a mortgage: 1,502 (93 second mortgage, 9 home equity loan, 61 both second mortgage and home equity loan)
Houses without a mortgage: 39
Median household income for houses/condos with a mortgage: $87,098
Median household income for apartments without a mortgage: $68,363
Median monthly housing costs: $1,079
Compare current foreclosures near Lockhart, TX:
| Photo | Address | Area | Beds / Baths | Price | Details |
|---|---|---|---|---|---|

|
#1
E Live Oak St
Lockhart, TX 78644
|
- sq. feet
|
- baths - beds |
show details | |

|
#2
State Park Rd # 21
Lockhart, TX 78644
|
- sq. feet
|
- baths - beds |
show details | |

|
#3
Dobins Ct
Lockhart, TX 78644
|
- sq. feet
|
- baths - beds |
show details | |

|
#4
Wedgewood Trl
Lockhart, TX 78644
|
- sq. feet
|
- baths - beds |
show details | |

|
#5
Challenger
Kyle, TX 78640
|
1,002 sq. feet
|
1 baths 2 beds |
show details | |

|
#6
Stone Rim Loop
Buda, TX 78610
|
2,215 sq. feet
|
3 baths 4 beds |
show details | |

|
#7
Bridgestone Way
Buda, TX 78610
|
- sq. feet
|
2 baths 3 beds |
show details | |

|
#8
Rough Bark Street
Buda, TX 78610
|
- sq. feet
|
3 baths 4 beds |
show details | |

|
#9
Fm 2984
Luling, TX 78648
|
1,116 sq. feet
|
1 baths 3 beds |
show details | |

|
#10
Cinkapin Dr
San Marcos, TX 78666
|
2,868 sq. feet
|
3 baths 3 beds |
show details |
| Photo | Address | Area | Beds / Baths | Price | Details |
|---|---|---|---|---|---|

|
#11
Frasier Dr
San Marcos, TX 78666
|
- sq. feet
|
2 baths 3 beds |
show details | |

|
#12
Fairfield Dr
Kyle, TX 78640
|
2,318 sq. feet
|
3 baths 3 beds |
show details | |

|
#13
Banff Drive
Kyle, TX 78640
|
1,322 sq. feet
|
2 baths 3 beds |
show details | |

|
#14
Marquitos Dr
Kyle, TX 78640
|
- sq. feet
|
2 baths 3 beds |
show details | |

|
#15
W Austin St
Luling, TX 78648
|
1,310 sq. feet
|
2 baths 3 beds |
show details | |

|
#16
Twisted Oaks Lane
Buda, TX 78610
|
1,688 sq. feet
|
- baths - beds |
show details | |

|
#17
Brandons Way
Buda, TX 78610
|
2,850 sq. feet
|
- baths - beds |
show details | |

|
#18
Brian Ln
Kyle, TX 78640
|
2,662 sq. feet
|
2 baths - beds |
show details | |

|
#19
Rodriguez Rd # A
Austin, TX 78747
|
3,350 sq. feet
|
2 baths - beds |
show details | |

|
#20
Brandi Cir
Kyle, TX 78640
|
1,051 sq. feet
|
2 baths - beds |
show details |
| Photo | Address | Area | Beds / Baths | Price | Details |
|---|---|---|---|---|---|

|
#21
Bogart Dr
Kyle, TX 78640
|
- sq. feet
|
- baths - beds |
show details | |

|
#22
Fm 1978
San Marcos, TX 78666
|
- sq. feet
|
- baths - beds |
show details | |

|
#23
Verna Brooks Way
Kyle, TX 78640
|
- sq. feet
|
- baths - beds |
show details | |

|
#24
Cibolo Creek Dr
Kyle, TX 78640
|
- sq. feet
|
- baths - beds |
show details | |

|
#25
Crystal River Rd
Kyle, TX 78640
|
- sq. feet
|
- baths - beds |
show details | |

|
#26
W Hays St
Kyle, TX 78640
|
- sq. feet
|
- baths - beds |
show details | |

|
#27
Marketplace Ave, Apt 312
Kyle, TX 78640
|
- sq. feet
|
- baths - beds |
show details | |

|
#28
Marketplace Ave, Apt 361
Kyle, TX 78640
|
- sq. feet
|
- baths - beds |
show details | |

|
#29
S Interstate 35
Buda, TX 78610
|
- sq. feet
|
- baths - beds |
show details | |

|
#30
Coleto Creek Loop
Kyle, TX 78640
|
- sq. feet
|
- baths - beds |
show details |
| Photo | Address | Area | Beds / Baths | Price | Details |
|---|---|---|---|---|---|

|
#31
Wapiti Rd
Buda, TX 78610
|
- sq. feet
|
- baths - beds |
show details | |

|
#32
Collared Dove Cv
Kyle, TX 78640
|
- sq. feet
|
- baths - beds |
show details | |

|
#33
Old Martindale Rd # 1601
San Marcos, TX 78666
|
- sq. feet
|
- baths - beds |
show details | |

|
#34
Cromwell Dr Apt 1308
Kyle, TX 78640
|
- sq. feet
|
- baths - beds |
show details | |

|
#35
Green Meadows Ln
Buda, TX 78610
|
1,506 sq. feet
|
- baths - beds |
show details | |

|
#36
N Interstate 35 Apt 16c
San Marcos, TX 78666
|
- sq. feet
|
- baths - beds |
show details | |

|
#37
Magnolia St
San Marcos, TX 78666
|
1,106 sq. feet
|
- baths - beds |
show details | |

|
#38
Las Cruces St
Buda, TX 78610
|
1,328 sq. feet
|
- baths - beds |
show details | |

|
#39
San Marcos Pkwy # 1105d
San Marcos, TX 78666
|
- sq. feet
|
- baths - beds |
show details | |

|
#40
Las Estancias Dr
Cedar Creek, TX 78612
|
- sq. feet
|
- baths - beds |
show details |
| Photo | Address | Area | Beds / Baths | Price | Details |
|---|---|---|---|---|---|

|
#41
S Loop 4, Bldg 1
Buda, TX 78610
|
- sq. feet
|
- baths - beds |
show details | |

|
#42
Shirley Dr
Buda, TX 78610
|
- sq. feet
|
- baths - beds |
show details | |

|
#43
Rikardson, Unit 88
Kyle, TX 78640
|
- sq. feet
|
- baths - beds |
show details | |

|
#44
Eileens Way
Dale, TX 78616
|
- sq. feet
|
- baths - beds |
show details | |

|
#45
Cromwell Dr, Apt 1312
Kyle, TX 78640
|
- sq. feet
|
- baths - beds |
show details | |

|
#46
Harwell Loop
Kyle, TX 78640
|
- sq. feet
|
- baths - beds |
show details | |

|
#47
Fergus
Kyle, TX 78640
|
2,620 sq. feet
|
- baths - beds |
show details | |

|
#48
Farm To Market Road
Dale, TX 78616
|
- sq. feet
|
- baths - beds |
show details | |

|
#49
Algaroba Loop
Buda, TX 78610
|
- sq. feet
|
- baths - beds |
show details | |

|
Check over 1 million property listings on Foreclosure.com!
|
browse all offers | |||

Latest news about housing in Lockhart, TX collected exclusively by city-data.com from local newspapers, TV, and radio stations

 | Retired, Homeschooling liberal mom looking for a place to buy (9 replies) |
| Why Acres Homes escapes gentrification (146 replies) |
| Need some advice on rent homes. (16 replies) |
| Austin on track to be the least affordable metro for homebuyers outside of CA (29 replies) |
| Tesla neighborhood to offer more affordable housing (29 replies) |
| Single family home versus higher density housing (156 replies) |
Median year apartment built: 1984
Household type by relationship:
Households: 14,851- Male householders: 1,750 (510 living alone), Female householders: 3,082 (788 living alone)
2,405 spouses (2,399 opposite-sex spouses), 292 unmarried partners, (260 opposite-sex unmarried partners), 3,759 children (3,450 natural, 166 adopted, 142 stepchildren), 753 grandchildren, 245 brothers or sisters, 171 parents, 0 foster children, 309 other relatives, 378 non-relatives
- In group quarters: 1,701
Size of family households: 1,539 2-persons, 749 3-persons, 361 4-persons, 304 5-persons, 192 6-persons, 199 7-or-more-persons.
Size of nonfamily households: 1,368 1-person, 278 2-persons.
1,718 married couples with children.
736 single-parent households (87 men, 649 women).
72.7% of residents of Lockhart speak English at home.
26.5% of residents speak Spanish at home (68% speak English very well, 22% speak English well, 9% speak English not well, 2% don't speak English at all).
0.1% of residents speak other Indo-European language at home (100% speak English very well).
0.4% of residents speak Asian or Pacific Island language at home (100% speak English very well).
0.4% of residents speak other language at home (90% speak English very well, 10% speak English well).
Foreign born population: 702 (4.7%)
(40.3% of them are naturalized citizens)
| Here: | 5.5 |
| State: | 6.3 |
| Here: | 4.5 |
| State: | 4.0 |
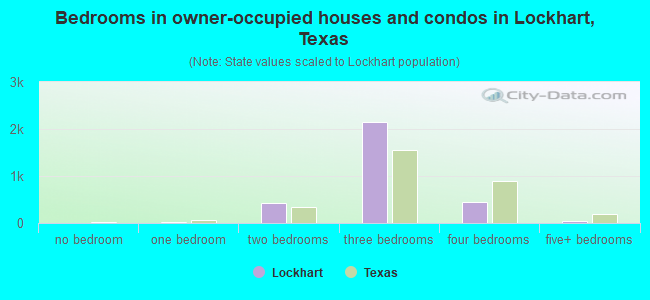
- Bedrooms in owner-occupied houses and condos in Lockhart, Texas
- 0no bedroom
- 161 bedroom
- 4302 bedrooms
- 2,1443 bedrooms
- 4434 bedrooms
- 335+ bedrooms
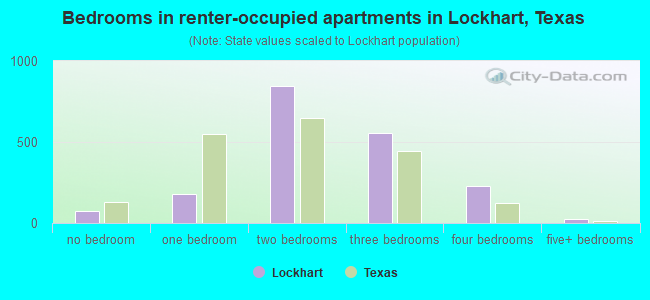
- Bedrooms in renter-occupied apartments in Lockhart, Texas
- 73no bedroom
- 1801 bedroom
- 8442 bedrooms
- 5563 bedrooms
- 2314 bedrooms
- 245+ bedrooms
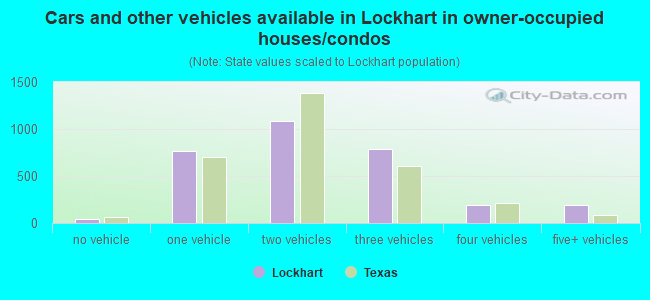
- Cars and other vehicles available in Lockhart in owner-occupied houses/condos
- 41no vehicle
- 7671 vehicle
- 1,0892 vehicles
- 7863 vehicles
- 1964 vehicles
- 1875+ vehicles
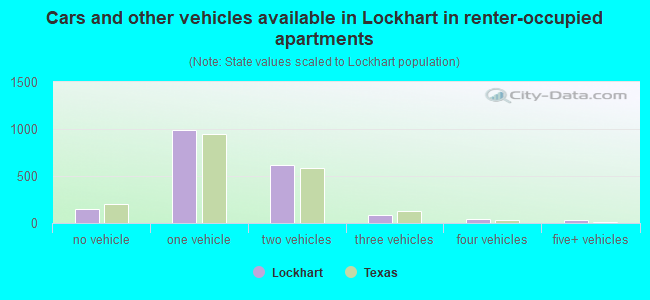
- Cars and other vehicles available in Lockhart in renter-occupied apartments
- 153no vehicle
- 9861 vehicle
- 6212 vehicles
- 813 vehicles
- 394 vehicles
- 275+ vehicles
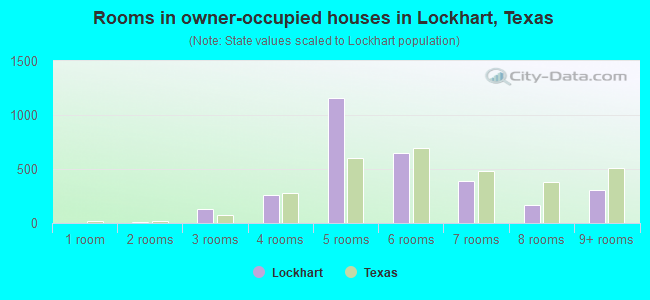
- Rooms in owner-occupied houses in Lockhart, Texas
- 01 room
- 102 rooms
- 1313 rooms
- 2604 rooms
- 1,1545 rooms
- 6506 rooms
- 3887 rooms
- 1678 rooms
- 3079+ rooms
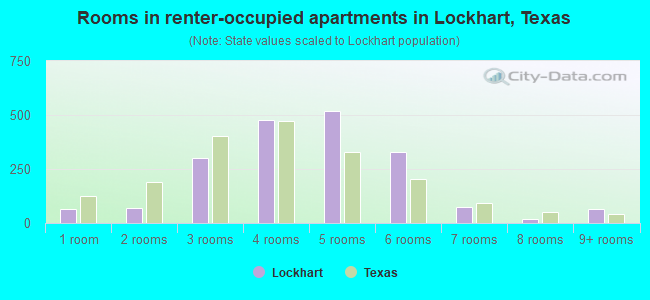
- Rooms in renter-occupied apartments in Lockhart, Texas
- 631 room
- 712 rooms
- 2993 rooms
- 4794 rooms
- 5175 rooms
- 3286 rooms
- 727 rooms
- 178 rooms
- 639+ rooms
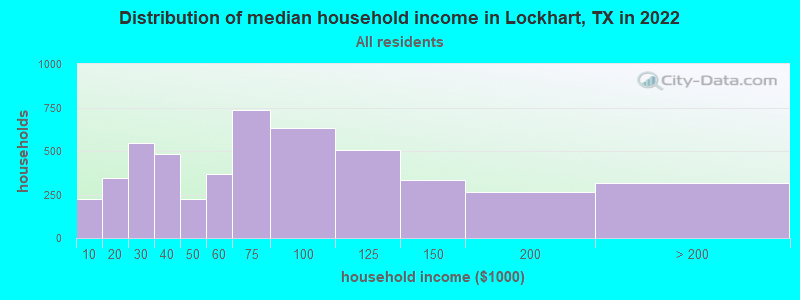
Lockhart, TX household income distribution

- 224Less than $10,000
- 345$10,000 to $19,999
- 547$20,000 to $29,999
- 483$30,000 to $39,999
- 227$40,000 to $49,999
- 367$50,000 to $59,999
- 735$60,000 to $74,999
- 631$75,000 to $99,999
- 508$100,000 to $124,999
- 331$125,000 to $149,999
- 263$150,000 to $199,999
- 317$200,000 or more
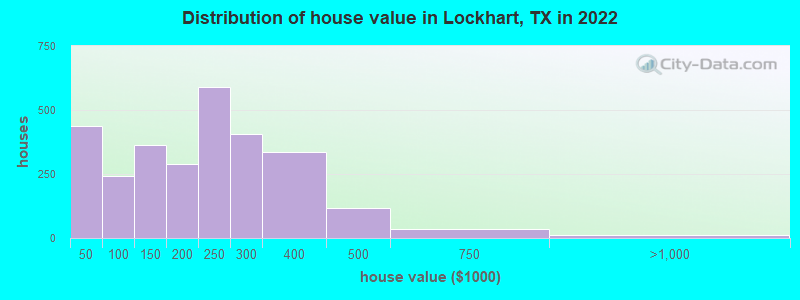
Home value of owner - occupied houses in 2022 in Lockhart, TX
-
- 155Less than $10,000
- 29$10,000 to $14,999
- 74$15,000 to $19,999
- 75$20,000 to $24,999
- 74$25,000 to $29,999
- 26$30,000 to $34,999
- 75$50,000 to $59,999
- 86$60,000 to $69,999
- 9$70,000 to $79,999
- 41$80,000 to $89,999
- 31$90,000 to $99,999
- 174$100,000 to $124,999
- 190$125,000 to $149,999
- 135$150,000 to $174,999
- 152$175,000 to $199,999
- 588$200,000 to $249,999
- 406$250,000 to $299,999
- 336$300,000 to $399,999
- 118$400,000 to $499,999
- 34$500,000 to $749,999
- 10$750,000 to $999,999
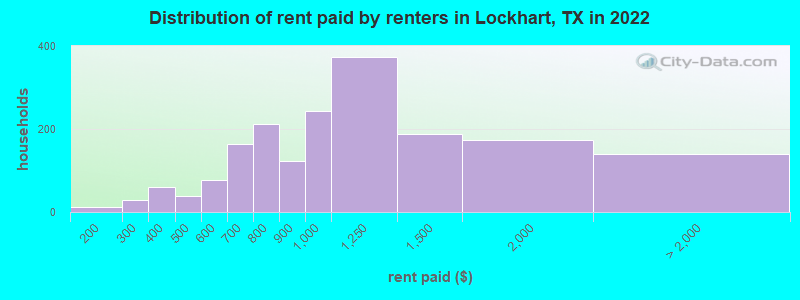
Rent paid by renters in 2022 in Lockhart, TX
-
- 10$150 to $199
- 29$200 to $249
- 13$300 to $349
- 46$350 to $399
- 38$450 to $499
- 38$500 to $549
- 39$550 to $599
- 59$600 to $649
- 103$650 to $699
- 58$700 to $749
- 153$750 to $799
- 123$800 to $899
- 243$900 to $999
- 373$1,000 to $1,249
- 186$1,250 to $1,499
- 172$1,500 to $1,999
- 139No cash rent
Percentage of workers working in this county: 47.3%
Number of people working at home: 569 (8.6% of all workers)
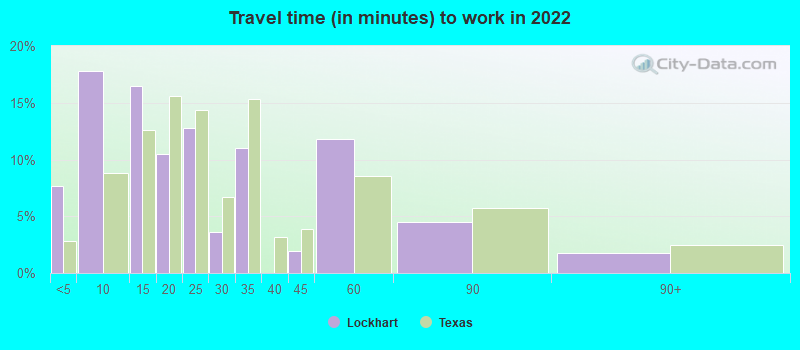
Travel time to work (commute)
- Less than 5 minutes: 380
- 5 to 9 minutes: 861
- 10 to 14 minutes: 642
- 15 to 19 minutes: 318
- 20 to 24 minutes: 342
- 25 to 29 minutes: 266
- 30 to 34 minutes: 725
- 35 to 39 minutes: 201
- 40 to 44 minutes: 445
- 45 to 59 minutes: 891
- 60 to 89 minutes: 593
- 90 or more minutes: 254
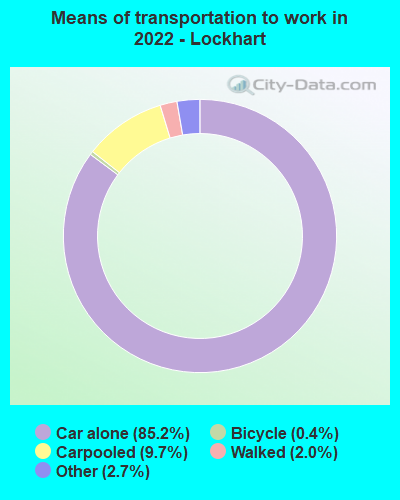
Means of transportation to work:
- Drove a car alone: 4,034 (74.3%)
- Carpooled: 497 (9.2%)
- Taxi: 160 (2.9%)
- Bicycle: 20 (0.4%)
- Walked: 99 (1.8%)
- Worked at home: 569 (10.5%)

- Unemployment by race in 2022
- Unemployment rate for White non-Hispanic residents
- 0.8%Males
- 1.3%Females
- Unemployment rate for Hispanic or Latino residents
- 2.1%Males
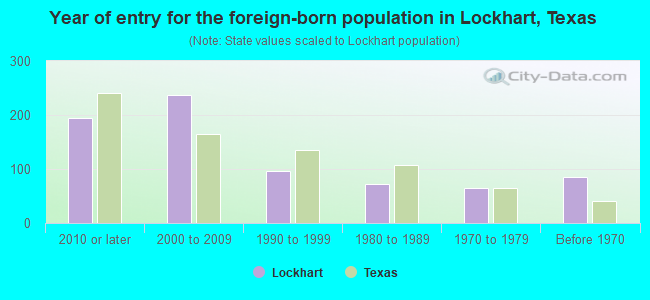
- Year of entry for the foreign-born population in Lockhart, Texas
- 1952010 or later
- 2372000 to 2009
- 961990 to 1999
- 731980 to 1989
- 651970 to 1979
- 85Before 1970
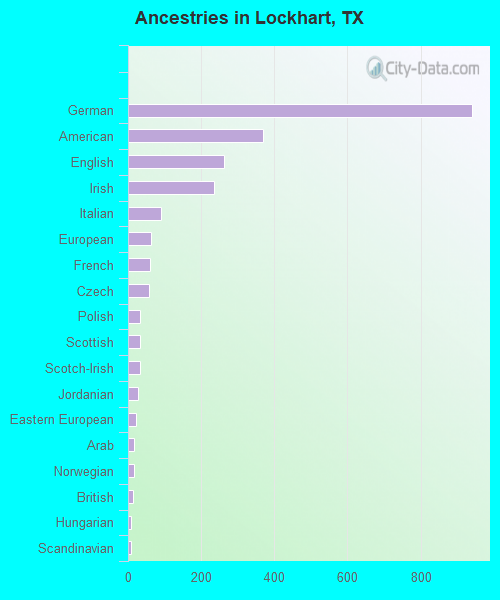
First ancestries reported:
- German: 940 (10.0%)
- American: 368 (3.9%)
- English: 262 (2.8%)
- Irish: 235 (2.5%)
- Italian: 91 (1.0%)
- European: 62 (0.7%)
- French: 61 (0.6%)
- Czech: 57 (0.6%)
- Polish: 34 (0.4%)
- Scottish: 33 (0.4%)
- Scotch-Irish: 32 (0.3%)
- Jordanian: 28 (0.3%)
- Eastern European: 21 (0.2%)
- Arab: 17 (0.2%)
- Norwegian: 16 (0.2%)
- British: 15 (0.2%)
- Hungarian: 9 (0.10%)
- Scandinavian: 9 (0.10%)
- Dutch: 7 (0.07%)
- Finnish: 7 (0.07%)
- African: 6 (0.06%)
- Welsh: 6 (0.06%)
- Pennsylvania German: 4 (0.04%)
- Portuguese: 1 (0.01%)
Most common places of birth for foreign-born residents (%):
| Lockhart: | 70.1% (492) |
| Texas: | 48.4% (2,411,723) |
| Lockhart: | 5.1% (36) |
| Texas: | 2.3% (115,558) |
| Lockhart: | 5.0% (35) |
| Texas: | 2.1% (103,148) |
| Lockhart: | 3.7% (26) |
| Texas: | 0.2% (9,141) |
| Lockhart: | 3.7% (26) |
| Texas: | 0.2% (8,922) |
| Lockhart: | 2.0% (14) |
| Texas: | 1.2% (61,555) |
| Lockhart: | 1.9% (13) |
| Texas: | 0.8% (37,989) |
Place of birth for U.S.-born residents:
- This state: 11,454
- Other state: 2,154
- Northeast: 311
- Midwest: 731
- South: 667
- West: 436
86.6% of Lockhart residents lived in the same house 1 years ago.
Out of people who lived in different houses, 27.3% lived in this county.
Out of people who lived in different counties, 85.2% lived in Texas.
| Lockhart: | 86.6% |
| State average: | 85.7% |
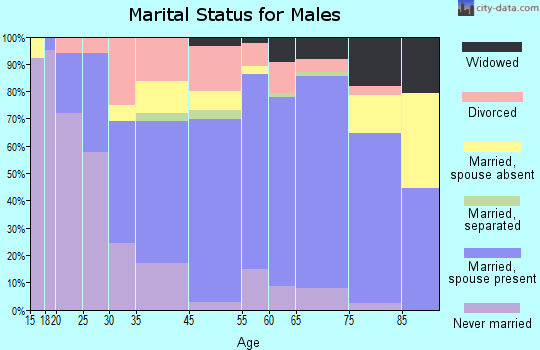
Education attainment for males 25 years and older:
- No schooling: 93
- Nursery to 4th grade: 5
- 5th and 6th grade: 15
- 7th and 8th grade: 50
- 9th grade: 85
- 10th grade: 283
- 11th grade: 81
- 12th grade, no diploma: 45
- High school graduate (or equivalency): 1,956
- Less than 1 year of college: 349
- Some college more than 1 year, no degree: 643
- Associate degree: 248
- Bachelor's degree: 520
- Master's degree: 157
- Professional school degree: 28
- Doctorate degree: 64

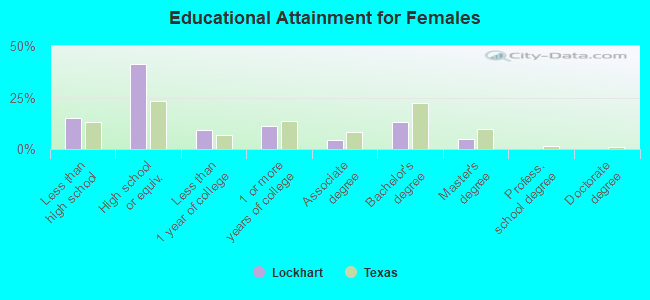
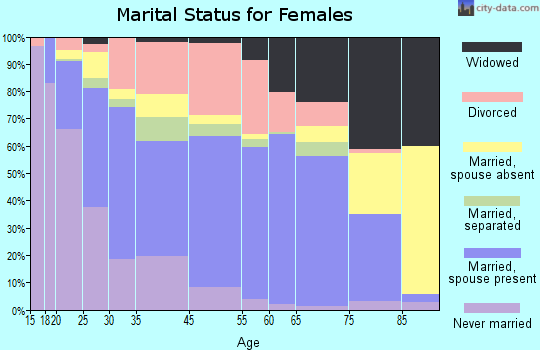
Education attainment for females 25 years and older:
- No schooling: 50
- Nursery to 4th grade: 54
- 5th and 6th grade: 62
- 7th and 8th grade: 110
- 9th grade: 53
- 10th grade: 204
- 11th grade: 258
- 12th grade, no diploma: 97
- High school graduate (or equivalency): 2,394
- Less than 1 year of college: 548
- Some college more than 1 year, no degree: 656
- Associate degree: 263
- Bachelor's degree: 760
- Master's degree: 296
- Professional school degree: 12
- Doctorate degree: 0
Housing units in structures:
- One, detached: 3,828
- One, attached: 109
- Two: 401
- 3 or 4: 240
- 5 to 9: 221
- 10 to 19: 91
- 20 to 49: 187
- 50 or more: 68
- Mobile homes: 317
Median worth of mobile homes: $24,602
Housing units lacking complete kitchen facilities in 2022: 7.1%
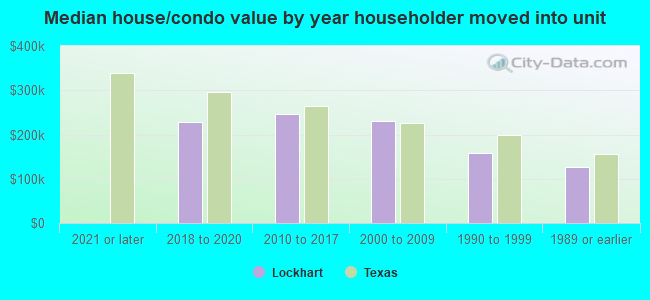
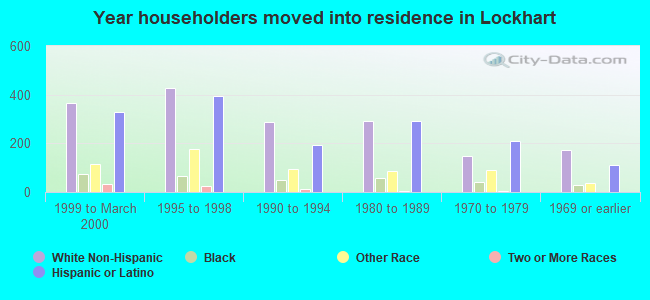
House/condo owner moved in on average 15 years ago
Renter moved in on average 4 years ago
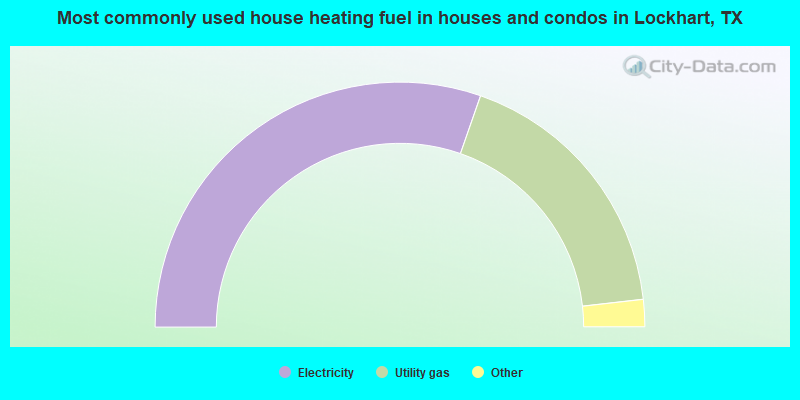
- 60.7%Electricity
- 35.7%Utility gas
- 3.0%Bottled, tank, or LP gas
- 0.6%No fuel used
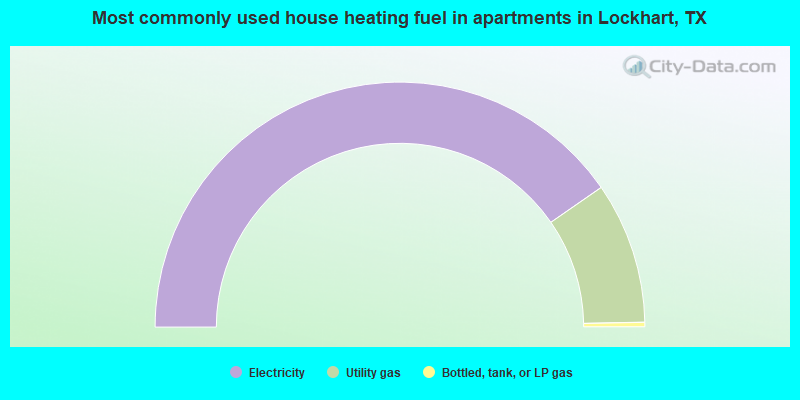
- 80.7%Electricity
- 18.7%Utility gas
- 0.6%Bottled, tank, or LP gas
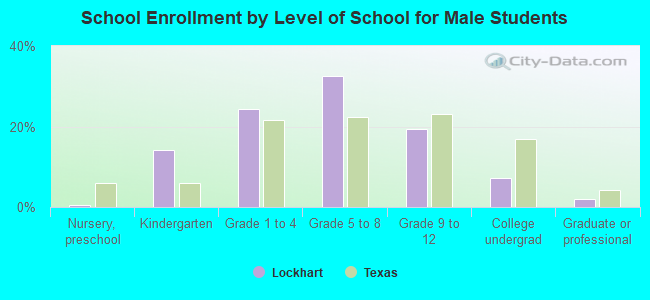
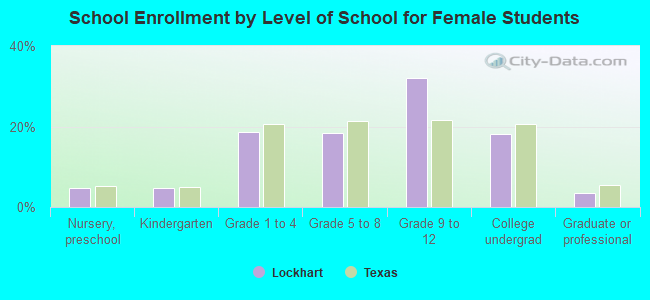
Private vs. public school enrollment:
| Here: | 5.9% |
| Texas: | 8.8% |
| Here: | 4.7% |
| Texas: | 8.0% |
| Here: | 15.6% |
| Texas: | 16.2% |