Lockport, NY (New York) Houses and Residents
Estimated median house or condo value in 2022: $142,112 (it was $69,300 in 2000 )
Lockport:
$142,112New York:
$400,400
Lower value quartile - upper value quartile: $100,168 - $188,819Mean price in 2022: Detached houses: $147,732 Here:
$147,732State:
$476,719
Townhouses or other attached units: $239,417 Here:
$239,417State:
$699,270
In 2-unit structures: $268,374 Here:
$268,374State:
$713,077
In 3-to-4-unit structures: $550,766 Here:
$550,766State:
$764,568
In 5-or-more-unit structures: $1,083,663 Here:
$1,083,663State:
$912,009
Total population: 20,743 (All urban)
Houses: 10,281 (9,245 occupied: 5,348 owner occupied, 4,177 renter occupied )
% of renters here:
44%State:
46%
Housing density: 1,206 houses/condos per square mile
Median price asked for vacant for-sale houses and condos in 2022: $160,957.
Median contract rent in 2022: $709 (lower quartile is $561, upper quartile is $858)
Median rent asked for vacant for-rent units in 2022: $705
Median gross rent in Lockport, NY in 2022: $838
Housing units in Lockport with a mortgage: 3,149 (313 second mortgage, 21 home equity loan, 255 both second mortgage and home equity loan )Houses without a mortgage: 203
Median household income for houses/condos with a mortgage: $93,246
Median household income for apartments without a mortgage: $69,450
Median monthly housing costs: $929
Data:
Median house or condo value ($)
Median house or condo value ($ change since 2000)
Median house or condo value ($) - White
Median house or condo value ($) - Black or African American
Median house or condo value ($) - Asian
Median house or condo value ($) - Hispanic or Latino
Median house or condo value ($) - American Indian and Alaska Native
Median house or condo value ($) - Multirace
Median house or condo value ($) - Other Race
Median price asked for mobile homes ($)
Household density (households per square mile)
Mean house or condo value by units in structure - 1, detached ($)
Mean house or condo value by units in structure - 1, attached ($)
Mean house or condo value by units in structure - 2 ($)
Mean house or condo value by units in structure by units in structure - 3 or 4 ($)
Mean house or condo value by units in structure - 5 or more ($)
Mean house or condo value by units in structure - Boat, RV, van, etc. ($)
Mean house or condo value by units in structure - Mobile home ($)
Median contract rent ($)
Median contract rent - Lower quartile ($)
Median contract rent - Upper quartile ($)
Median gross rent ($)
Urban houses (%)
Rural houses (%)
Houses occupied (%)
Houses occupied (% change since 2000)
Houses owner occupied (%)
Houses owner occupied (% change since 2000)
Houses renter occupied (%)
Houses renter occupied (% change since 2000)
Vacant housing units - For rent (%)
Vacant housing units - For rent (% change since 2000)
Vacant housing units - For sale only (%)
Vacant housing units - For sale only (% change since 2000)
Vacant housing units - Rented or sold, not occupied (%)
Vacant housing units - Rented or sold, not occupied (% change since 2000)
Vacant housing units - For seasonal, recreational, or occasional use (%)
Vacant housing units - For seasonal, recreational, or occasional use (% change since 2000)
Vacant housing units - For migrant workers (%)
Vacant housing units - For migrant workers (% change since 2000)
Vacant housing units - Other vacant (%)
Vacant housing units - Other vacant (% change since 2000)
Median monthly housing costs ($)
Median household income for houses/condos with a mortgage ($)
Median household income for houses/condos without a mortgage ($)
Median household income ($)
Median household income ($) - White
Median household income ($) - Black or African American
Median household income ($) - Asian
Median household income ($) - Hispanic or Latino
Median household income ($) - American Indian and Alaska Native
Median household income ($) - Multirace
Median household income ($) - Other Race
Mortgage status - with mortgage (%)
Mortgage status - with second mortgage (%)
Mortgage status - with home equity loan (%)
Mortgage status - with both second mortgage and home equity loan (%)
Mortgage status - without a mortgage (%)
Median year house/condo built
Median year apartment built
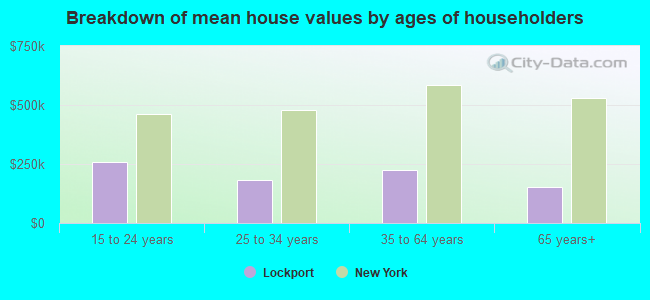
Household type by relationship - Male householder living alone (%)
Household type by relationship - Male householder not living alone (%)
Household type by relationship - Female householder living alone (%)
Household type by relationship - Female householder not living alone (%)
Household type by relationship - Opposite-Sex spouse (%)
Household type by relationship - Same-Sex spouse (%)
Household type by relationship - Opposite-Sex unmarried partner (%)
Household type by relationship - Same-Sex unmarried partner (%)
Household type by relationship - In group quarters (%)
Size of family households - 2-person household (%)
Size of family households - 3-person household (%)
Size of family households - 4-person household (%)
Size of family households - 5-person household (%)
Size of family households - 6-person household (%)
Size of family households - 7-or-more-person household (%)
Size of nonfamily households - 1-person household (%)
Size of nonfamily households - 2-person household (%)
Size of nonfamily households - 3-person household (%)
Size of nonfamily households - 4-person household (%)
Size of nonfamily households - 5-person household (%)
Size of nonfamily households - 6-person household (%)
Size of nonfamily households - 7-or-moreperson household (%)
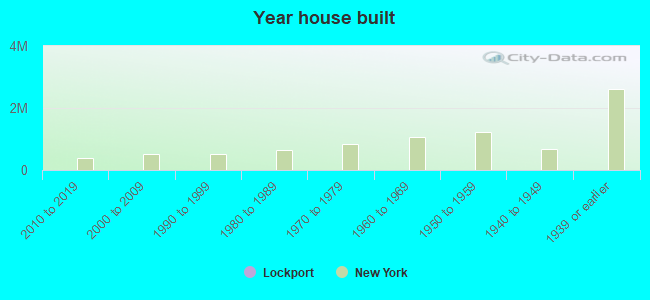
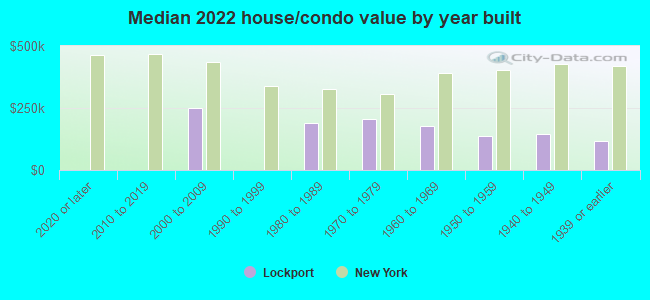
Year house built - Built 2010 or later (%)
Year house built - Built 2000 to 2009 (%)
Year house built - Built 1990 to 1999 (%)
Year house built - Built 1980 to 1989 (%)
Year house built - Built 1970 to 1979 (%)
Year house built - Built 1960 to 1969 (%)
Year house built - Built 1950 to 1959 (%)
Year house built - Built 1940 to 1949 (%)
Year house built - Built 1939 or earlier (%)
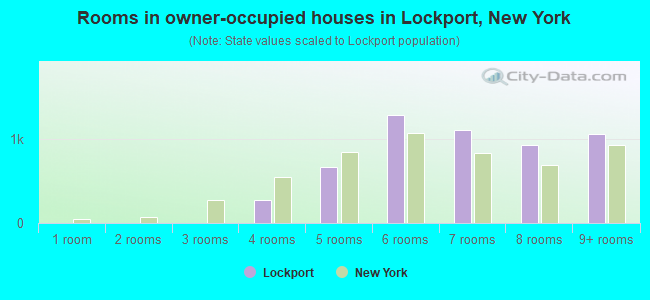
Median number of rooms in houses and condos
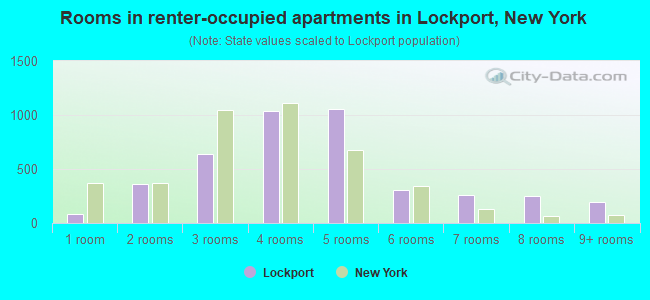
Median number of rooms in apartments
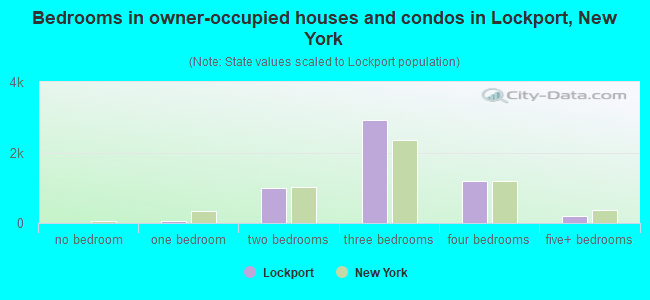
Median number of bedrooms in owner occupied houses
Mean number of bedrooms in owner occupied houses
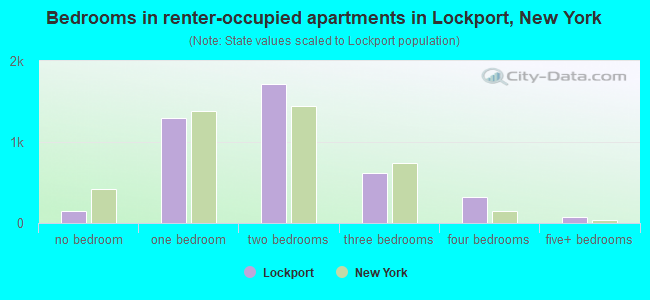
Median number of bedrooms in renter occupied houses
Mean number of bedrooms in renter occupied houses
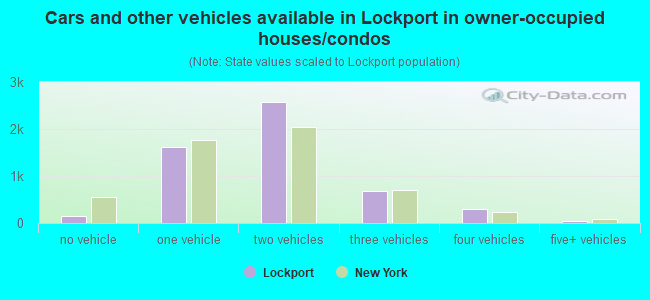
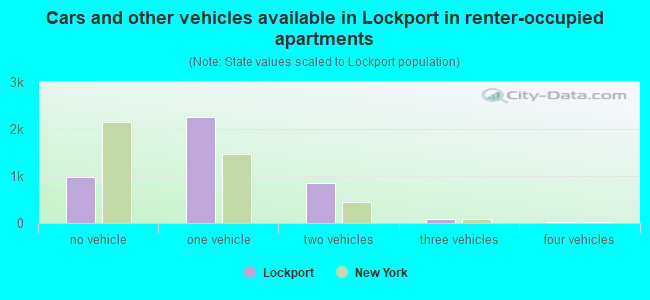
Median number of vehichles in owner occupied houses
Mean number of vehichles in owner occupied houses
Median number of vehichles in renter occupied houses
Mean number of vehichles in renter occupied houses
Rooms in owner-occupied houses - 1 room (%)
Rooms in owner-occupied houses - 2 rooms (%)
Rooms in owner-occupied houses - 3 rooms (%)
Rooms in owner-occupied houses - 4 rooms (%)
Rooms in owner-occupied houses - 5 rooms (%)
Rooms in owner-occupied houses - 6 rooms (%)
Rooms in owner-occupied houses - 7 rooms (%)
Rooms in owner-occupied houses - 8 rooms (%)
Rooms in owner-occupied houses - 9+ rooms (%)
Rooms in renter-occupied houses - 1 room (%)
Rooms in renter-occupied houses - 2 rooms (%)
Rooms in renter-occupied houses - 3 rooms (%)
Rooms in renter-occupied houses - 4 rooms (%)
Rooms in renter-occupied houses - 5 rooms (%)
Rooms in renter-occupied houses - 6 rooms (%)
Rooms in renter-occupied houses - 7 rooms (%)
Rooms in renter-occupied houses - 8 rooms (%)
Rooms in renter-occupied houses - 9+ rooms (%)
Bedrooms in owner-occupied houses - no bedrooms (%)
Bedrooms in owner-occupied houses - 1 bedroom (%)
Bedrooms in owner-occupied houses - 2 bedrooms (%)
Bedrooms in owner-occupied houses - 3 bedrooms (%)
Bedrooms in owner-occupied houses - 4 bedrooms (%)
Bedrooms in owner-occupied houses - 5+ bedrooms (%)
Bedrooms in renter-occupied houses - no bedrooms (%)
Bedrooms in renter-occupied houses - 1 bedroom (%)
Bedrooms in renter-occupied houses - 2 bedrooms (%)
Bedrooms in renter-occupied houses - 3 bedrooms (%)
Bedrooms in renter-occupied houses - 4 bedrooms (%)
Bedrooms in renter-occupied houses - 5+ bedrooms (%)
Vehicles available in owner-occupied houses - no vehicle available (%)
Vehicles available in owner-occupied houses - 1 vehicle available(%)
Vehicles available in owner-occupied houses - 2 Vehicles available (%)
Vehicles available in owner-occupied houses - 3 Vehicles available (%)
Vehicles available in owner-occupied houses - 4 Vehicles available (%)
Vehicles available in owner-occupied houses - 5+ Vehicles available (%)
Vehicles available in renter-occupied houses - no vehicle available (%)
Vehicles available in renter-occupied houses - 1 vehicle available (%)
Vehicles available in renter-occupied houses - 2 Vehicles available (%)
Vehicles available in renter-occupied houses - 3 Vehicles available (%)
Vehicles available in renter-occupied houses - 4 Vehicles available (%)
Vehicles available in renter-occupied houses - 5+ Vehicles available (%)
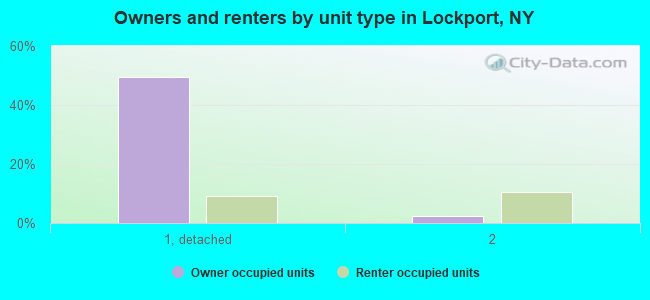
Housing units in structures - 1, detached (%)
Housing units in structures - 1, attached (%)
Housing units in structures - 2 (%)
Housing units in structures - 3 or 4 (%)
Housing units in structures - 5 to 9 (%)
Housing units in structures - 10 to 19 (%)
Housing units in structures - 20 to 49 (%)
Housing units in structures - 50 or more (%)
Housing units in structures - Mobile home (%)
Housing units in structures - Boat, RV, van, etc. (%)
Housing units in structures - Owners - 1, detached (%)
Housing units in structures - Owners - 1, attached (%)
Housing units in structures - Owners - 2 (%)
Housing units in structures - Owners - 3 or 4 (%)
Housing units in structures - Owners - 5 to 9 (%)
Housing units in structures - Owners - 10 to 19 (%)
Housing units in structures - Owners - 20 to 49 (%)
Housing units in structures - Owners - 50 or more (%)
Housing units in structures - Owners - Mobile home (%)
Housing units in structures - Owners - Boat, RV, van, etc. (%)
Housing units in structures - Renters - 1, detached (%)
Housing units in structures - Renters - 1, attached (%)
Housing units in structures - Renters - 2 (%)
Housing units in structures - Renters - 3 or 4 (%)
Housing units in structures - Renters - 5 to 9 (%)
Housing units in structures - Renters - 10 to 19 (%)
Housing units in structures - Renters - 20 to 49 (%)
Housing units in structures - Renters - 50 or more (%)
Housing units in structures - Renters - Mobile home (%)
Housing units in structures - Renters - Boat, RV, van, etc. (%)
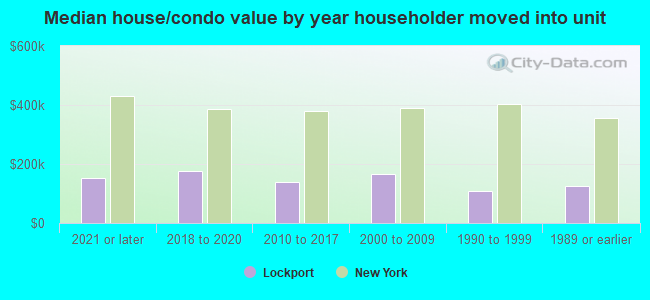
House/condo owner moved in on average (years ago)
Renter moved in on average (years ago)
Year householder moved into unit - Moved in 1999 to March 2000 (%)
Year householder moved into unit - Moved in 1999 to March 2000 (%) - White
Year householder moved into unit - Moved in 1999 to March 2000 (%) - Black or African American
Year householder moved into unit - Moved in 1999 to March 2000 (%) - Asian
Year householder moved into unit - Moved in 1999 to March 2000 (%) - Hispanic or Latino
Year householder moved into unit - Moved in 1999 to March 2000 (%) - American Indian and Alaska Native
Year householder moved into unit - Moved in 1999 to March 2000 (%) - Multirace
Year householder moved into unit - Moved in 1999 to March 2000 (%) - Other Race
Year householder moved into unit - Moved in 1995 to 1998 (%)
Year householder moved into unit - Moved in 1995 to 1998 (%) - White
Year householder moved into unit - Moved in 1995 to 1998 (%) - Black or African American
Year householder moved into unit - Moved in 1995 to 1998 (%) - Asian
Year householder moved into unit - Moved in 1995 to 1998 (%) - Hispanic or Latino
Year householder moved into unit - Moved in 1995 to 1998 (%) - American Indian and Alaska Native
Year householder moved into unit - Moved in 1995 to 1998 (%) - Multirace
Year householder moved into unit - Moved in 1995 to 1998 (%) - Other Race
Year householder moved into unit - Moved in 1990 to 1994 (%)
Year householder moved into unit - Moved in 1990 to 1994 (%) - White
Year householder moved into unit - Moved in 1990 to 1994 (%) - Black or African American
Year householder moved into unit - Moved in 1990 to 1994 (%) - Asian
Year householder moved into unit - Moved in 1990 to 1994 (%) - Hispanic or Latino
Year householder moved into unit - Moved in 1990 to 1994 (%) - American Indian and Alaska Native
Year householder moved into unit - Moved in 1990 to 1994 (%) - Multirace
Year householder moved into unit - Moved in 1990 to 1994 (%) - Other Race
Year householder moved into unit - Moved in 1980 to 1989 (%)
Year householder moved into unit - Moved in 1980 to 1989 (%) - White
Year householder moved into unit - Moved in 1980 to 1989 (%) - Black or African American
Year householder moved into unit - Moved in 1980 to 1989 (%) - Asian
Year householder moved into unit - Moved in 1980 to 1989 (%) - Hispanic or Latino
Year householder moved into unit - Moved in 1980 to 1989 (%) - American Indian and Alaska Native
Year householder moved into unit - Moved in 1980 to 1989 (%) - Multirace
Year householder moved into unit - Moved in 1980 to 1989 (%) - Other Race
Year householder moved into unit - Moved in 1970 to 1979 (%)
Year householder moved into unit - Moved in 1970 to 1979 (%) - White
Year householder moved into unit - Moved in 1970 to 1979 (%) - Black or African American
Year householder moved into unit - Moved in 1970 to 1979 (%) - Asian
Year householder moved into unit - Moved in 1970 to 1979 (%) - Hispanic or Latino
Year householder moved into unit - Moved in 1970 to 1979 (%) - American Indian and Alaska Native
Year householder moved into unit - Moved in 1970 to 1979 (%) - Multirace
Year householder moved into unit - Moved in 1970 to 1979 (%) - Other Race
Year householder moved into unit - Moved in 1969 or earlier (%)
Year householder moved into unit - Moved in 1969 or earlier (%) - White
Year householder moved into unit - Moved in 1969 or earlier (%) - Black or African American
Year householder moved into unit - Moved in 1969 or earlier (%) - Asian
Year householder moved into unit - Moved in 1969 or earlier (%) - Hispanic or Latino
Year householder moved into unit - Moved in 1969 or earlier (%) - American Indian and Alaska Native
Year householder moved into unit - Moved in 1969 or earlier (%) - Multirace
Year householder moved into unit - Moved in 1969 or earlier (%) - Other Race
Housing units lacking complete plumbing facilities (%)
Housing units lacking complete kitchen facilities (%)
House heating fuel used in houses and condos - Utility gas (%)
House heating fuel used in houses and condos - Bottled, tank, or LP gas (%)
House heating fuel used in houses and condos - Electricity (%)
House heating fuel used in houses and condos - Fuel oil, kerosene, etc. (%)
House heating fuel used in houses and condos - Coal or coke (%)
House heating fuel used in houses and condos - Wood (%)
House heating fuel used in houses and condos - Solar energy (%)
House heating fuel used in houses and condos - Other fuel (%)
House heating fuel used in houses and condos - No fuel used (%)
House heating fuel used in apartments - Utility gas (%)
House heating fuel used in apartments - Bottled, tank, or LP gas (%)
House heating fuel used in apartments - Electricity (%)
House heating fuel used in apartments - Fuel oil, kerosene, etc. (%)
House heating fuel used in apartments - Coal or coke (%)
House heating fuel used in apartments - Wood (%)
House heating fuel used in apartments - Solar energy (%)
House heating fuel used in apartments - Other fuel (%)
House heating fuel used in apartments - No fuel used (%)
Latest news about housing in Lockport, NY collected exclusively by city-data.com from local newspapers, TV, and radio stations
Median year house/condo built: 1938Median year apartment built: 1960Household type by relationship:
Households: 20,675
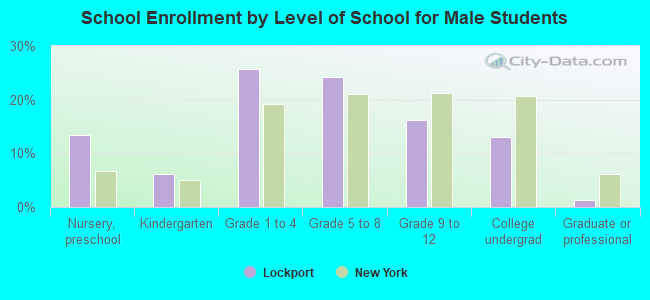
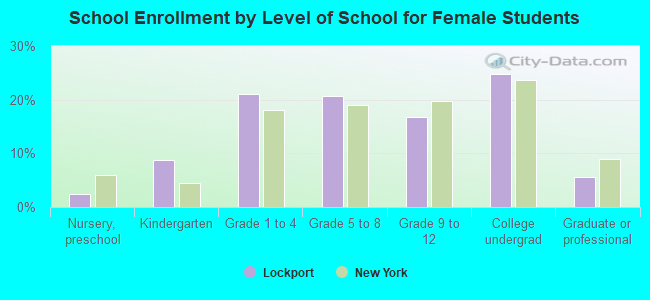
Male householders: 4,269 (1,628 living alone ), Female householders: 4,891 (1,847 living alone )3,056 spouses (2,910 opposite-sex spouses ), 850 unmarried partners , (725 opposite-sex unmarried partners ), 6,054 children (5,611 natural , 147 adopted , 296 stepchildren ), 404 grandchildren , 168 brothers or sisters , 111 parents , 62 foster children , 193 other relatives , 315 non-relatives In group quarters: 296
Size of family households: 2,489 2-persons , 1,231 3-persons , 1,110 4-persons , 335 5-persons , 144 6-persons , 79 7-or-more-persons .
Size of nonfamily households: 3,525 1-person , 568 2-persons , 13 3-persons , 12 4-persons .
1,793 married couples with children. single-parent households (579 men , 2,074 women ).
95.3% of residents of Lockport speak English at home. of residents speak Spanish at home (21% speak English very well , 49% speak English well , 23% speak English not well , 7% don't speak English at all ).of residents speak other Indo-European language at home (61% speak English very well , 7% speak English well , 32% speak English not well ).of residents speak Asian or Pacific Island language at home (86% speak English very well , 14% speak English well ).of residents speak other language at home (26% speak English very well , 19% speak English well , 55% speak English not well ).
Foreign born population: 951 (4.6%)of them are naturalized citizens )
Median number of rooms in houses and condos:
Median number of rooms in apartments
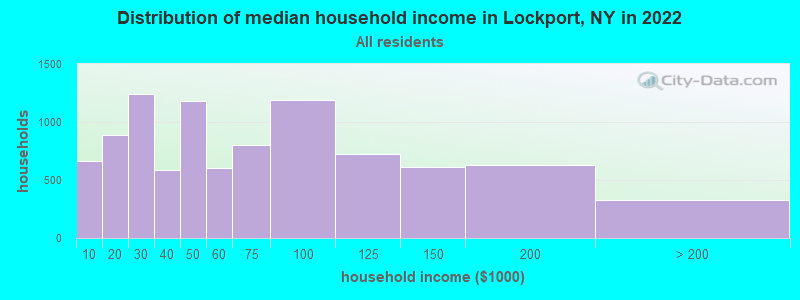
Lockport, NY household income distribution 663 Less than $10,000885 $10,000 to $19,9991,245 $20,000 to $29,999582 $30,000 to $39,9991,177 $40,000 to $49,999600 $50,000 to $59,999798 $60,000 to $74,9991,188 $75,000 to $99,999723 $100,000 to $124,999615 $125,000 to $149,999627 $150,000 to $199,999331 $200,000 or more
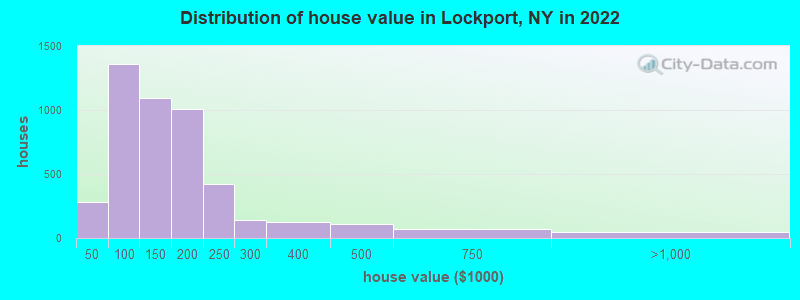
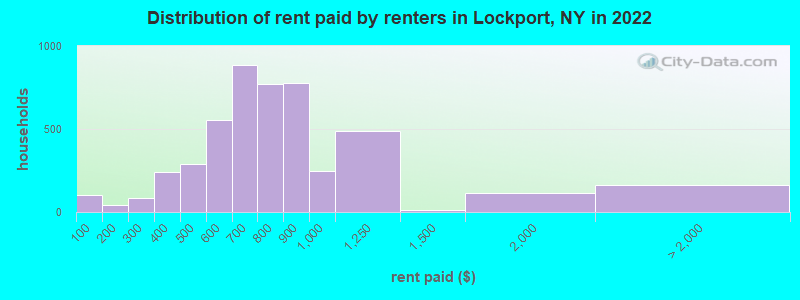
Home value of owner - occupied houses in 2022 in Lockport, NY 34 Less than $10,00047 $15,000 to $19,9999 $20,000 to $24,99959 $25,000 to $29,9994 $30,000 to $34,99925 $35,000 to $39,999102 $40,000 to $49,999130 $50,000 to $59,999140 $60,000 to $69,999361 $70,000 to $79,999340 $80,000 to $89,999285 $90,000 to $99,999573 $100,000 to $124,999519 $125,000 to $149,999787 $150,000 to $174,999216 $175,000 to $199,999420 $200,000 to $249,999139 $250,000 to $299,999124 $300,000 to $399,999113 $400,000 to $499,99972 $500,000 to $749,99927 $750,000 to $999,99916 $1,500,000 to $1,999,999Rent paid by renters in 2022 in Lockport, NY 99 Less than $10030 $100 to $14910 $150 to $19914 $200 to $24970 $250 to $299135 $300 to $349103 $350 to $399185 $400 to $449103 $450 to $499318 $500 to $549237 $550 to $599513 $600 to $649370 $650 to $699243 $700 to $749528 $750 to $799775 $800 to $899248 $900 to $999489 $1,000 to $1,24913 $1,250 to $1,499112 $1,500 to $1,99928 $2,000 to $2,49932 $2,500 to $2,999101 No cash rent
Percentage of workers working in this county: 63.8%Number of people working at home: 907 (9.0% of all workers )
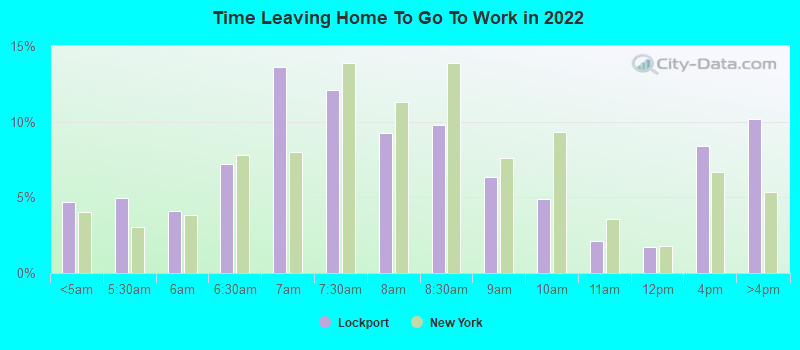
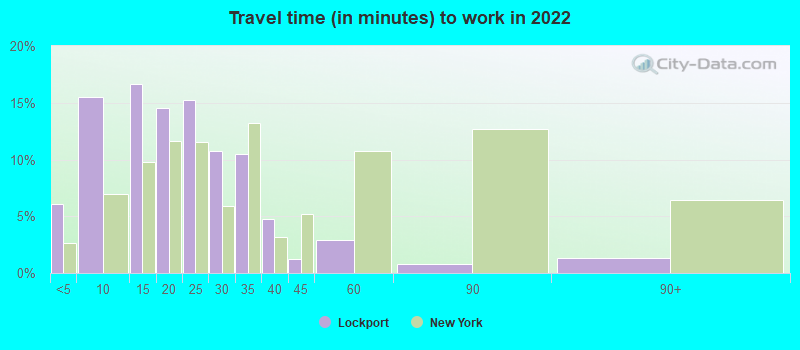
Travel time to work (commute)
Less than 5 minutes: 4335 to 9 minutes: 1,49110 to 14 minutes: 1,25515 to 19 minutes: 80020 to 24 minutes: 77325 to 29 minutes: 88130 to 34 minutes: 1,35335 to 39 minutes: 70540 to 44 minutes: 51445 to 59 minutes: 68560 to 89 minutes: 26290 or more minutes: 48
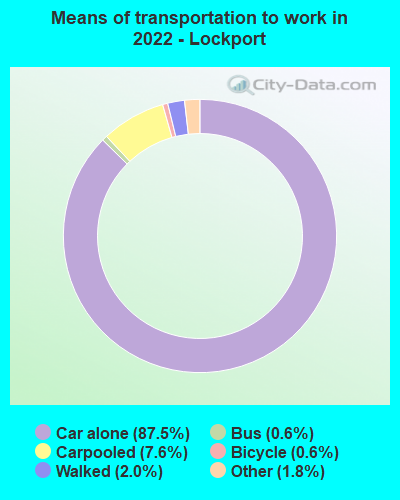
Means of transportation to work:
Drove a car alone: 6,984 (77.9%)Carpooled: 569 (6.4%)Bus : 34 (0.4%)Taxi: 178 (2.0%)Bicycle: 65 (0.7%)Walked: 186 (2.1%)Worked at home: 907 (10.1%)
Unemployment by race in 2022
Unemployment rate for White non-Hispanic residents 3.4% Males2.4% FemalesUnemployment rate for Black residents 5.1% Males9.7% FemalesUnemployment rate for other race residents 6.4% Males48.4% FemalesUnemployment rate for two or more race residents 5.1% Males4.8% FemalesUnemployment rate for Hispanic or Latino residents 2.6% Males7.9% Females
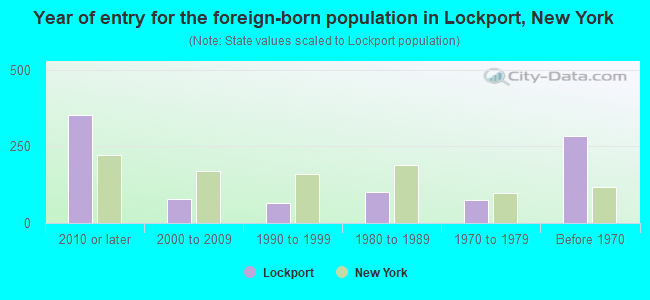
Year of entry for the foreign-born population in Lockport, New York
352 2010 or later 78 2000 to 2009 66 1990 to 1999 100 1980 to 1989 76 1970 to 1979 284 Before 1970
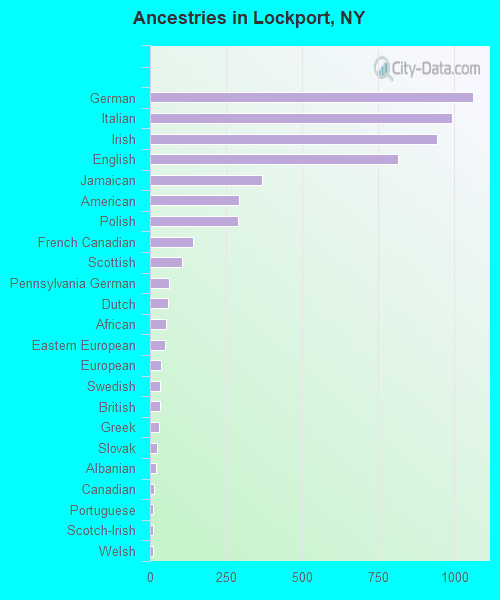
First ancestries reported:
German: 1,062 (13.6%)
Italian: 992 (12.7%)
Irish: 944 (12.1%)
English: 815 (10.5%)
Jamaican: 368 (4.7%)
American: 294 (3.8%)
Polish: 290 (3.7%)
French Canadian: 141 (1.8%)
Scottish: 106 (1.4%)
Pennsylvania German: 61 (0.8%)
Dutch: 59 (0.8%)
African: 52 (0.7%)
Eastern European: 49 (0.6%)
European: 37 (0.5%)
Swedish: 33 (0.4%)
British: 32 (0.4%)
Greek: 30 (0.4%)
Slovak: 23 (0.3%)
Albanian: 19 (0.2%)
Canadian: 12 (0.2%)
Portuguese: 11 (0.1%)
Scotch-Irish: 11 (0.1%)
Welsh: 11 (0.1%)
French: 9 (0.1%)
Trinidadian and Tobagonian: 9 (0.1%)
Estonian: 7 (0.09%)
Ukrainian: 7 (0.09%)
Russian: 5 (0.06%) Most common places of birth for foreign-born residents (%): Other Western Africa Lockport:
30.6% (215)New York:
0.4% (19,133)
Jamaica Lockport:
20.9% (147)New York:
5.0% (227,557)
Canada Lockport:
13.1% (92)New York:
1.3% (59,107)
Mexico Lockport:
9.0% (63)New York:
4.8% (214,559)
England Lockport:
4.6% (32)New York:
0.5% (23,058)
Germany Lockport:
3.6% (25)New York:
0.9% (38,713)
Italy Lockport:
3.4% (24)New York:
1.8% (81,374)
Brazil Lockport:
3.3% (23)New York:
0.7% (30,658)
Saudi Arabia Lockport:
2.8% (20)New York:
0.1% (3,194)
Albania Lockport:
2.7% (19)New York:
0.6% (25,362)
Algeria Lockport:
1.9% (13)New York:
0.1% (4,189)
Japan Lockport:
1.6% (11)New York:
0.6% (28,472)
Place of birth for U.S.-born residents:
This state: 17,540Other state: 2,008Northeast: 542Midwest: 362South: 1,030West: 132 87.5% of Lockport residents lived in the same house 1 years ago.
Out of people who lived in different houses, 38.3% lived in this county.
Out of people who lived in different counties, 92.7% lived in New York.
Lockport:
87.5%State average:
89.6%
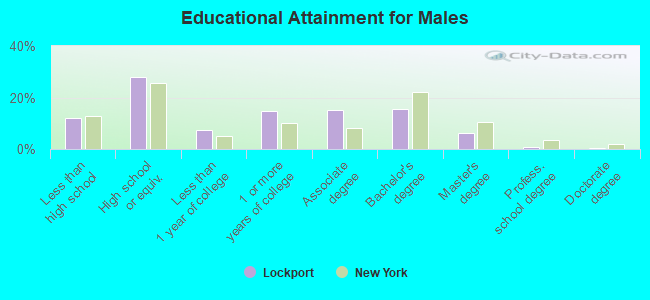
Education attainment for males 25 years and older:
No schooling: 96Nursery to 4th grade: 415th and 6th grade: 147th and 8th grade: 1509th grade: 15110th grade: 12611th grade: 11812th grade, no diploma: 145High school graduate (or equivalency): 1,932Less than 1 year of college: 511Some college more than 1 year, no degree: 1,014Associate degree: 1,047Bachelor's degree: 1,087Master's degree: 432Professional school degree: 53Doctorate degree: 35
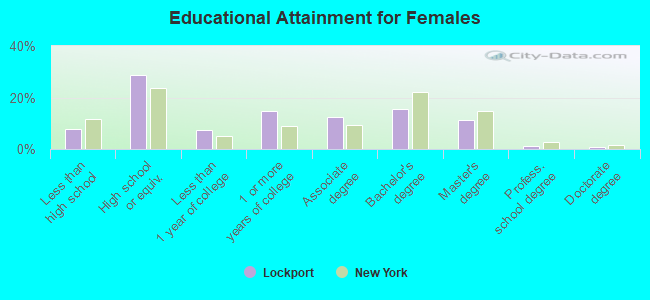
Education attainment for females 25 years and older:
No schooling: 47Nursery to 4th grade: 1525th and 6th grade: 07th and 8th grade: 729th grade: 2910th grade: 10011th grade: 9512th grade, no diploma: 86High school graduate (or equivalency): 2,161Less than 1 year of college: 544Some college more than 1 year, no degree: 1,119Associate degree: 943Bachelor's degree: 1,181Master's degree: 853Professional school degree: 94Doctorate degree: 52
Housing units in structures:
One, detached: 5,959One, attached: 163Two: 1,2913 or 4: 1,1395 to 9: 1,07510 to 19: 19120 to 49: 14650 or more: 244Mobile homes: 70Housing units lacking complete plumbing facilities in 2022: 2.8%Housing units lacking complete kitchen facilities in 2022: 4.5%House/condo owner moved in on average 13 years ago
Renter moved in on average 3 years ago
Private vs. public school enrollment:
Students in private schools in grades 1 to 8 (elementary and middle school): 153 Students in private schools in grades 9 to 12 (high school): 52 Students in private undergraduate colleges: 197