Lompoc, CA (California) Houses and Residents
| Lompoc: | $425,379 |
| California: | $715,900 |
Mean price in 2022:
Detached houses: $516,865
Here: $516,865 State: $988,808 Townhouses or other attached units: $347,672
Here: $347,672 State: $838,546 In 2-unit structures: $441,729
Here: $441,729 State: $1,138,100 In 3-to-4-unit structures: $266,446
Here: $266,446 State: $824,253 In 5-or-more-unit structures: $479,109
Here: $479,109 State: $730,996 Mobile homes: $105,214
Here: $105,214 State: $184,506
Total population: 44,013 (Urban population: 41,078, Rural population: 0)
Houses: 14,572 (14,056 occupied: 7,085 owner occupied, 7,051 renter occupied)
| % of renters here: | 50% |
| State: | 44% |
Housing density: 1,252 houses/condos per square mile
Median price asked for vacant for-sale houses and condos in 2022: $357,164.
Median contract rent in 2022: $1,208 (lower quartile is $927, upper quartile is $1,571)
Median rent asked for vacant for-rent units in 2022: $1,794
Median gross rent in Lompoc, CA in 2022: $1,402
Housing units in Lompoc with a mortgage: 4,002 (328 second mortgage, 0 home equity loan, 269 both second mortgage and home equity loan)
Houses without a mortgage: 64
Median household income for houses/condos with a mortgage: $104,548
Median household income for apartments without a mortgage: $64,208
Median monthly housing costs: $1,355
Compare current foreclosures near Lompoc, CA:
| Photo | Address | Area | Beds / Baths | Price | Details |
|---|---|---|---|---|---|

|
#1
N 6th St
Lompoc, CA 93436
|
1,316 sq. feet
|
2 baths 3 beds |
show details | |

|
#2
N 1st Pl
Lompoc, CA 93436
|
1,315 sq. feet
|
2 baths 3 beds |
show details | |

|
#3
E Prune Ave # B
Lompoc, CA 93436
|
- sq. feet
|
3 baths 5 beds |
show details | |

|
#4
N C St
Lompoc, CA 93436
|
- sq. feet
|
1 baths 3 beds |
show details | |

|
#5
W Willow Ave
Lompoc, CA 93436
|
1,362 sq. feet
|
2 baths 4 beds |
show details | |

|
#6
S N St
Lompoc, CA 93436
|
- sq. feet
|
2 baths 2 beds |
show details | |

|
#7
Alamo
Lompoc, CA 93436
|
- sq. feet
|
2 baths 3 beds |
show details | |

|
#8
N Y St
Lompoc, CA 93436
|
- sq. feet
|
2 baths 4 beds |
show details | |

|
#9
N Y St
Lompoc, CA 93436
|
- sq. feet
|
2 baths 4 beds |
show details | |

|
#10
N 1st Pl # L
Lompoc, CA 93436
|
- sq. feet
|
2 baths 3 beds |
show details |
| Photo | Address | Area | Beds / Baths | Price | Details |
|---|---|---|---|---|---|

|
#11
E Pine Ave Spc 71
Lompoc, CA 93436
|
- sq. feet
|
2 baths 2 beds |
show details | |

|
#12
E Pine Ave
Lompoc, CA 93436
|
- sq. feet
|
1 baths 3 beds |
show details | |

|
#13
N C St
Lompoc, CA 93436
|
- sq. feet
|
1 baths 3 beds |
show details | |

|
#14
Milky Way
Lompoc, CA 93436
|
- sq. feet
|
- baths - beds |
show details | |

|
#15
N D St
Lompoc, CA 93436
|
- sq. feet
|
- baths - beds |
show details | |

|
#16
Senior Cir
Lompoc, CA 93436
|
- sq. feet
|
- baths - beds |
show details | |

|
#17
N L St
Lompoc, CA 93436
|
- sq. feet
|
- baths - beds |
show details | |

|
#18
S B St Apt E
Lompoc, CA 93436
|
- sq. feet
|
- baths - beds |
show details | |

|
#19
W Laurel Ave # 6
Lompoc, CA 93436
|
- sq. feet
|
- baths - beds |
show details | |

|
#20
Briar Creek Way Apt 106
Lompoc, CA 93436
|
- sq. feet
|
- baths - beds |
show details |
| Photo | Address | Area | Beds / Baths | Price | Details |
|---|---|---|---|---|---|

|
#21
S Bradley Rd
Santa Maria, CA 93455
|
1,196 sq. feet
|
2 baths 4 beds |
show details | |

|
#22
Elisa Ct
Buellton, CA 93427
|
1,310 sq. feet
|
2 baths 3 beds |
show details | |

|
#23
Kendale Rd
Buellton, CA 93427
|
1,310 sq. feet
|
2 baths 3 beds |
show details | |

|
#24
Pino Solo Dr
Santa Maria, CA 93455
|
2,143 sq. feet
|
3 baths 5 beds |
show details | |

|
#25
Berwyn Dr
Santa Maria, CA 93455
|
- sq. feet
|
2 baths 2 beds |
show details | |

|
#26
Kendale Rd
Buellton, CA 93427
|
1,310 sq. feet
|
2 baths 3 beds |
show details | |

|
#27
Berwyn Dr
Santa Maria, CA 93455
|
- sq. feet
|
2 baths 2 beds |
show details | |

|
#28
Lupin Ln
Santa Maria, CA 93455
|
- sq. feet
|
2 baths 4 beds |
show details | |

|
#29
Woodhaven Ct
Santa Maria, CA 93455
|
- sq. feet
|
2 baths 3 beds |
show details | |

|
#30
Los Padres Rd
Santa Maria, CA 93455
|
- sq. feet
|
2 baths 3 beds |
show details |
| Photo | Address | Area | Beds / Baths | Price | Details |
|---|---|---|---|---|---|

|
#31
Elisa Ct
Buellton, CA 93427
|
- sq. feet
|
2 baths 3 beds |
show details | |

|
#32
Terrace Ave
Santa Maria, CA 93455
|
- sq. feet
|
3 baths 3 beds |
show details | |

|
#33
Barnette Rd
Santa Maria, CA 93455
|
- sq. feet
|
2 baths 3 beds |
show details | |

|
#34
Song Ln
Santa Maria, CA 93455
|
- sq. feet
|
3 baths 4 beds |
show details | |

|
#35
Song Ln
Santa Maria, CA 93455
|
- sq. feet
|
- baths - beds |
show details | |

|
#36
Monte Carlo Ct
Santa Maria, CA 93455
|
- sq. feet
|
- baths - beds |
show details | |

|
#37
S Blosser Rd Spc 343
Santa Maria, CA 93455
|
- sq. feet
|
- baths - beds |
show details | |

|
#38
Crescent Ave
Santa Maria, CA 93455
|
- sq. feet
|
- baths - beds |
show details | |

|
#39
W Highway 246, Spc 82
Buellton, CA 93427
|
- sq. feet
|
- baths - beds |
show details | |

|
#40
W Highway 246, Spc 163
Buellton, CA 93427
|
- sq. feet
|
- baths - beds |
show details |
| Photo | Address | Area | Beds / Baths | Price | Details |
|---|---|---|---|---|---|

|
#41
View Park Dr
Santa Maria, CA 93455
|
- sq. feet
|
- baths - beds |
show details | |

|
#42
E Rice Ranch Rd
Santa Maria, CA 93455
|
- sq. feet
|
- baths - beds |
show details | |

|
#43
Zaca St Spc 26
Buellton, CA 93427
|
- sq. feet
|
- baths - beds |
show details | |

|
Check over 1 million property listings on Foreclosure.com!
|
browse all offers | |||

Latest news about housing in Lompoc, CA collected exclusively by city-data.com from local newspapers, TV, and radio stations

 | Lompoc - rental houses (5 replies) |
| living in/near Santa Barbara while working in Lompoc? (6 replies) |
| Relocating to Orcutt for job in Lompoc from Connecticut. (3 replies) |
| Tell me about Lompoc Ca. (9 replies) |
| 24 Year old single male moving to Lompoc in April (2 replies) |
| Couple to retire to "COOL" mediteranian clim., buy condominium? HELP? (30 replies) |

Median year apartment built: 1976
Household type by relationship:
Households: 43,949- Male householders: 6,952 (1,388 living alone), Female householders: 6,877 (1,877 living alone)
6,145 spouses (6,132 opposite-sex spouses), 1,238 unmarried partners, (1,206 opposite-sex unmarried partners), 15,133 children (14,646 natural, 62 adopted, 423 stepchildren), 1,245 grandchildren, 677 brothers or sisters, 762 parents, 0 foster children, 850 other relatives, 1,126 non-relatives
- In group quarters: 2,939
Size of family households: 3,184 2-persons, 1,927 3-persons, 2,401 4-persons, 1,056 5-persons, 801 6-persons, 281 7-or-more-persons.
Size of nonfamily households: 3,276 1-person, 985 2-persons, 65 3-persons, 78 4-persons, 11 5-persons.
5,489 married couples with children.
4,169 single-parent households (1,520 men, 2,649 women).
53.7% of residents of Lompoc speak English at home.
41.4% of residents speak Spanish at home (55% speak English very well, 21% speak English well, 17% speak English not well, 7% don't speak English at all).
1.3% of residents speak other Indo-European language at home (93% speak English very well, 6% speak English well, 2% speak English not well).
2.8% of residents speak Asian or Pacific Island language at home (68% speak English very well, 16% speak English well, 14% speak English not well, 2% don't speak English at all).
0.7% of residents speak other language at home (60% speak English very well, 12% speak English well, 9% speak English not well, 19% don't speak English at all).
Foreign born population: 9,436 (21.5%)
(38.5% of them are naturalized citizens)
| Here: | 5.8 |
| State: | 6.0 |
| Here: | 4.0 |
| State: | 3.9 |

- Bedrooms in owner-occupied houses and condos in Lompoc, California
- 100no bedroom
- 1971 bedroom
- 9062 bedrooms
- 3,8573 bedrooms
- 1,8424 bedrooms
- 1835+ bedrooms

- Bedrooms in renter-occupied apartments in Lompoc, California
- 496no bedroom
- 1,1351 bedroom
- 3,3112 bedrooms
- 1,6823 bedrooms
- 3774 bedrooms
- 505+ bedrooms

- Cars and other vehicles available in Lompoc in owner-occupied houses/condos
- 303no vehicle
- 1,6311 vehicle
- 2,5832 vehicles
- 1,4873 vehicles
- 7564 vehicles
- 3255+ vehicles

- Cars and other vehicles available in Lompoc in renter-occupied apartments
- 1,006no vehicle
- 2,7071 vehicle
- 2,2262 vehicles
- 8103 vehicles
- 2714 vehicles
- 335+ vehicles

- Rooms in owner-occupied houses in Lompoc, California
- 941 room
- 1212 rooms
- 2643 rooms
- 7364 rooms
- 1,8085 rooms
- 1,9446 rooms
- 1,0797 rooms
- 7008 rooms
- 3399+ rooms

- Rooms in renter-occupied apartments in Lompoc, California
- 4501 room
- 3332 rooms
- 1,1063 rooms
- 2,5854 rooms
- 1,4855 rooms
- 7576 rooms
- 1637 rooms
- 1078 rooms
- 659+ rooms


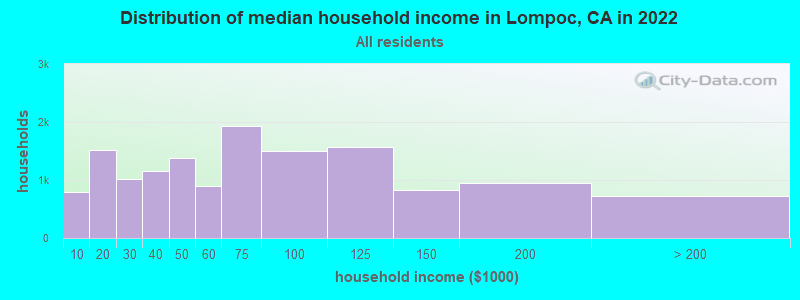
Lompoc, CA household income distribution

- 791Less than $10,000
- 1,512$10,000 to $19,999
- 1,023$20,000 to $29,999
- 1,161$30,000 to $39,999
- 1,379$40,000 to $49,999
- 898$50,000 to $59,999
- 1,923$60,000 to $74,999
- 1,500$75,000 to $99,999
- 1,566$100,000 to $124,999
- 820$125,000 to $149,999
- 942$150,000 to $199,999
- 724$200,000 or more
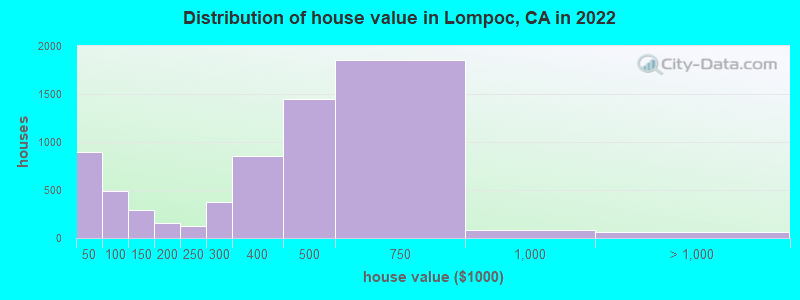
Home value of owner - occupied houses in 2022 in Lompoc, CA
-
- 263Less than $10,000
- 65$10,000 to $14,999
- 18$15,000 to $19,999
- 74$20,000 to $24,999
- 52$30,000 to $34,999
- 74$35,000 to $39,999
- 344$40,000 to $49,999
- 21$50,000 to $59,999
- 15$60,000 to $69,999
- 58$70,000 to $79,999
- 45$80,000 to $89,999
- 248$100,000 to $124,999
- 43$125,000 to $149,999
- 121$150,000 to $174,999
- 35$175,000 to $199,999
- 124$200,000 to $249,999
- 374$250,000 to $299,999
- 859$300,000 to $399,999
- 1,451$400,000 to $499,999
- 1,854$500,000 to $749,999
- 86$750,000 to $999,999
- 4$1,000,000 to $1,499,999
- 8$1,500,000 to $1,999,999
- 45$2,000,000 or more
Rent paid by renters in 2022 in Lompoc, CA
-
- 24Less than $100
- 67$100 to $149
- 25$150 to $199
- 57$200 to $249
- 19$250 to $299
- 160$300 to $349
- 7$350 to $399
- 11$400 to $449
- 58$450 to $499
- 73$500 to $549
- 78$550 to $599
- 176$600 to $649
- 93$650 to $699
- 34$700 to $749
- 133$750 to $799
- 539$800 to $899
- 542$900 to $999
- 1,583$1,000 to $1,249
- 1,838$1,250 to $1,499
- 1,165$1,500 to $1,999
- 307$2,000 to $2,499
- 78$2,500 to $2,999
- 32$3,000 to $3,499
- 5$3,500 or more
- 124No cash rent


Percentage of workers working in this county: 97.6%
Number of people working at home: 1,124 (6.3% of all workers)
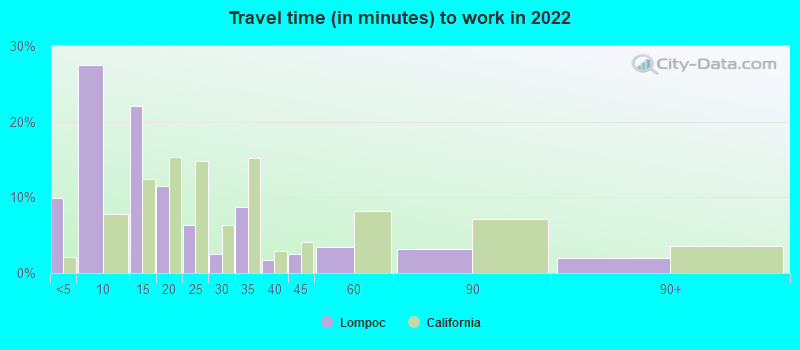
Travel time to work (commute)
- Less than 5 minutes: 1,285
- 5 to 9 minutes: 2,824
- 10 to 14 minutes: 1,979
- 15 to 19 minutes: 1,598
- 20 to 24 minutes: 1,020
- 25 to 29 minutes: 699
- 30 to 34 minutes: 2,059
- 35 to 39 minutes: 630
- 40 to 44 minutes: 411
- 45 to 59 minutes: 1,555
- 60 to 89 minutes: 2,199
- 90 or more minutes: 353
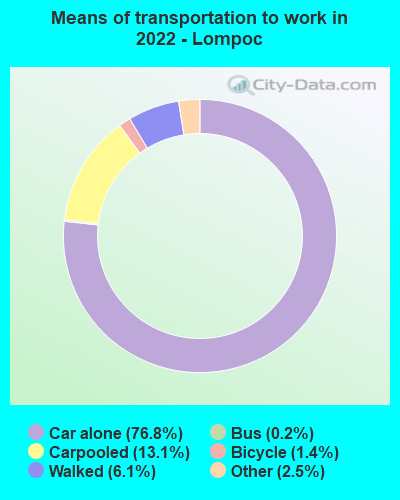
Means of transportation to work:
- Drove a car alone: 7,802 (67.2%)
- Carpooled: 1,223 (10.5%)
- Bus: 18 (0.2%)
- Taxi: 403 (3.5%)
- Bicycle: 162 (1.4%)
- Walked: 944 (8.1%)
- Worked at home: 1,124 (9.7%)

- Unemployment by race in 2022
- Unemployment rate for White non-Hispanic residents
- 3.8%Males
- 6.9%Females
- Unemployment rate for Black residents
- 13.6%Males
- Unemployment rate for American Indian and Alaska Native residents
- 17.0%Males
- 7.9%Females
- Unemployment rate for Asian residents
- 0.8%Females
- Unemployment rate for other race residents
- 6.7%Males
- 4.3%Females
- Unemployment rate for two or more race residents
- 11.3%Males
- 6.5%Females
- Unemployment rate for Hispanic or Latino residents
- 10.4%Males
- 5.5%Females

- Year of entry for the foreign-born population in Lompoc, California
- 8842010 or later
- 3,2182000 to 2009
- 2,2941990 to 1999
- 2,4751980 to 1989
- 1,1751970 to 1979
- 1,123Before 1970

First ancestries reported:
- German: 847 (3.2%)
- English: 579 (2.2%)
- American: 560 (2.1%)
- Irish: 522 (2.0%)
- Italian: 240 (0.9%)
- European: 168 (0.6%)
- Danish: 154 (0.6%)
- Scottish: 130 (0.5%)
- French: 107 (0.4%)
- Scandinavian: 90 (0.3%)
- Ukrainian: 85 (0.3%)
- Canadian: 80 (0.3%)
- Portuguese: 80 (0.3%)
- Eastern European: 59 (0.2%)
- Swedish: 58 (0.2%)
- Norwegian: 57 (0.2%)
- Polish: 47 (0.2%)
- British: 44 (0.2%)
- African: 42 (0.2%)
- French Canadian: 37 (0.1%)
- Dutch: 32 (0.1%)
- Swiss: 32 (0.1%)
- Scotch-Irish: 29 (0.1%)
- Turkish: 26 (0.10%)
- Czechoslovakian: 24 (0.09%)
- Celtic: 15 (0.06%)
- Russian: 11 (0.04%)
- Lithuanian: 9 (0.03%)
- Finnish: 8 (0.03%)
- Armenian: 7 (0.03%)
- Lebanese: 6 (0.02%)
- Slovak: 6 (0.02%)
- Nigerian: 6 (0.02%)
- Iranian: 5 (0.02%)
- Cajun: 4 (0.02%)
- Brazilian: 3 (0.01%)
- Bulgarian: 3 (0.01%)
- Icelander: 3 (0.01%)
Most common places of birth for foreign-born residents (%):
| Lompoc: | 77.1% (7,677) |
| California: | 37.2% (3,881,193) |
| Lompoc: | 3.9% (384) |
| California: | 7.8% (818,297) |
| Lompoc: | 2.6% (258) |
| California: | 2.8% (290,436) |
| Lompoc: | 1.9% (187) |
| California: | 0.6% (66,590) |
Place of birth for U.S.-born residents:
- This state: 27,107
- Other state: 6,661
- Northeast: 1,129
- Midwest: 1,520
- South: 2,340
- West: 1,807
84.0% of Lompoc residents lived in the same house 1 years ago.
Out of people who lived in different houses, 42.6% lived in this county.
Out of people who lived in different counties, 85.8% lived in California.
| Lompoc: | 84.0% |
| State average: | 88.9% |
Education attainment for males 25 years and older:
- No schooling: 709
- Nursery to 4th grade: 218
- 5th and 6th grade: 956
- 7th and 8th grade: 410
- 9th grade: 222
- 10th grade: 387
- 11th grade: 935
- 12th grade, no diploma: 483
- High school graduate (or equivalency): 3,884
- Less than 1 year of college: 1,384
- Some college more than 1 year, no degree: 2,662
- Associate degree: 1,119
- Bachelor's degree: 1,443
- Master's degree: 276
- Professional school degree: 111
- Doctorate degree: 65

Education attainment for females 25 years and older:
- No schooling: 628
- Nursery to 4th grade: 491
- 5th and 6th grade: 417
- 7th and 8th grade: 214
- 9th grade: 596
- 10th grade: 201
- 11th grade: 343
- 12th grade, no diploma: 335
- High school graduate (or equivalency): 3,492
- Less than 1 year of college: 963
- Some college more than 1 year, no degree: 1,643
- Associate degree: 1,362
- Bachelor's degree: 1,104
- Master's degree: 587
- Professional school degree: 66
- Doctorate degree: 80


Housing units in structures:
- One, detached: 7,572
- One, attached: 1,213
- Two: 609
- 3 or 4: 1,173
- 5 to 9: 1,835
- 10 to 19: 509
- 20 to 49: 257
- 50 or more: 491
- Mobile homes: 881
- Boats, RVs, vans, etc.: 26
Median worth of mobile homes: $67,737
Housing units lacking complete kitchen facilities in 2022: 2.0%
House/condo owner moved in on average 15 years ago
Renter moved in on average 5 years ago

- 86.2%Utility gas
- 9.3%Electricity
- 2.6%No fuel used
- 0.8%Solar energy
- 0.7%Bottled, tank, or LP gas
- 0.4%Wood
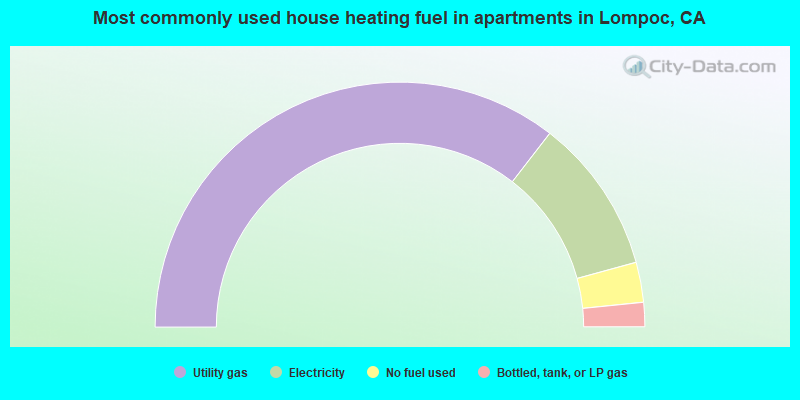
- 70.9%Utility gas
- 20.5%Electricity
- 5.3%No fuel used
- 3.2%Bottled, tank, or LP gas
Private vs. public school enrollment:
| Here: | 5.3% |
| California: | 10.5% |
| Here: | 1.8% |
| California: | 8.5% |
| Here: | 6.9% |
| California: | 15.9% |


