Londonderry, NH (New Hampshire) Houses and Residents
| Londonderry: | $447,089 |
| New Hampshire: | $384,700 |
Mean price in 2022:
Detached houses: $433,860
Here: $433,860 State: $491,479 Townhouses or other attached units: $250,326
Here: $250,326 State: $361,001 In 3-to-4-unit structures: $176,697
Here: $176,697 State: $575,942 In 5-or-more-unit structures: $224,087
Here: $224,087 State: $274,068 Mobile homes: $186,346
Here: $186,346 State: $124,817
Total population: 11,037 (All urban)
Houses: 4,724 (4,612 occupied: 3,788 owner occupied, 816 renter occupied)
| % of renters here: | 18% |
| State: | 28% |
Housing density: 387 houses/condos per square mile
Median price asked for vacant for-sale houses and condos in 2022 in this county: $227,726.
Median contract rent in 2022: $1,610 (lower quartile is $1,369, upper quartile is over $2,000)
Median rent asked for vacant for-rent units in 2022: $1,829
Median gross rent in Londonderry, NH in 2022: $1,863
Housing units in Londonderry with a mortgage: 2,455 (365 second mortgage, 0 home equity loan, 311 both second mortgage and home equity loan)
Houses without a mortgage: 123
Median household income for houses/condos with a mortgage: $144,995
Median household income for apartments without a mortgage: $86,812
Median monthly housing costs: $1,930
Compare current foreclosures near Londonderry, NH:
| Photo | Address | Area | Beds / Baths | Price | Details |
|---|---|---|---|---|---|

|
#1
Wiley Hill Rd
Londonderry, NH 03053
|
2,668 sq. feet
|
2 baths 3 beds |
show details | |

|
#2
Woods Ave
Londonderry, NH 03053
|
- sq. feet
|
- baths - beds |
show details | |

|
#3
Eglin Blvd, C O David Kamen
Londonderry, NH 03053
|
- sq. feet
|
- baths - beds |
show details | |

|
#4
Capitol Hill Dr
Londonderry, NH 03053
|
- sq. feet
|
- baths - beds |
show details | |

|
#5
Main St, Unit 302
Londonderry, NH 03053
|
- sq. feet
|
- baths - beds |
show details | |

|
#6
Cedar St # A
Haverhill, MA 01830
|
1,134 sq. feet
|
2 baths 2 beds |
$209,300
|
show details |

|
#7
Main St
Fremont, NH 03044
|
1,470 sq. feet
|
2 baths 4 beds |
$306,800
|
show details |

|
#8
Victoria Dr
Londonderry, NH 03053
|
- sq. feet
|
- baths - beds |
show details | |

|
#9
Hazelnut Ln
Londonderry, NH 03053
|
- sq. feet
|
- baths - beds |
show details | |

|
#10
Grove St
Londonderry, NH 03053
|
- sq. feet
|
- baths - beds |
show details |
| Photo | Address | Area | Beds / Baths | Price | Details |
|---|---|---|---|---|---|

|
#11
Winding Pond 349
Londonderry, NH 03053
|
- sq. feet
|
- baths - beds |
show details | |

|
#12
Canterbury Ln # 24
Londonderry, NH 03053
|
- sq. feet
|
- baths - beds |
show details | |

|
#13
Sherwood Rd
Londonderry, NH 03053
|
- sq. feet
|
- baths - beds |
show details | |

|
#14
Old Derry Rd
Londonderry, NH 03053
|
- sq. feet
|
- baths - beds |
show details | |

|
#15
Canterbury Ln
Londonderry, NH 03053
|
- sq. feet
|
- baths - beds |
show details | |

|
#16
Stokes Rd
Londonderry, NH 03053
|
- sq. feet
|
- baths - beds |
show details | |

|
#17
Winding Pond Rd
Londonderry, NH 03053
|
- sq. feet
|
- baths - beds |
show details | |

|
#18
Redfield Cir
Derry, NH 03038
|
2,124 sq. feet
|
3 baths 4 beds |
show details | |

|
#19
Lawrence Rd
Salem, NH 03079
|
1,305 sq. feet
|
1 baths 1 beds |
show details | |

|
#20
Amherst St
Amherst, NH 03031
|
- sq. feet
|
4 baths 3 beds |
show details |
| Photo | Address | Area | Beds / Baths | Price | Details |
|---|---|---|---|---|---|

|
#21
Willow Creek Dr # 42
Hudson, NH 03051
|
1,120 sq. feet
|
1 baths 2 beds |
show details | |

|
#22
Donati Dr
Hooksett, NH 03106
|
2,269 sq. feet
|
3 baths 5 beds |
show details | |

|
#23
Campo Seco St
Lawrence, MA 01841
|
2,276 sq. feet
|
3 baths 4 beds |
show details | |

|
#24
Blucher St
Manchester, NH 03102
|
2,448 sq. feet
|
2 baths 3 beds |
show details | |

|
#25
Maclarnon Rd
Salem, NH 03079
|
1,578 sq. feet
|
2 baths 3 beds |
show details | |

|
#26
Harvard St
Lowell, MA 01851
|
2,676 sq. feet
|
2 baths 4 beds |
show details | |

|
#27
Elm St
Manchester, NH 03104
|
4,352 sq. feet
|
3 baths 3 beds |
show details | |

|
#28
3rd Ave
North Chelmsford, MA 01863
|
- sq. feet
|
1 baths 2 beds |
show details | |

|
#29
Stonebridge Drive, Unit 233, Millstone Village Ii, A Condominium
Nashua, NH 03063
|
1,072 sq. feet
|
2 baths 2 beds |
show details | |

|
#30
Everett St
Derry, NH 03038
|
1,525 sq. feet
|
1 baths 3 beds |
show details |
| Photo | Address | Area | Beds / Baths | Price | Details |
|---|---|---|---|---|---|

|
#31
Aiken Ave Apt 15
Lowell, MA 01850
|
1,100 sq. feet
|
1 baths 2 beds |
show details | |

|
#32
Center St
Goffstown, NH 03045
|
2,308 sq. feet
|
4 baths 3 beds |
show details | |

|
#33
Michael Ave
Derry, NH 03038
|
1,536 sq. feet
|
1 baths 4 beds |
show details | |

|
#34
High St
Derry, NH 03038
|
2,149 sq. feet
|
3 baths 4 beds |
show details | |

|
#35
Vermont Ave # 1
Dracut, MA 01826
|
2,070 sq. feet
|
2 baths 4 beds |
show details | |

|
#36
Kirk St
Methuen, MA 01844
|
1,769 sq. feet
|
2 baths 4 beds |
show details | |

|
#37
Glen Forest Ln
Methuen, MA 01844
|
1,904 sq. feet
|
2 baths 3 beds |
show details | |

|
#38
Forest Park Rd
Dracut, MA 01826
|
1,080 sq. feet
|
1 baths 3 beds |
show details | |

|
#39
Washington St
Haverhill, MA 01832
|
3,162 sq. feet
|
5 baths 5 beds |
show details | |

|
#40
Forest Park Rd
Dracut, MA 01826
|
1,284 sq. feet
|
1 baths 3 beds |
show details |
| Photo | Address | Area | Beds / Baths | Price | Details |
|---|---|---|---|---|---|

|
#41
Hobson St
Methuen, MA 01844
|
1,779 sq. feet
|
1 baths 3 beds |
show details | |

|
#42
Elm St
Methuen, MA 01844
|
2,232 sq. feet
|
1 baths 3 beds |
show details | |

|
#43
Broadway, Apt 1
Methuen, MA 01844
|
2,328 sq. feet
|
4 baths 6 beds |
show details | |

|
#44
Glidden Ave
Lowell, MA 01851
|
4,477 sq. feet
|
2 baths 8 beds |
show details | |

|
#45
Woodland Ct
Lawrence, MA 01841
|
1,026 sq. feet
|
1 baths 3 beds |
show details | |

|
#46
Parker Ave Apt 4
Dracut, MA 01826
|
623 sq. feet
|
1 baths 2 beds |
show details | |

|
#47
Kenwood Rd
Dracut, MA 01826
|
1,040 sq. feet
|
1 baths 3 beds |
show details | |

|
#48
Sampson St
Methuen, MA 01844
|
1,553 sq. feet
|
2 baths 4 beds |
show details | |

|
#49
Beedle Ter
Methuen, MA 01844
|
1,507 sq. feet
|
2 baths 4 beds |
show details | |

|
Check over 1 million property listings on Foreclosure.com!
|
browse all offers | |||

Latest news about housing in Londonderry, NH collected exclusively by city-data.com from local newspapers, TV, and radio stations

 | Buying Home in NH from SC. Renting out temp. until move? NEED ADVICE! (36 replies) |
| Londonderry vs Bedford (8 replies) |
| Londonderry airplane noise from airport? (5 replies) |
| Whats up with NH houses? (117 replies) |
| Derry Londonderry or where -- please HELP a couple of oldies (25 replies) |
| A sampling of squatters (Before Corona) (40 replies) |

Median year apartment built: 1995
Household type by relationship:
Households: 12,306- Male householders: 2,123 (339 living alone), Female householders: 2,476 (707 living alone)
2,697 spouses (2,678 opposite-sex spouses), 265 unmarried partners, (255 opposite-sex unmarried partners), 4,012 children (3,849 natural, 23 adopted, 139 stepchildren), 186 grandchildren, 40 brothers or sisters, 95 parents, 0 foster children, 191 other relatives, 216 non-relatives
Size of family households: 1,232 2-persons, 907 3-persons, 622 4-persons, 309 5-persons, 78 6-persons, 19 7-or-more-persons.
Size of nonfamily households: 1,186 1-person, 208 2-persons, 40 3-persons.
1,580 married couples with children.
378 single-parent households (72 men, 306 women).
92.7% of residents of Londonderry speak English at home.
3.9% of residents speak Spanish at home (69% speak English very well, 31% speak English well).
2.6% of residents speak other Indo-European language at home (91% speak English very well, 7% speak English well, 2% speak English not well).
0.4% of residents speak Asian or Pacific Island language at home (100% speak English very well).
0.1% of residents speak other language at home (100% speak English very well).
Foreign born population: 564 (4.6%)
(57.6% of them are naturalized citizens)
| Here: | 6.5 |
| State: | 6.4 |
| Here: | 4.4 |
| State: | 4.0 |

- Bedrooms in owner-occupied houses and condos in Londonderry, New Hampshire
- 0no bedroom
- 411 bedroom
- 1,1782 bedrooms
- 1,2793 bedrooms
- 1,1344 bedrooms
- 1565+ bedrooms

- Bedrooms in renter-occupied apartments in Londonderry, New Hampshire
- 9no bedroom
- 631 bedroom
- 5422 bedrooms
- 1843 bedrooms
- 154 bedrooms
- 45+ bedrooms

- Cars and other vehicles available in Londonderry in owner-occupied houses/condos
- 40no vehicle
- 8961 vehicle
- 1,5782 vehicles
- 8223 vehicles
- 3254 vehicles
- 1295+ vehicles

- Cars and other vehicles available in Londonderry in renter-occupied apartments
- 84no vehicle
- 3341 vehicle
- 3342 vehicles
- 503 vehicles
- 44 vehicles
- 115+ vehicles

- Rooms in owner-occupied houses in Londonderry, New Hampshire
- 01 room
- 02 rooms
- 1383 rooms
- 4324 rooms
- 7115 rooms
- 5616 rooms
- 3927 rooms
- 6788 rooms
- 8779+ rooms

- Rooms in renter-occupied apartments in Londonderry, New Hampshire
- 91 room
- 202 rooms
- 1413 rooms
- 2264 rooms
- 2865 rooms
- 536 rooms
- 617 rooms
- 58 rooms
- 159+ rooms


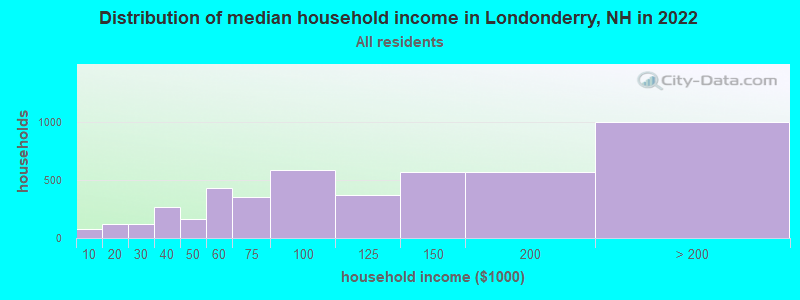
Londonderry, NH household income distribution

- 78Less than $10,000
- 116$10,000 to $19,999
- 119$20,000 to $29,999
- 269$30,000 to $39,999
- 167$40,000 to $49,999
- 432$50,000 to $59,999
- 348$60,000 to $74,999
- 581$75,000 to $99,999
- 366$100,000 to $124,999
- 570$125,000 to $149,999
- 570$150,000 to $199,999
- 996$200,000 or more
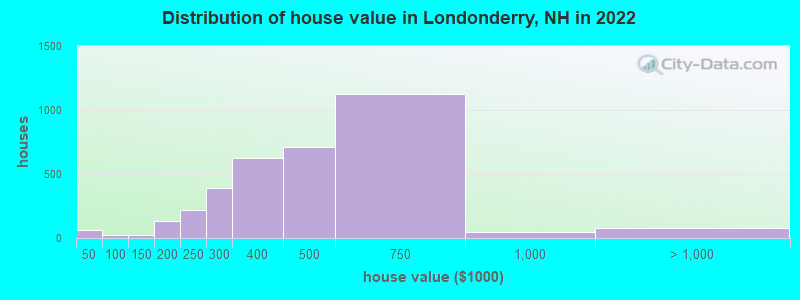
Home value of owner - occupied houses in 2022 in Londonderry, NH
-
- 10$30,000 to $34,999
- 39$35,000 to $39,999
- 9$40,000 to $49,999
- 13$50,000 to $59,999
- 24$125,000 to $149,999
- 39$150,000 to $174,999
- 95$175,000 to $199,999
- 219$200,000 to $249,999
- 392$250,000 to $299,999
- 622$300,000 to $399,999
- 714$400,000 to $499,999
- 1,122$500,000 to $749,999
- 47$750,000 to $999,999
- 80$1,000,000 to $1,499,999
Rent paid by renters in 2022 in Londonderry, NH
-
- 15Less than $100
- 12$800 to $899
- 11$900 to $999
- 99$1,000 to $1,249
- 218$1,250 to $1,499
- 257$1,500 to $1,999
- 176$2,000 to $2,499
- 20$2,500 to $2,999
- 68No cash rent


Percentage of workers working in this county: 46.5%
Number of people working at home: 1,394 (21.2% of all workers)
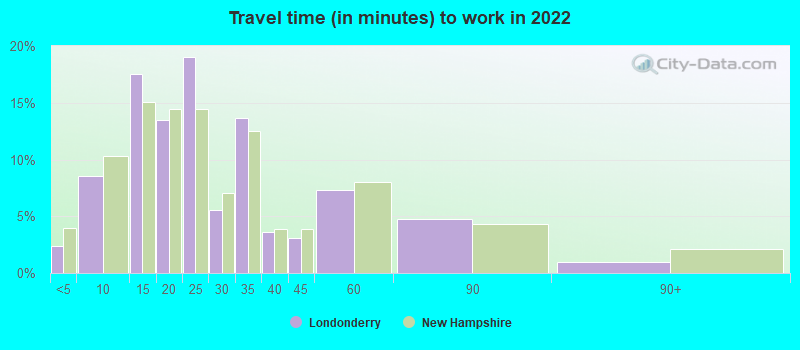
Travel time to work (commute)
- Less than 5 minutes: 33
- 5 to 9 minutes: 415
- 10 to 14 minutes: 541
- 15 to 19 minutes: 512
- 20 to 24 minutes: 814
- 25 to 29 minutes: 491
- 30 to 34 minutes: 925
- 35 to 39 minutes: 297
- 40 to 44 minutes: 306
- 45 to 59 minutes: 503
- 60 to 89 minutes: 374
- 90 or more minutes: 29
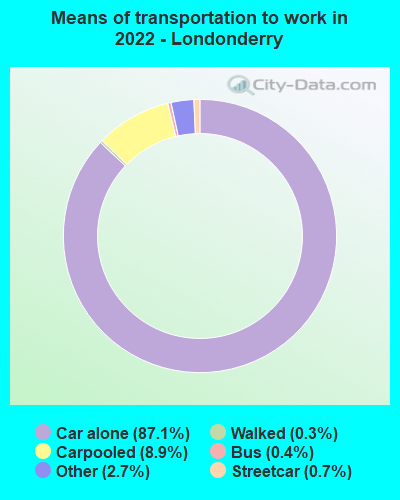
Means of transportation to work:
- Drove a car alone: 4,008 (66.9%)
- Carpooled: 437 (7.3%)
- Bus: 16 (0.3%)
- Subway or elevated rail: 32 (0.5%)
- Taxi: 183 (3.1%)
- Walked: 10 (0.2%)
- Worked at home: 1,394 (23.3%)

- Unemployment by race in 2022
- Unemployment rate for White non-Hispanic residents
- 3.9%Males
- 2.3%Females
- Unemployment rate for Black residents
- 22.4%Females
- Unemployment rate for two or more race residents
- 15.1%Females
- Unemployment rate for Hispanic or Latino residents
- 5.9%Females

- Year of entry for the foreign-born population in Londonderry, New Hampshire
- 882010 or later
- 1092000 to 2009
- 1431990 to 1999
- 1131980 to 1989
- 631970 to 1979
- 92Before 1970

First ancestries reported:
- Irish: 838 (17.7%)
- Italian: 628 (13.2%)
- English: 536 (11.3%)
- French Canadian: 437 (9.2%)
- American: 332 (7.0%)
- French: 263 (5.5%)
- German: 249 (5.2%)
- Polish: 167 (3.5%)
- Portuguese: 139 (2.9%)
- Brazilian: 123 (2.6%)
- Scottish: 108 (2.3%)
- Swedish: 96 (2.0%)
- European: 76 (1.6%)
- British: 56 (1.2%)
- Romanian: 49 (1.0%)
- Scandinavian: 41 (0.9%)
- Greek: 39 (0.8%)
- Welsh: 39 (0.8%)
- Canadian: 37 (0.8%)
- Scotch-Irish: 26 (0.5%)
- Lebanese: 25 (0.5%)
- Eastern European: 25 (0.5%)
- Danish: 17 (0.4%)
- Hungarian: 16 (0.3%)
- Haitian: 15 (0.3%)
- Czech: 12 (0.3%)
- Northern European: 8 (0.2%)
- Russian: 8 (0.2%)
Most common places of birth for foreign-born residents (%):
| Londonderry: | 18.6% (98) |
| New Hampshire: | 3.6% (2,964) |
| Londonderry: | 15.6% (82) |
| New Hampshire: | 7.0% (5,842) |
| Londonderry: | 8.9% (47) |
| New Hampshire: | 1.0% (861) |
| Londonderry: | 8.2% (43) |
| New Hampshire: | 1.9% (1,607) |
| Londonderry: | 8.0% (42) |
| New Hampshire: | 3.3% (2,742) |
| Londonderry: | 6.1% (32) |
| New Hampshire: | 9.1% (7,618) |
| Londonderry: | 5.7% (30) |
| New Hampshire: | 9.1% (7,609) |
| Londonderry: | 4.4% (23) |
| New Hampshire: | 0.8% (654) |
| Londonderry: | 4.0% (21) |
| New Hampshire: | 1.4% (1,179) |
| Londonderry: | 3.2% (17) |
| New Hampshire: | 0.2% (139) |
| Londonderry: | 2.7% (14) |
| New Hampshire: | 0.9% (735) |
| Londonderry: | 2.5% (13) |
| New Hampshire: | 1.3% (1,058) |
| Londonderry: | 2.1% (11) |
| New Hampshire: | 4.5% (3,775) |
| Londonderry: | 2.1% (11) |
| New Hampshire: | 0.4% (311) |
| Londonderry: | 1.9% (10) |
| New Hampshire: | 0.2% (131) |
| Londonderry: | 1.9% (10) |
| New Hampshire: | 1.7% (1,439) |
| Londonderry: | 1.7% (9) |
| New Hampshire: | 0.2% (134) |
Place of birth for U.S.-born residents:
- This state: 3,457
- Other state: 8,224
- Northeast: 7,064
- Midwest: 450
- South: 411
- West: 285
92.9% of Londonderry residents lived in the same house 1 years ago.
Out of people who lived in different houses, 15.2% lived in this county.
Out of people who lived in different counties, 55.5% lived in New Hampshire.
| Londonderry: | 92.9% |
| State average: | 89.8% |
Education attainment for males 25 years and older:
- No schooling: 7
- Nursery to 4th grade: 0
- 5th and 6th grade: 0
- 7th and 8th grade: 0
- 9th grade: 9
- 10th grade: 10
- 11th grade: 69
- 12th grade, no diploma: 7
- High school graduate (or equivalency): 1,083
- Less than 1 year of college: 250
- Some college more than 1 year, no degree: 383
- Associate degree: 262
- Bachelor's degree: 1,260
- Master's degree: 695
- Professional school degree: 27
- Doctorate degree: 68

Education attainment for females 25 years and older:
- No schooling: 11
- Nursery to 4th grade: 9
- 5th and 6th grade: 0
- 7th and 8th grade: 68
- 9th grade: 27
- 10th grade: 68
- 11th grade: 5
- 12th grade, no diploma: 26
- High school graduate (or equivalency): 1,238
- Less than 1 year of college: 211
- Some college more than 1 year, no degree: 510
- Associate degree: 299
- Bachelor's degree: 1,230
- Master's degree: 715
- Professional school degree: 67
- Doctorate degree: 102


Housing units in structures:
- One, detached: 2,838
- One, attached: 926
- Two: 70
- 3 or 4: 36
- 5 to 9: 267
- 10 to 19: 250
- 20 to 49: 72
- 50 or more: 132
- Mobile homes: 131
House/condo owner moved in on average 11 years ago
Renter moved in on average 3 years ago

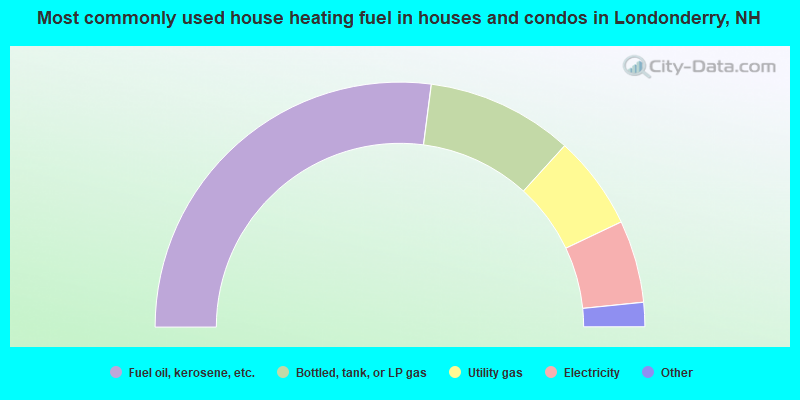
- 54.1%Fuel oil, kerosene, etc.
- 19.4%Bottled, tank, or LP gas
- 12.4%Utility gas
- 10.9%Electricity
- 2.2%Wood
- 1.0%Other fuel
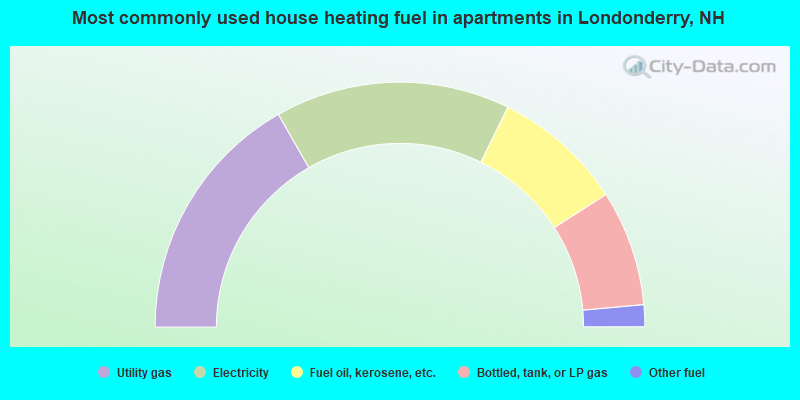
- 33.5%Utility gas
- 31.1%Electricity
- 17.3%Fuel oil, kerosene, etc.
- 15.3%Bottled, tank, or LP gas
- 2.9%Other fuel
Private vs. public school enrollment:
| Here: | 0.8% |
| New Hampshire: | 11.4% |
| Here: | 7.6% |
| New Hampshire: | 14.0% |
| Here: | 38.2% |
| New Hampshire: | 38.0% |


