Lone Grove, OK (Oklahoma) Houses and Residents
| Lone Grove: | $189,564 |
| Oklahoma: | $191,700 |
Mean price in 2022:
Detached houses: $217,213
Here: $217,213 State: $255,409 Mobile homes: $82,507
Here: $82,507 State: $110,804
Total population: 5,211 (Urban population: 0, Rural population: 4,747 (6 farm, 4,741 nonfarm))
Houses: 1,965 (1,858 occupied: 1,305 owner occupied, 586 renter occupied)
| % of renters here: | 31% |
| State: | 35% |
Housing density: 70 houses/condos per square mile
Median price asked for vacant for-sale houses and condos in 2022: $388,215.
Median contract rent in 2022: $711 (lower quartile is $509, upper quartile is $853)
Median rent asked for vacant for-rent units in 2022: $5,012
Median gross rent in Lone Grove, OK in 2022: $947
Housing units in Lone Grove with a mortgage: 734 (18 second mortgage, 0 home equity loan, 12 both second mortgage and home equity loan)
Houses without a mortgage: 0
Median household income for houses/condos with a mortgage: $86,551
Median household income for apartments without a mortgage: $47,759
Median monthly housing costs: $933
Compare current foreclosures near Lone Grove, OK:
| Photo | Address | Area | Beds / Baths | Price | Details |
|---|---|---|---|---|---|

|
#1
Us Highway 70
Lone Grove, OK 73443
|
1,612 sq. feet
|
2 baths 3 beds |
show details | |

|
#2
Cody St
Lone Grove, OK 73443
|
1,122 sq. feet
|
2 baths 3 beds |
show details | |

|
#3
Evergreen St
Lone Grove, OK 73443
|
- sq. feet
|
2 baths 3 beds |
show details | |

|
#4
Cheek Rd
Lone Grove, OK 73443
|
- sq. feet
|
- baths - beds |
show details | |

|
#5
Newport Rd
Lone Grove, OK 73443
|
- sq. feet
|
- baths - beds |
show details | |

|
#6
Main St
Lone Grove, OK 73443
|
- sq. feet
|
- baths - beds |
show details | |

|
#7
Newport Rd
Lone Grove, OK 73443
|
- sq. feet
|
- baths - beds |
show details | |

|
#8
Hewitt St
Lone Grove, OK 73443
|
- sq. feet
|
- baths - beds |
show details | |

|
#9
Rounsaville Ave
Lone Grove, OK 73443
|
- sq. feet
|
- baths - beds |
show details | |

|
#10
Melody Ln
Lone Grove, OK 73443
|
- sq. feet
|
- baths - beds |
show details |
| Photo | Address | Area | Beds / Baths | Price | Details |
|---|---|---|---|---|---|

|
#11
Park St
Lone Grove, OK 73443
|
- sq. feet
|
- baths - beds |
show details | |

|
#12
Springdale Rd
Ardmore, OK 73401
|
3,296 sq. feet
|
2 baths 4 beds |
show details | |

|
#13
C St SE
Ardmore, OK 73401
|
1,830 sq. feet
|
2 baths 2 beds |
show details | |

|
#14
Dogwood Rd
Ardmore, OK 73401
|
1,367 sq. feet
|
2 baths 3 beds |
show details | |

|
#15
Maxwell St NW
Ardmore, OK 73401
|
1,178 sq. feet
|
2 baths 3 beds |
show details | |

|
#16
S St NE
Ardmore, OK 73401
|
1,792 sq. feet
|
2 baths 4 beds |
show details | |

|
#17
Hidden Path
Ardmore, OK 73401
|
1,394 sq. feet
|
2 baths 3 beds |
show details | |

|
#18
Park St SE
Ardmore, OK 73401
|
940 sq. feet
|
1 baths 2 beds |
show details | |

|
#19
B St SE
Ardmore, OK 73401
|
811 sq. feet
|
1 baths 2 beds |
show details | |

|
#20
Ponderosa Rd
Ardmore, OK 73401
|
1,568 sq. feet
|
2 baths 4 beds |
show details |
| Photo | Address | Area | Beds / Baths | Price | Details |
|---|---|---|---|---|---|

|
#21
P St SW
Ardmore, OK 73401
|
1,844 sq. feet
|
2 baths 3 beds |
show details | |

|
#22
Windsor Dr
Ardmore, OK 73401
|
1,228 sq. feet
|
2 baths 2 beds |
show details | |

|
#23
1st Ave NW
Ardmore, OK 73401
|
836 sq. feet
|
1 baths 2 beds |
show details | |

|
#24
Stanley St SW
Ardmore, OK 73401
|
1,602 sq. feet
|
2 baths 3 beds |
show details | |

|
#25
Tower Dr
Ardmore, OK 73401
|
1,144 sq. feet
|
1 baths 3 beds |
show details | |

|
#26
R St SW
Ardmore, OK 73401
|
980 sq. feet
|
1 baths 2 beds |
show details | |

|
#27
Bethel Rd
Ardmore, OK 73401
|
1,104 sq. feet
|
2 baths 3 beds |
show details | |

|
#28
Mockingbird Rd
Ardmore, OK 73401
|
1,446 sq. feet
|
2 baths 3 beds |
show details | |

|
#29
Lucille St
Healdton, OK 73438
|
- sq. feet
|
- baths - beds |
show details | |

|
#30
Killarney Lake Rd
Ardmore, OK 73401
|
- sq. feet
|
- baths - beds |
show details |
| Photo | Address | Area | Beds / Baths | Price | Details |
|---|---|---|---|---|---|

|
#31
Vickrey St
Healdton, OK 73438
|
- sq. feet
|
- baths - beds |
show details | |

|
#32
Quail Dr
Healdton, OK 73438
|
- sq. feet
|
- baths - beds |
show details | |

|
#33
Sparrow St
Ardmore, OK 73401
|
- sq. feet
|
- baths - beds |
show details | |

|
#34
Hammers Rd
Ardmore, OK 73401
|
- sq. feet
|
- baths - beds |
show details | |

|
#35
Ponderosa Rd
Ardmore, OK 73401
|
- sq. feet
|
- baths - beds |
show details | |

|
#36
Machell St
Ardmore, OK 73401
|
- sq. feet
|
- baths - beds |
show details | |

|
#37
3rd Ave NE
Ardmore, OK 73401
|
- sq. feet
|
- baths - beds |
show details | |

|
#38
Ash St
Wilson, OK 73463
|
- sq. feet
|
- baths - beds |
show details | |

|
#39
E Main St
Ardmore, OK 73401
|
- sq. feet
|
- baths - beds |
show details | |

|
#40
D St NW
Ardmore, OK 73401
|
- sq. feet
|
- baths - beds |
show details |
| Photo | Address | Area | Beds / Baths | Price | Details |
|---|---|---|---|---|---|

|
#41
Hammers Rd
Ardmore, OK 73401
|
- sq. feet
|
- baths - beds |
show details | |

|
#42
Valley Ranch Rd
Ardmore, OK 73401
|
- sq. feet
|
- baths - beds |
show details | |

|
#43
State Highway 53
Ardmore, OK 73401
|
- sq. feet
|
- baths - beds |
show details | |

|
Check over 1 million property listings on Foreclosure.com!
|
browse all offers | |||


 | Moving to Ardmore quick. Rent help needed! (3 replies) |
| Water Quality in Lone Grove (by Ardmore) (5 replies) |
| Ardmore area (7 replies) |
| Red Dirt Ready--a message from the Oklahoma Department of Homeland Security (2 replies) |
| Crikey, another earthquake! (26 replies) |
| For everyone who is paranoid about tornados (14 replies) |

Median year apartment built: 1981
Household type by relationship:
Households: 5,088- Male householders: 920 (219 living alone), Female householders: 934 (263 living alone)
866 spouses (866 opposite-sex spouses), 174 unmarried partners, (159 opposite-sex unmarried partners), 1,677 children (1,488 natural, 41 adopted, 147 stepchildren), 216 grandchildren, 41 brothers or sisters, 18 parents, 0 foster children, 43 other relatives, 176 non-relatives
- In group quarters: 19
Size of family households: 498 2-persons, 361 3-persons, 306 4-persons, 84 5-persons, 50 6-persons, 28 7-or-more-persons.
Size of nonfamily households: 488 1-person, 74 2-persons.
748 married couples with children.
455 single-parent households (200 men, 255 women).
98.0% of residents of Lone Grove speak English at home.
1.3% of residents speak Spanish at home (100% speak English very well).
0.5% of residents speak other Indo-European language at home (100% speak English very well).
Foreign born population: 64 (1.3%)
(51.6% of them are naturalized citizens)
| Here: | 6.0 |
| State: | 6.1 |
| Here: | 4.3 |
| State: | 4.5 |

- Bedrooms in owner-occupied houses and condos in Lone Grove, Oklahoma
- 0no bedroom
- 521 bedroom
- 2302 bedrooms
- 7363 bedrooms
- 2684 bedrooms
- 215+ bedrooms

- Bedrooms in renter-occupied apartments in Lone Grove, Oklahoma
- 0no bedroom
- 501 bedroom
- 3262 bedrooms
- 1943 bedrooms
- 174 bedrooms
- 05+ bedrooms

- Cars and other vehicles available in Lone Grove in owner-occupied houses/condos
- 9no vehicle
- 2241 vehicle
- 6312 vehicles
- 2883 vehicles
- 1084 vehicles
- 445+ vehicles

- Cars and other vehicles available in Lone Grove in renter-occupied apartments
- 6no vehicle
- 2931 vehicle
- 2012 vehicles
- 743 vehicles
- 114 vehicles
- 05+ vehicles

- Rooms in owner-occupied houses in Lone Grove, Oklahoma
- 01 room
- 402 rooms
- 433 rooms
- 1234 rooms
- 2595 rooms
- 3496 rooms
- 2667 rooms
- 1508 rooms
- 759+ rooms

- Rooms in renter-occupied apartments in Lone Grove, Oklahoma
- 01 room
- 342 rooms
- 593 rooms
- 2544 rooms
- 1205 rooms
- 686 rooms
- 297 rooms
- 238 rooms
- 09+ rooms


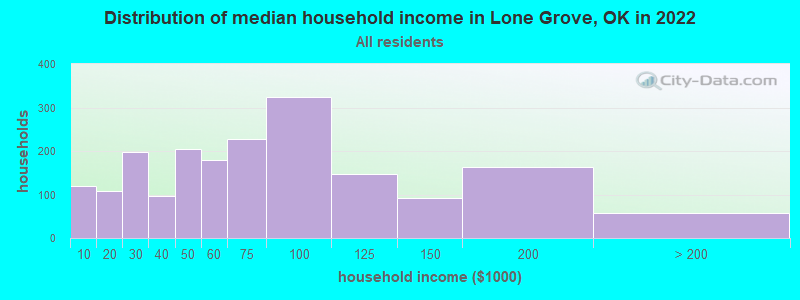
Lone Grove, OK household income distribution

- 120Less than $10,000
- 108$10,000 to $19,999
- 198$20,000 to $29,999
- 96$30,000 to $39,999
- 204$40,000 to $49,999
- 179$50,000 to $59,999
- 227$60,000 to $74,999
- 324$75,000 to $99,999
- 147$100,000 to $124,999
- 91$125,000 to $149,999
- 163$150,000 to $199,999
- 58$200,000 or more
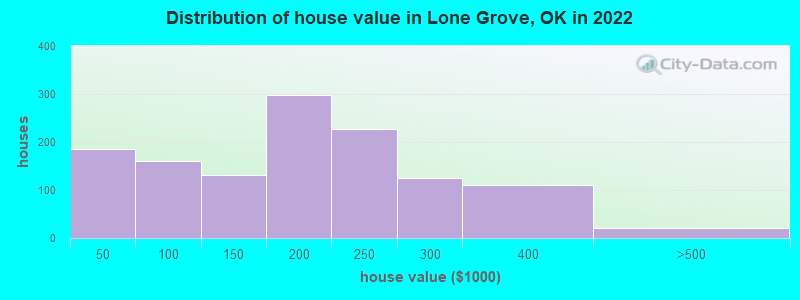
Home value of owner - occupied houses in 2022 in Lone Grove, OK
-
- 133Less than $10,000
- 8$10,000 to $14,999
- 35$15,000 to $19,999
- 8$30,000 to $34,999
- 26$50,000 to $59,999
- 19$60,000 to $69,999
- 1$70,000 to $79,999
- 50$80,000 to $89,999
- 62$90,000 to $99,999
- 99$100,000 to $124,999
- 31$125,000 to $149,999
- 142$150,000 to $174,999
- 154$175,000 to $199,999
- 228$200,000 to $249,999
- 125$250,000 to $299,999
- 109$300,000 to $399,999
- 20$400,000 to $499,999
Rent paid by renters in 2022 in Lone Grove, OK
-
- 7Less than $100
- 9$100 to $149
- 17$150 to $199
- 2$250 to $299
- 22$300 to $349
- 21$400 to $449
- 48$450 to $499
- 20$500 to $549
- 45$550 to $599
- 43$600 to $649
- 16$650 to $699
- 42$700 to $749
- 60$750 to $799
- 111$800 to $899
- 22$900 to $999
- 41$1,000 to $1,249
- 16$1,250 to $1,499
- 36No cash rent


Percentage of workers working in this county: 89.0%
Number of people working at home: 42 (1.7% of all workers)
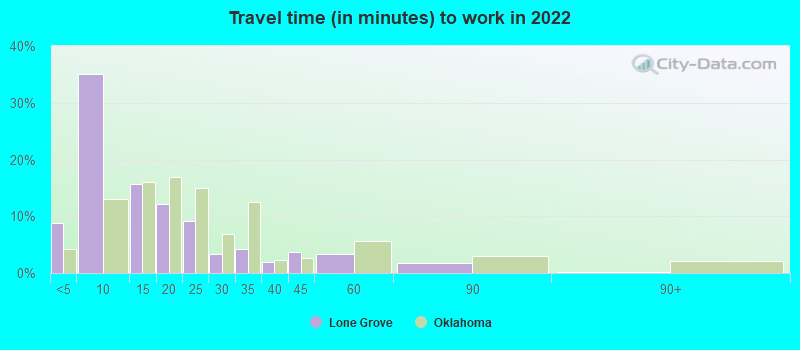
Travel time to work (commute)
- Less than 5 minutes: 59
- 5 to 9 minutes: 394
- 10 to 14 minutes: 481
- 15 to 19 minutes: 525
- 20 to 24 minutes: 247
- 25 to 29 minutes: 192
- 30 to 34 minutes: 167
- 35 to 39 minutes: 54
- 40 to 44 minutes: 20
- 45 to 59 minutes: 29
- 60 to 89 minutes: 86
- 90 or more minutes: 55
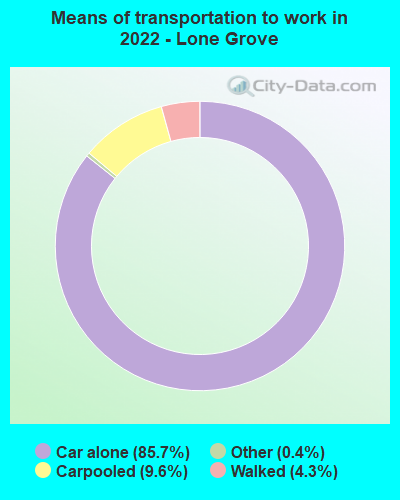
Means of transportation to work:
- Drove a car alone: 731 (80.7%)
- Carpooled: 83 (9.2%)
- Taxi: 2 (0.2%)
- Walked: 37 (4.1%)
- Worked at home: 42 (4.6%)

- Unemployment by race in 2022
- Unemployment rate for White non-Hispanic residents
- 2.5%Males
- 1.7%Females
- Unemployment rate for Black residents
- 30.1%Males
- Unemployment rate for other race residents
- 39.7%Males
- Unemployment rate for two or more race residents
- 10.9%Females
- Unemployment rate for Hispanic or Latino residents
- 10.0%Males

- Year of entry for the foreign-born population in Lone Grove, Oklahoma
- 122010 or later
- 192000 to 2009
- 81990 to 1999
- 71980 to 1989
- 01970 to 1979
- 0Before 1970

First ancestries reported:
- Irish: 244 (10.0%)
- Scottish: 176 (7.2%)
- American: 161 (6.6%)
- English: 151 (6.2%)
- Italian: 110 (4.5%)
- German: 101 (4.1%)
- Norwegian: 53 (2.2%)
- Jamaican: 43 (1.8%)
- French: 37 (1.5%)
- European: 19 (0.8%)
- African: 13 (0.5%)
- Lithuanian: 12 (0.5%)
- Canadian: 9 (0.4%)
- Russian: 9 (0.4%)
- Swedish: 8 (0.3%)
- Scotch-Irish: 6 (0.2%)
Most common places of birth for foreign-born residents (%):
| Lone Grove: | 45.3% (29) |
| Oklahoma: | 0.2% (590) |
| Lone Grove: | 23.4% (15) |
| Oklahoma: | 2.0% (4,771) |
| Lone Grove: | 15.6% (10) |
| Oklahoma: | 2.3% (5,671) |
| Lone Grove: | 14.1% (9) |
| Oklahoma: | 0.5% (1,321) |
| Lone Grove: | 10.9% (7) |
| Oklahoma: | 2.3% (5,498) |
Place of birth for U.S.-born residents:
- This state: 3,304
- Other state: 1,654
- Northeast: 22
- Midwest: 307
- South: 947
- West: 376
87.1% of Lone Grove residents lived in the same house 1 years ago.
Out of people who lived in different houses, 38.9% lived in this county.
Out of people who lived in different counties, 61.3% lived in Oklahoma.
| Lone Grove: | 87.1% |
| State average: | 85.5% |
Education attainment for males 25 years and older:
- No schooling: 6
- Nursery to 4th grade: 0
- 5th and 6th grade: 29
- 7th and 8th grade: 36
- 9th grade: 0
- 10th grade: 46
- 11th grade: 49
- 12th grade, no diploma: 0
- High school graduate (or equivalency): 461
- Less than 1 year of college: 255
- Some college more than 1 year, no degree: 307
- Associate degree: 67
- Bachelor's degree: 204
- Master's degree: 62
- Professional school degree: 0
- Doctorate degree: 17

Education attainment for females 25 years and older:
- No schooling: 0
- Nursery to 4th grade: 0
- 5th and 6th grade: 0
- 7th and 8th grade: 88
- 9th grade: 30
- 10th grade: 21
- 11th grade: 7
- 12th grade, no diploma: 28
- High school graduate (or equivalency): 630
- Less than 1 year of college: 124
- Some college more than 1 year, no degree: 252
- Associate degree: 182
- Bachelor's degree: 122
- Master's degree: 125
- Professional school degree: 0
- Doctorate degree: 0


Housing units in structures:
- One, detached: 1,368
- One, attached: 31
- Two: 12
- 3 or 4: 8
- 20 to 49: 43
- 50 or more: 7
- Mobile homes: 455
- Boats, RVs, vans, etc.: 39
Housing units lacking complete kitchen facilities in 2022: 3.0%
House/condo owner moved in on average 10 years ago
Renter moved in on average 4 years ago

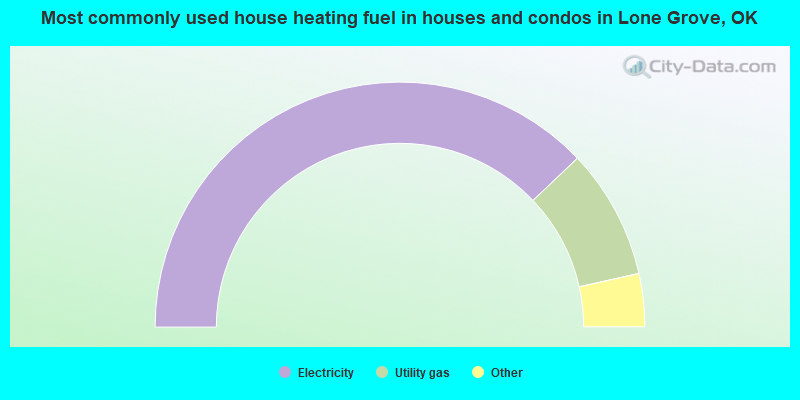
- 75.9%Electricity
- 17.2%Utility gas
- 2.5%Bottled, tank, or LP gas
- 2.3%Wood
- 2.1%Other fuel
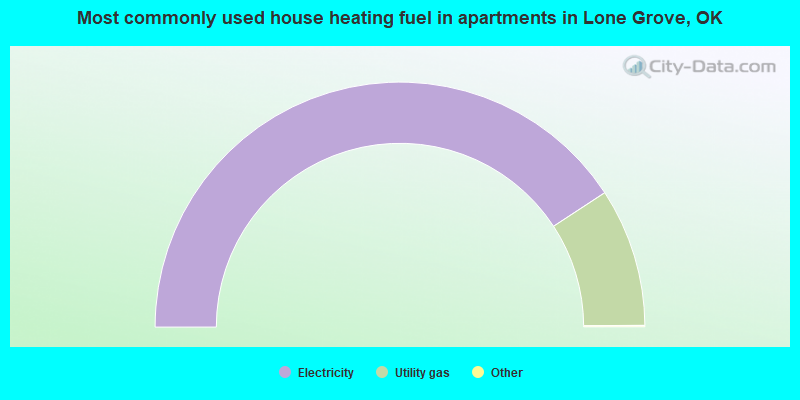
- 81.7%Electricity
- 18.3%Utility gas
Private vs. public school enrollment:
| Here: | 2.1% |
| Oklahoma: | 11.7% |
| Here: | 0.0% |
| Oklahoma: | 11.7% |
| Here: | 0.0% |
| Oklahoma: | 19.3% |


