Lone Oak, KY (Kentucky) Houses and Residents
| Lone Oak: | $169,889 |
| Kentucky: | $196,300 |
Total population: 443 (All urban)
Houses: 260 (225 occupied: 108 owner occupied, 117 renter occupied)
| % of renters here: | 52% |
| State: | 31% |
Housing density: 1,021 houses/condos per square mile
Median price asked for vacant for-sale houses and condos in 2022 in this county: $83,343.
Median contract rent in 2022: $757 (lower quartile is $631, upper quartile is $826)
Median rent asked for vacant for-rent units in 2022: $720
Median gross rent in Lone Oak, KY in 2022: $893
Housing units in Lone Oak with a mortgage: 56 (8 second mortgage, 4 home equity loan, 0 both second mortgage and home equity loan)
Houses without a mortgage: 41
Compare current foreclosures near Lone Oak, KY:
| Photo | Address | Area | Beds / Baths | Price | Details |
|---|---|---|---|---|---|

|
#1
Us Highway 60 W
Ledbetter, KY 42058
|
1,365 sq. feet
|
1 baths 3 beds |
show details | |

|
#2
Country Club Est
La Center, KY 42056
|
2,147 sq. feet
|
1 baths 2 beds |
show details | |

|
#3
Forest Cir
Paducah, KY 42001
|
1,618 sq. feet
|
2 baths 3 beds |
show details | |

|
#4
Shelly Dr
Ledbetter, KY 42058
|
1,163 sq. feet
|
1 baths 3 beds |
show details | |

|
#5
Carson Way
Paducah, KY 42003
|
2,610 sq. feet
|
4 baths 5 beds |
show details | |

|
#6
Greenfield Dr
Paducah, KY 42003
|
2,488 sq. feet
|
2 baths 3 beds |
show details | |

|
#7
Ogden Landing Rd
West Paducah, KY 42086
|
1,500 sq. feet
|
1 baths 3 beds |
show details | |

|
#8
Congress Aly
Smithland, KY 42081
|
1,369 sq. feet
|
1 baths 2 beds |
show details | |

|
#9
Geraldine Dr
Paducah, KY 42003
|
1,775 sq. feet
|
2 baths 3 beds |
show details | |

|
#10
Jarvis Ln
Symsonia, KY 42082
|
2,184 sq. feet
|
2 baths 3 beds |
show details |
| Photo | Address | Area | Beds / Baths | Price | Details |
|---|---|---|---|---|---|

|
#11
Culp Rd
Paducah, KY 42003
|
1,778 sq. feet
|
1 baths 3 beds |
show details | |

|
#12
Old Hinkleville Rd
Kevil, KY 42053
|
2,548 sq. feet
|
2 baths 3 beds |
show details | |

|
#13
Sharon Dr
Ledbetter, KY 42058
|
1,960 sq. feet
|
2 baths 3 beds |
show details | |

|
#14
Sharon Dr
Ledbetter, KY 42058
|
1,175 sq. feet
|
1 baths 3 beds |
show details | |

|
#15
Sharon Dr
Ledbetter, KY 42058
|
1,620 sq. feet
|
2 baths 3 beds |
show details | |

|
#16
Sharon Dr
Ledbetter, KY 42058
|
1,190 sq. feet
|
1 baths 3 beds |
show details | |

|
#17
Wilton Cir
Paducah, KY 42003
|
1,482 sq. feet
|
2 baths 3 beds |
show details | |

|
#18
Kentucky Dam Rd
Paducah, KY 42003
|
2,088 sq. feet
|
1 baths 3 beds |
show details | |

|
#19
Watson Rd
Paducah, KY 42003
|
1,737 sq. feet
|
2 baths 3 beds |
show details | |

|
#20
Greyhound Cir
Paducah, KY 42003
|
1,591 sq. feet
|
2 baths 3 beds |
show details |
| Photo | Address | Area | Beds / Baths | Price | Details |
|---|---|---|---|---|---|

|
#21
Skyline Dr
West Paducah, KY 42086
|
2,758 sq. feet
|
2 baths 4 beds |
show details | |

|
#22
W 10th St
Metropolis, IL 62960
|
- sq. feet
|
1 baths 3 beds |
show details | |

|
#23
Center St
Paducah, KY 42003
|
1 sq. feet
|
1 baths 3 beds |
show details | |

|
#24
Harris Rd
Paducah, KY 42001
|
1,983 sq. feet
|
4 baths 6 beds |
show details | |

|
#25
Myrna Dr
Paducah, KY 42003
|
1,342 sq. feet
|
2 baths 3 beds |
show details | |

|
#26
Little Cypress Rd
Calvert City, KY 42029
|
725 sq. feet
|
1 baths 2 beds |
show details | |

|
#27
N 23rd St
Paducah, KY 42001
|
1,120 sq. feet
|
1 baths 3 beds |
show details | |

|
#28
Tuck Rd
Paducah, KY 42001
|
1,526 sq. feet
|
2 baths 3 beds |
show details | |

|
#29
Clay St
Paducah, KY 42001
|
1,319 sq. feet
|
1 baths 3 beds |
show details | |

|
#30
Harrison St
Paducah, KY 42001
|
1,800 sq. feet
|
1 baths 3 beds |
show details |
| Photo | Address | Area | Beds / Baths | Price | Details |
|---|---|---|---|---|---|

|
#31
N 24th St
Paducah, KY 42001
|
1,987 sq. feet
|
1 baths 3 beds |
show details | |

|
#32
Gholson Rd
Paducah, KY 42001
|
968 sq. feet
|
1 baths 2 beds |
show details | |

|
#33
Cold Springs Rd
Paducah, KY 42003
|
2,318 sq. feet
|
2 baths 3 beds |
show details | |

|
#34
Lakeview Dr
Ledbetter, KY 42058
|
1,755 sq. feet
|
1 baths 3 beds |
show details | |

|
#35
Loretta Dr
Ledbetter, KY 42058
|
1,790 sq. feet
|
2 baths 2 beds |
show details | |

|
#36
Rebecca Ln
Paducah, KY 42001
|
1,491 sq. feet
|
2 baths 3 beds |
show details | |

|
#37
Six Oaks Dr
Paducah, KY 42003
|
2,240 sq. feet
|
2 baths 3 beds |
show details | |

|
#38
Us Highway 68 W
Benton, KY 42025
|
1,776 sq. feet
|
1 baths 3 beds |
show details | |

|
#39
Woodville Rd
Kevil, KY 42053
|
1,749 sq. feet
|
1 baths - beds |
show details | |

|
#40
Hodge Landing Rd
Ledbetter, KY 42058
|
1,125 sq. feet
|
1 baths 3 beds |
show details |
| Photo | Address | Area | Beds / Baths | Price | Details |
|---|---|---|---|---|---|

|
#41
Beasley Loop
Hickory, KY 42051
|
906 sq. feet
|
1 baths 2 beds |
show details | |

|
#42
Camelot Dr
Calvert City, KY 42029
|
1,760 sq. feet
|
2 baths 2 beds |
show details | |

|
#43
Illinois St
Paducah, KY 42003
|
- sq. feet
|
2 baths 4 beds |
show details | |

|
#44
Wayne Freeman Rd
Benton, KY 42025
|
2,601 sq. feet
|
2 baths 3 beds |
show details | |

|
#45
Us Highway 60 W
Smithland, KY 42081
|
1,600 sq. feet
|
1 baths 3 beds |
show details | |

|
#46
Industrial Pkwy
Calvert City, KY 42029
|
1,128 sq. feet
|
2 baths 3 beds |
show details | |

|
#47
Price St
Hickory, KY 42051
|
1,347 sq. feet
|
2 baths 4 beds |
show details | |

|
#48
Longview Dr
Paducah, KY 42001
|
1,545 sq. feet
|
1 baths 3 beds |
show details | |

|
#49
Sophia St
Hickory, KY 42051
|
1,032 sq. feet
|
1 baths 2 beds |
show details | |

|
Check over 1 million property listings on Foreclosure.com!
|
browse all offers | |||

 | Need a rental house ASAP in W Kentucky-prefer lakefront or lake area $1200-$1500 mo budget. (1 reply) |
| Moving to Paducah, Kentucky (16 replies) |
| Desperately Seeking Kentucky!! (25 replies) |
| Paducah in the news. (29 replies) |
| Moving to GA, KY or similar? (12 replies) |
| Paducah (7 replies) |

Household type by relationship:
Households: 64,376- In family households: 52,398 (12,622 male householders, 5,269 female householders)
13,191 spouses, 16,968 children (15,417 natural, 460 adopted, 1,091 stepchildren), 1,401 grandchildren, 410 brothers or sisters, 402 parents, foster children, 579 other relatives, 1,319 non-relatives
- In nonfamily households: 11,978 (4,526 male householders (3,763 living alone)), 5,810 female householders (5,230 living alone)), 1,642 nonrelatives
- In group quarters: 1,189 (1,032 institutionalized population)
9,745 married couples with children.
4,234 single-parent households (724 men, 3,510 women).
90.7% of residents of Lone Oak speak English at home.
9.3% of residents speak Spanish at home (87% speak English very well, 2% speak English well, 11% speak English not well).
Foreign born population: 24 (4.6%)
(87.5% of them are naturalized citizens)
| Here: | 5.7 |
| State: | 6.4 |
| Here: | 4.4 |
| State: | 4.4 |

- Bedrooms in owner-occupied houses and condos in Lone Oak, Kentucky
- 0no bedroom
- 51 bedroom
- 372 bedrooms
- 523 bedrooms
- 114 bedrooms
- 35+ bedrooms

- Bedrooms in renter-occupied apartments in Lone Oak, Kentucky
- 0no bedroom
- 261 bedroom
- 672 bedrooms
- 153 bedrooms
- 94 bedrooms
- 05+ bedrooms

- Cars and other vehicles available in Lone Oak in owner-occupied houses/condos
- 2no vehicle
- 351 vehicle
- 422 vehicles
- 233 vehicles
- 34 vehicles
- 35+ vehicles

- Cars and other vehicles available in Lone Oak in renter-occupied apartments
- 14no vehicle
- 641 vehicle
- 322 vehicles
- 43 vehicles
- 04 vehicles
- 35+ vehicles

- Rooms in owner-occupied houses in Lone Oak, Kentucky
- 01 room
- 02 rooms
- 23 rooms
- 164 rooms
- 335 rooms
- 296 rooms
- 107 rooms
- 68 rooms
- 129+ rooms

- Rooms in renter-occupied apartments in Lone Oak, Kentucky
- 01 room
- 22 rooms
- 263 rooms
- 484 rooms
- 165 rooms
- 146 rooms
- 77 rooms
- 48 rooms
- 09+ rooms


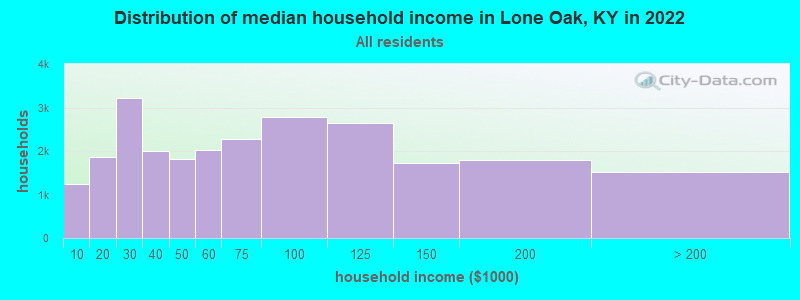
Lone Oak, KY household income distribution

- 1,249Less than $10,000
- 1,856$10,000 to $19,999
- 3,213$20,000 to $29,999
- 1,994$30,000 to $39,999
- 1,823$40,000 to $49,999
- 2,026$50,000 to $59,999
- 2,271$60,000 to $74,999
- 2,789$75,000 to $99,999
- 2,643$100,000 to $124,999
- 1,722$125,000 to $149,999
- 1,804$150,000 to $199,999
- 1,521$200,000 or more
Percentage of workers working in this county: 92.1%
Number of people working at home: 33 (11.3% of all workers)
Travel time to work (commute)
- Less than 5 minutes: 2
- 5 to 9 minutes: 43
- 10 to 14 minutes: 69
- 15 to 19 minutes: 57
- 20 to 24 minutes: 31
- 25 to 29 minutes: 3
- 30 to 34 minutes: 15
- 35 to 39 minutes: 0
- 40 to 44 minutes: 2
- 45 to 59 minutes: 0
- 60 to 89 minutes: 6
- 90 or more minutes: 0
Means of transportation to work:
- Drove a car alone: 191 (79.3%)
- Carpooled: 21 (8.7%)
- Walked: 7 (2.9%)
- Other means: 9 (3.7%)
- Worked at home: 13 (5.4%)


- Year of entry for the foreign-born population in Lone Oak, Kentucky
- 51995 to March 2000
- 01990 to 1994
- 01985 to 1989
- 91980 to 1984
- 21975 to 1979
- 01970 to 1974
- 41965 to 1969
- 4Before 1965
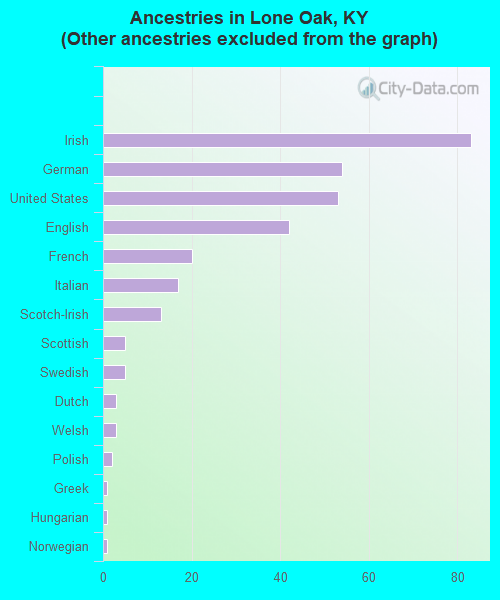
First ancestries reported:
- Other: 120 (28.4%)
- Irish: 83 (19.6%)
- German: 54 (12.8%)
- United States: 53 (12.5%)
- English: 42 (9.9%)
- French: 20 (4.7%)
- Italian: 17 (4.0%)
- Scotch-Irish: 13 (3.1%)
- Scottish: 5 (1.2%)
- Swedish: 5 (1.2%)
- Dutch: 3 (0.7%)
- Welsh: 3 (0.7%)
- Polish: 2 (0.5%)
- Greek: 1 (0.2%)
- Hungarian: 1 (0.2%)
- Norwegian: 1 (0.2%)
Most common places of birth for foreign-born residents (%):
| Lone Oak: | 33.3% (8) |
| Kentucky: | 19.3% (15,511) |
| Lone Oak: | 20.8% (5) |
| Kentucky: | 3.1% (2,459) |
| Lone Oak: | 16.7% (4) |
| Kentucky: | 4.7% (3,734) |
| Lone Oak: | 16.7% (4) |
| Kentucky: | 6.2% (4,983) |
| Lone Oak: | 12.5% (3) |
| Kentucky: | 1.5% (1,174) |
Place of birth for U.S.-born residents:
- This state: 280
- Other state: 196
- Northeast: 7
- Midwest: 77
- South: 79
- West: 33
40% of Lone Oak residents lived in the same house 5 years ago.
Out of people who lived in different houses, 64% lived in this county.
Out of people who lived in different counties, 29% lived in Kentucky.
Education attainment for males 25 years and older:
- No schooling: 0
- Nursery to 4th grade: 0
- 5th and 6th grade: 2
- 7th and 8th grade: 4
- 9th grade: 0
- 10th grade: 2
- 11th grade: 2
- 12th grade, no diploma: 3
- High school graduate (or equivalency): 73
- Less than 1 year of college: 14
- Some college more than 1 year, no degree: 16
- Associate degree: 13
- Bachelor's degree: 19
- Master's degree: 12
- Professional school degree: 0
- Doctorate degree: 0

Education attainment for females 25 years and older:
- No schooling: 0
- Nursery to 4th grade: 0
- 5th and 6th grade: 4
- 7th and 8th grade: 11
- 9th grade: 9
- 10th grade: 4
- 11th grade: 10
- 12th grade, no diploma: 2
- High school graduate (or equivalency): 58
- Less than 1 year of college: 13
- Some college more than 1 year, no degree: 16
- Associate degree: 18
- Bachelor's degree: 21
- Master's degree: 0
- Professional school degree: 3
- Doctorate degree: 0


Housing units in structures:
- One, detached: 174
- One, attached: 7
- Two: 21
- 3 or 4: 13
- 5 to 9: 12
- 10 to 19: 14
- 20 to 49: 4
- Mobile homes: 15
Median worth of mobile homes: $51,933

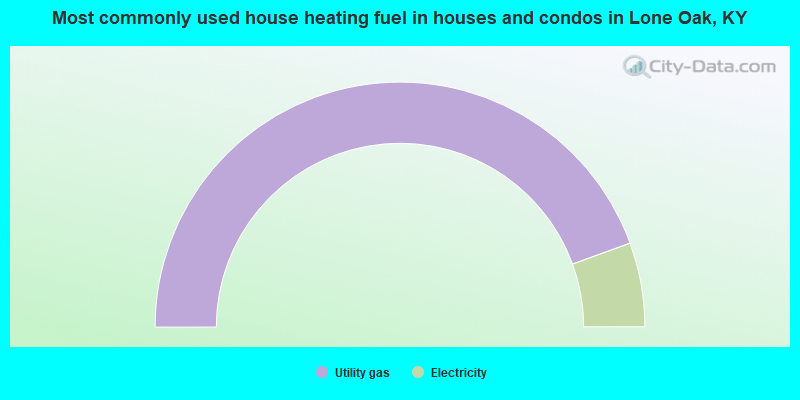
- 88.9%Utility gas
- 11.1%Electricity
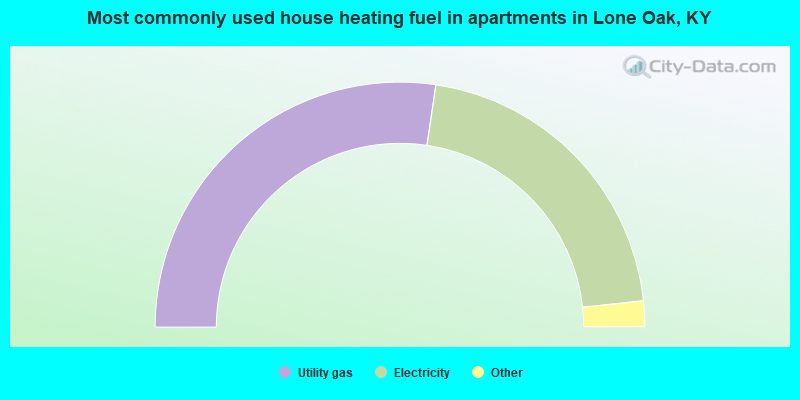
- 54.7%Utility gas
- 41.9%Electricity
- 1.7%Bottled, tank, or LP gas
- 1.7%Fuel oil, kerosene, etc.
Private vs. public school enrollment:
| Here: | 14.7% |
| Kentucky: | 11.9% |
| Here: | 0.0% |
| Kentucky: | 10.6% |
| Here: | 27.8% |
| Kentucky: | 18.1% |


