Lone Tree, CO (Colorado) Houses and Residents
Estimated median house or condo value in 2022: $855,594 (it was $293,100 in 2000 )
Lone Tree:
$855,594Colorado:
$531,100
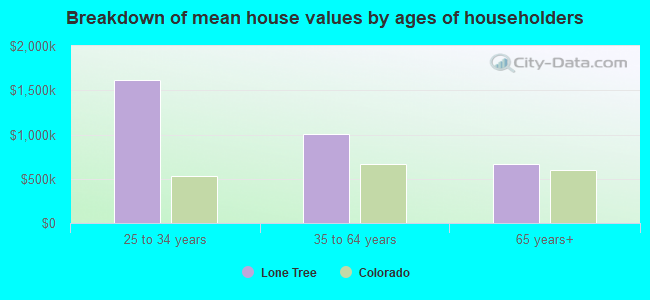
Lower value quartile - upper value quartile: $660,708 - $1,140,235Mean price in 2022: Detached houses: $1,142,089 Here:
$1,142,089State:
$676,667
Townhouses or other attached units: $671,775 Here:
$671,775State:
$526,340
In 3-to-4-unit structures: $557,808 Here:
$557,808State:
$385,502
In 5-or-more-unit structures: $407,911 Here:
$407,911State:
$417,586
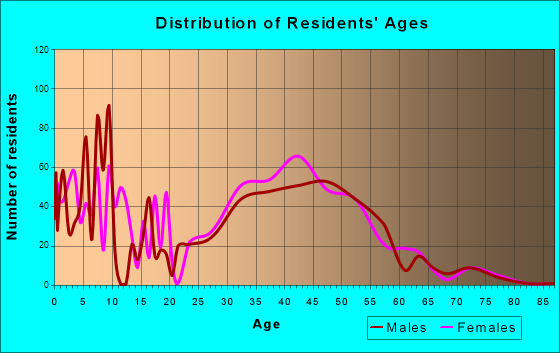
Total population: 13,545 (Urban population: 4,936, Rural population: 0)
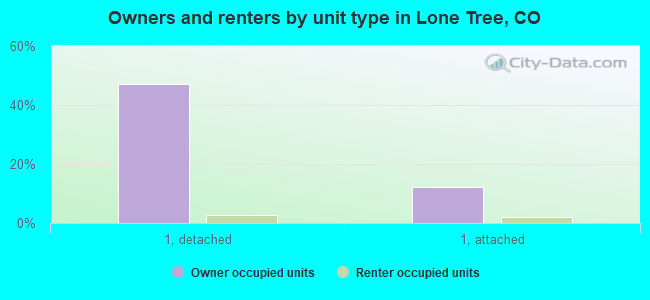
Houses: 7,003 (6,652 occupied: 3,906 owner occupied, 2,772 renter occupied )
% of renters here:
42%State:
34%
Housing density: 4,063 houses/condos per square mile
Median price asked for vacant for-sale houses and condos in 2022: $6,694,029.
Median contract rent in 2022: $1,878 (lower quartile is $1,657, upper quartile is over $2,000)
Median rent asked for vacant for-rent units in 2022: $2,370
Median gross rent in Lone Tree, CO in 2022: $1,921
Housing units in Lone Tree with a mortgage: 2,551 (396 second mortgage, 0 home equity loan, 377 both second mortgage and home equity loan )Houses without a mortgage: 40
Median household income for houses/condos with a mortgage: $209,040
Median household income for apartments without a mortgage: $101,939
Median monthly housing costs: $1,937
Data:
Median house or condo value ($)
Median house or condo value ($ change since 2000)
Median house or condo value ($) - White
Median house or condo value ($) - Black or African American
Median house or condo value ($) - Asian
Median house or condo value ($) - Hispanic or Latino
Median house or condo value ($) - American Indian and Alaska Native
Median house or condo value ($) - Multirace
Median house or condo value ($) - Other Race
Median price asked for mobile homes ($)
Household density (households per square mile)
Mean house or condo value by units in structure - 1, detached ($)
Mean house or condo value by units in structure - 1, attached ($)
Mean house or condo value by units in structure - 2 ($)
Mean house or condo value by units in structure by units in structure - 3 or 4 ($)
Mean house or condo value by units in structure - 5 or more ($)
Mean house or condo value by units in structure - Boat, RV, van, etc. ($)
Mean house or condo value by units in structure - Mobile home ($)
Median contract rent ($)
Median contract rent - Lower quartile ($)
Median contract rent - Upper quartile ($)
Median gross rent ($)
Urban houses (%)
Rural houses (%)
Houses occupied (%)
Houses occupied (% change since 2000)
Houses owner occupied (%)
Houses owner occupied (% change since 2000)
Houses renter occupied (%)
Houses renter occupied (% change since 2000)
Vacant housing units - For rent (%)
Vacant housing units - For rent (% change since 2000)
Vacant housing units - For sale only (%)
Vacant housing units - For sale only (% change since 2000)
Vacant housing units - Rented or sold, not occupied (%)
Vacant housing units - Rented or sold, not occupied (% change since 2000)
Vacant housing units - For seasonal, recreational, or occasional use (%)
Vacant housing units - For seasonal, recreational, or occasional use (% change since 2000)
Vacant housing units - For migrant workers (%)
Vacant housing units - For migrant workers (% change since 2000)
Vacant housing units - Other vacant (%)
Vacant housing units - Other vacant (% change since 2000)
Median monthly housing costs ($)
Median household income for houses/condos with a mortgage ($)
Median household income for houses/condos without a mortgage ($)
Median household income ($)
Median household income ($) - White
Median household income ($) - Black or African American
Median household income ($) - Asian
Median household income ($) - Hispanic or Latino
Median household income ($) - American Indian and Alaska Native
Median household income ($) - Multirace
Median household income ($) - Other Race
Mortgage status - with mortgage (%)
Mortgage status - with second mortgage (%)
Mortgage status - with home equity loan (%)
Mortgage status - with both second mortgage and home equity loan (%)
Mortgage status - without a mortgage (%)
Median year house/condo built
Median year apartment built
Household type by relationship - Male householder living alone (%)
Household type by relationship - Male householder not living alone (%)
Household type by relationship - Female householder living alone (%)
Household type by relationship - Female householder not living alone (%)
Household type by relationship - Opposite-Sex spouse (%)
Household type by relationship - Same-Sex spouse (%)
Household type by relationship - Opposite-Sex unmarried partner (%)
Household type by relationship - Same-Sex unmarried partner (%)
Household type by relationship - In group quarters (%)
Size of family households - 2-person household (%)
Size of family households - 3-person household (%)
Size of family households - 4-person household (%)
Size of family households - 5-person household (%)
Size of family households - 6-person household (%)
Size of family households - 7-or-more-person household (%)
Size of nonfamily households - 1-person household (%)
Size of nonfamily households - 2-person household (%)
Size of nonfamily households - 3-person household (%)
Size of nonfamily households - 4-person household (%)
Size of nonfamily households - 5-person household (%)
Size of nonfamily households - 6-person household (%)
Size of nonfamily households - 7-or-moreperson household (%)
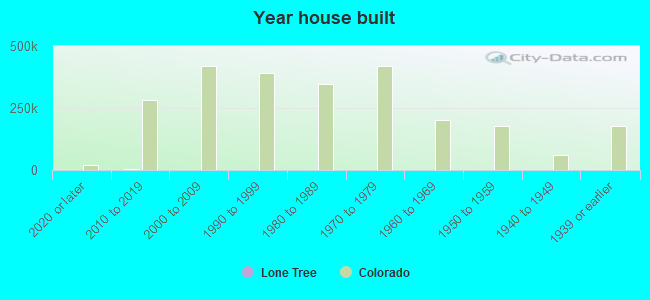
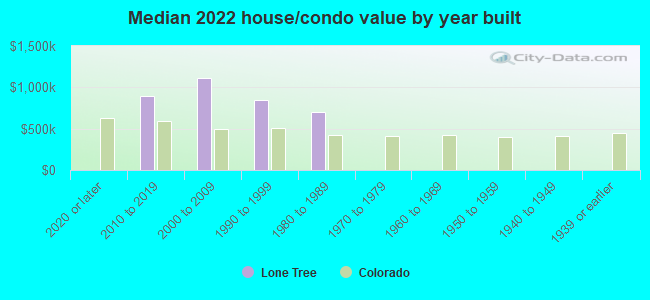
Year house built - Built 2010 or later (%)
Year house built - Built 2000 to 2009 (%)
Year house built - Built 1990 to 1999 (%)
Year house built - Built 1980 to 1989 (%)
Year house built - Built 1970 to 1979 (%)
Year house built - Built 1960 to 1969 (%)
Year house built - Built 1950 to 1959 (%)
Year house built - Built 1940 to 1949 (%)
Year house built - Built 1939 or earlier (%)
Median number of rooms in houses and condos
Median number of rooms in apartments
Median number of bedrooms in owner occupied houses
Mean number of bedrooms in owner occupied houses
Median number of bedrooms in renter occupied houses
Mean number of bedrooms in renter occupied houses
Median number of vehichles in owner occupied houses
Mean number of vehichles in owner occupied houses
Median number of vehichles in renter occupied houses
Mean number of vehichles in renter occupied houses
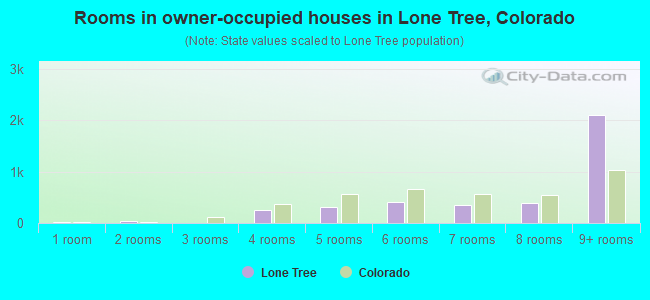
Rooms in owner-occupied houses - 1 room (%)
Rooms in owner-occupied houses - 2 rooms (%)
Rooms in owner-occupied houses - 3 rooms (%)
Rooms in owner-occupied houses - 4 rooms (%)
Rooms in owner-occupied houses - 5 rooms (%)
Rooms in owner-occupied houses - 6 rooms (%)
Rooms in owner-occupied houses - 7 rooms (%)
Rooms in owner-occupied houses - 8 rooms (%)
Rooms in owner-occupied houses - 9+ rooms (%)
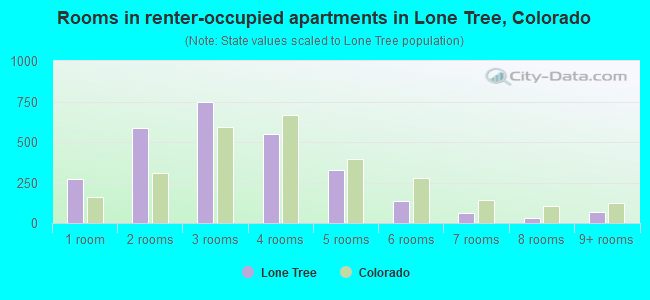
Rooms in renter-occupied houses - 1 room (%)
Rooms in renter-occupied houses - 2 rooms (%)
Rooms in renter-occupied houses - 3 rooms (%)
Rooms in renter-occupied houses - 4 rooms (%)
Rooms in renter-occupied houses - 5 rooms (%)
Rooms in renter-occupied houses - 6 rooms (%)
Rooms in renter-occupied houses - 7 rooms (%)
Rooms in renter-occupied houses - 8 rooms (%)
Rooms in renter-occupied houses - 9+ rooms (%)
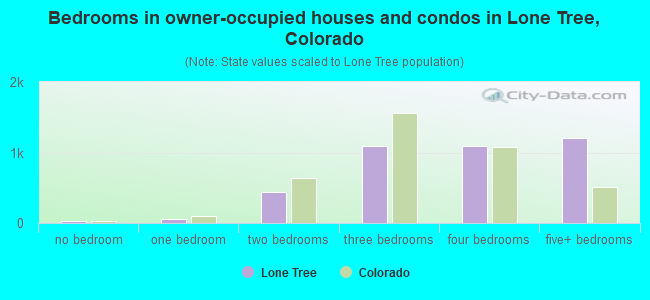
Bedrooms in owner-occupied houses - no bedrooms (%)
Bedrooms in owner-occupied houses - 1 bedroom (%)
Bedrooms in owner-occupied houses - 2 bedrooms (%)
Bedrooms in owner-occupied houses - 3 bedrooms (%)
Bedrooms in owner-occupied houses - 4 bedrooms (%)
Bedrooms in owner-occupied houses - 5+ bedrooms (%)
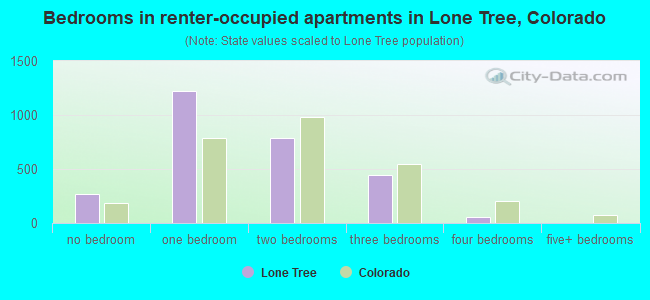
Bedrooms in renter-occupied houses - no bedrooms (%)
Bedrooms in renter-occupied houses - 1 bedroom (%)
Bedrooms in renter-occupied houses - 2 bedrooms (%)
Bedrooms in renter-occupied houses - 3 bedrooms (%)
Bedrooms in renter-occupied houses - 4 bedrooms (%)
Bedrooms in renter-occupied houses - 5+ bedrooms (%)
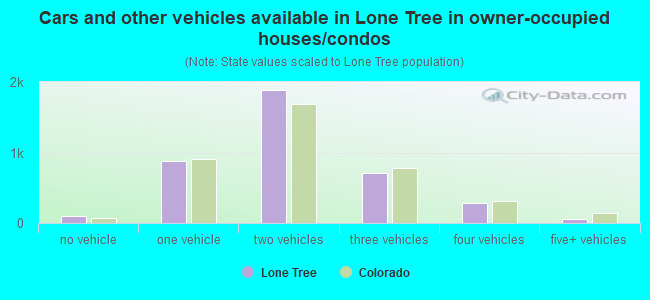
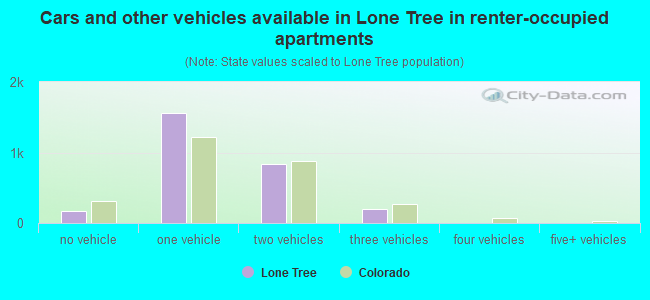
Vehicles available in owner-occupied houses - no vehicle available (%)
Vehicles available in owner-occupied houses - 1 vehicle available(%)
Vehicles available in owner-occupied houses - 2 Vehicles available (%)
Vehicles available in owner-occupied houses - 3 Vehicles available (%)
Vehicles available in owner-occupied houses - 4 Vehicles available (%)
Vehicles available in owner-occupied houses - 5+ Vehicles available (%)
Vehicles available in renter-occupied houses - no vehicle available (%)
Vehicles available in renter-occupied houses - 1 vehicle available (%)
Vehicles available in renter-occupied houses - 2 Vehicles available (%)
Vehicles available in renter-occupied houses - 3 Vehicles available (%)
Vehicles available in renter-occupied houses - 4 Vehicles available (%)
Vehicles available in renter-occupied houses - 5+ Vehicles available (%)
Housing units in structures - 1, detached (%)
Housing units in structures - 1, attached (%)
Housing units in structures - 2 (%)
Housing units in structures - 3 or 4 (%)
Housing units in structures - 5 to 9 (%)
Housing units in structures - 10 to 19 (%)
Housing units in structures - 20 to 49 (%)
Housing units in structures - 50 or more (%)
Housing units in structures - Mobile home (%)
Housing units in structures - Boat, RV, van, etc. (%)
Housing units in structures - Owners - 1, detached (%)
Housing units in structures - Owners - 1, attached (%)
Housing units in structures - Owners - 2 (%)
Housing units in structures - Owners - 3 or 4 (%)
Housing units in structures - Owners - 5 to 9 (%)
Housing units in structures - Owners - 10 to 19 (%)
Housing units in structures - Owners - 20 to 49 (%)
Housing units in structures - Owners - 50 or more (%)
Housing units in structures - Owners - Mobile home (%)
Housing units in structures - Owners - Boat, RV, van, etc. (%)
Housing units in structures - Renters - 1, detached (%)
Housing units in structures - Renters - 1, attached (%)
Housing units in structures - Renters - 2 (%)
Housing units in structures - Renters - 3 or 4 (%)
Housing units in structures - Renters - 5 to 9 (%)
Housing units in structures - Renters - 10 to 19 (%)
Housing units in structures - Renters - 20 to 49 (%)
Housing units in structures - Renters - 50 or more (%)
Housing units in structures - Renters - Mobile home (%)
Housing units in structures - Renters - Boat, RV, van, etc. (%)
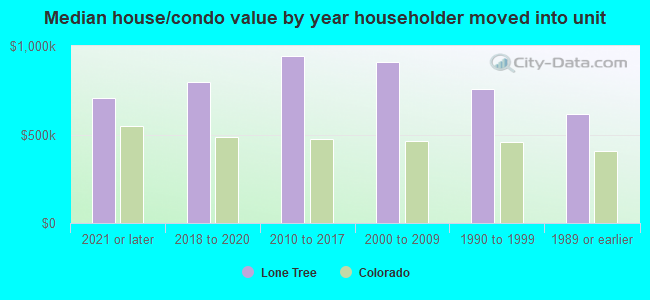
House/condo owner moved in on average (years ago)
Renter moved in on average (years ago)
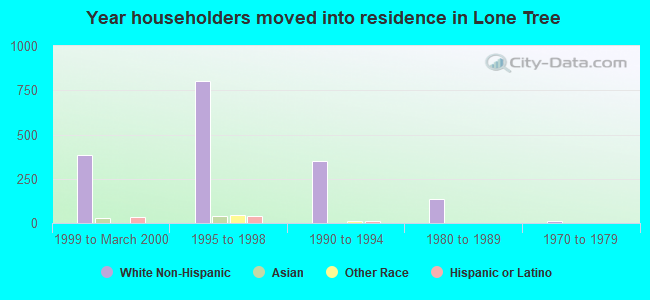
Year householder moved into unit - Moved in 1999 to March 2000 (%)
Year householder moved into unit - Moved in 1999 to March 2000 (%) - White
Year householder moved into unit - Moved in 1999 to March 2000 (%) - Black or African American
Year householder moved into unit - Moved in 1999 to March 2000 (%) - Asian
Year householder moved into unit - Moved in 1999 to March 2000 (%) - Hispanic or Latino
Year householder moved into unit - Moved in 1999 to March 2000 (%) - American Indian and Alaska Native
Year householder moved into unit - Moved in 1999 to March 2000 (%) - Multirace
Year householder moved into unit - Moved in 1999 to March 2000 (%) - Other Race
Year householder moved into unit - Moved in 1995 to 1998 (%)
Year householder moved into unit - Moved in 1995 to 1998 (%) - White
Year householder moved into unit - Moved in 1995 to 1998 (%) - Black or African American
Year householder moved into unit - Moved in 1995 to 1998 (%) - Asian
Year householder moved into unit - Moved in 1995 to 1998 (%) - Hispanic or Latino
Year householder moved into unit - Moved in 1995 to 1998 (%) - American Indian and Alaska Native
Year householder moved into unit - Moved in 1995 to 1998 (%) - Multirace
Year householder moved into unit - Moved in 1995 to 1998 (%) - Other Race
Year householder moved into unit - Moved in 1990 to 1994 (%)
Year householder moved into unit - Moved in 1990 to 1994 (%) - White
Year householder moved into unit - Moved in 1990 to 1994 (%) - Black or African American
Year householder moved into unit - Moved in 1990 to 1994 (%) - Asian
Year householder moved into unit - Moved in 1990 to 1994 (%) - Hispanic or Latino
Year householder moved into unit - Moved in 1990 to 1994 (%) - American Indian and Alaska Native
Year householder moved into unit - Moved in 1990 to 1994 (%) - Multirace
Year householder moved into unit - Moved in 1990 to 1994 (%) - Other Race
Year householder moved into unit - Moved in 1980 to 1989 (%)
Year householder moved into unit - Moved in 1980 to 1989 (%) - White
Year householder moved into unit - Moved in 1980 to 1989 (%) - Black or African American
Year householder moved into unit - Moved in 1980 to 1989 (%) - Asian
Year householder moved into unit - Moved in 1980 to 1989 (%) - Hispanic or Latino
Year householder moved into unit - Moved in 1980 to 1989 (%) - American Indian and Alaska Native
Year householder moved into unit - Moved in 1980 to 1989 (%) - Multirace
Year householder moved into unit - Moved in 1980 to 1989 (%) - Other Race
Year householder moved into unit - Moved in 1970 to 1979 (%)
Year householder moved into unit - Moved in 1970 to 1979 (%) - White
Year householder moved into unit - Moved in 1970 to 1979 (%) - Black or African American
Year householder moved into unit - Moved in 1970 to 1979 (%) - Asian
Year householder moved into unit - Moved in 1970 to 1979 (%) - Hispanic or Latino
Year householder moved into unit - Moved in 1970 to 1979 (%) - American Indian and Alaska Native
Year householder moved into unit - Moved in 1970 to 1979 (%) - Multirace
Year householder moved into unit - Moved in 1970 to 1979 (%) - Other Race
Year householder moved into unit - Moved in 1969 or earlier (%)
Year householder moved into unit - Moved in 1969 or earlier (%) - White
Year householder moved into unit - Moved in 1969 or earlier (%) - Black or African American
Year householder moved into unit - Moved in 1969 or earlier (%) - Asian
Year householder moved into unit - Moved in 1969 or earlier (%) - Hispanic or Latino
Year householder moved into unit - Moved in 1969 or earlier (%) - American Indian and Alaska Native
Year householder moved into unit - Moved in 1969 or earlier (%) - Multirace
Year householder moved into unit - Moved in 1969 or earlier (%) - Other Race
Housing units lacking complete plumbing facilities (%)
Housing units lacking complete kitchen facilities (%)
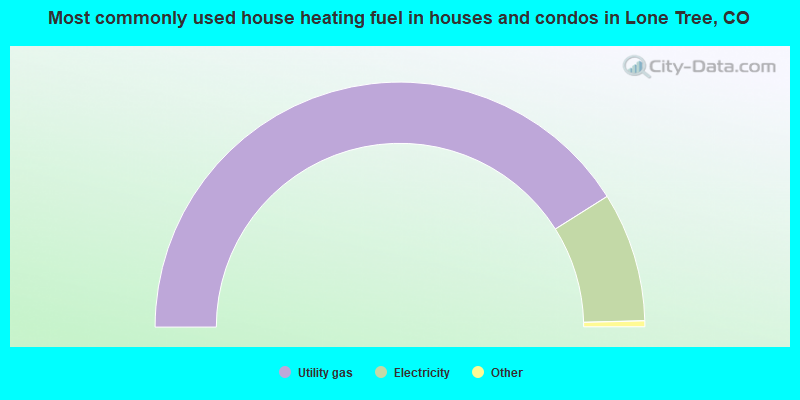
House heating fuel used in houses and condos - Utility gas (%)
House heating fuel used in houses and condos - Bottled, tank, or LP gas (%)
House heating fuel used in houses and condos - Electricity (%)
House heating fuel used in houses and condos - Fuel oil, kerosene, etc. (%)
House heating fuel used in houses and condos - Coal or coke (%)
House heating fuel used in houses and condos - Wood (%)
House heating fuel used in houses and condos - Solar energy (%)
House heating fuel used in houses and condos - Other fuel (%)
House heating fuel used in houses and condos - No fuel used (%)
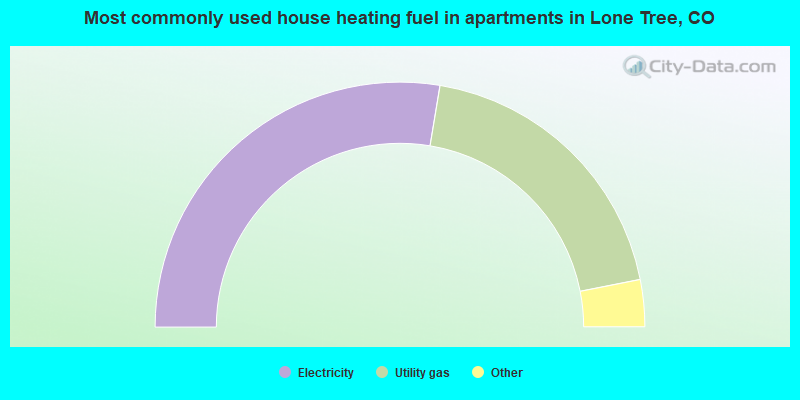
House heating fuel used in apartments - Utility gas (%)
House heating fuel used in apartments - Bottled, tank, or LP gas (%)
House heating fuel used in apartments - Electricity (%)
House heating fuel used in apartments - Fuel oil, kerosene, etc. (%)
House heating fuel used in apartments - Coal or coke (%)
House heating fuel used in apartments - Wood (%)
House heating fuel used in apartments - Solar energy (%)
House heating fuel used in apartments - Other fuel (%)
House heating fuel used in apartments - No fuel used (%)
Median year house/condo built: 1997Median year apartment built: 2013Household type by relationship:
Households: 14,606
Male householders: 3,533 (1,011 living alone ), Female householders: 3,034 (1,228 living alone )3,142 spouses (3,132 opposite-sex spouses ), 473 unmarried partners , (462 opposite-sex unmarried partners ), 3,474 children (3,450 natural , 13 adopted , 10 stepchildren ), 30 grandchildren , 77 brothers or sisters , 221 parents , 0 foster children , 249 other relatives , 337 non-relatives In group quarters: 31
Size of family households: 2,028 2-persons , 672 3-persons , 694 4-persons , 292 5-persons , 28 6-persons , 26 7-or-more-persons .
Size of nonfamily households: 2,312 1-person , 713 2-persons , 5 3-persons , 26 5-persons .
1,988 married couples with children. single-parent households (191 men , 233 women ).
84.8% of residents of Lone Tree speak English at home. of residents speak Spanish at home (86% speak English very well , 14% speak English well ).of residents speak other Indo-European language at home (86% speak English very well , 8% speak English well , 6% speak English not well ).of residents speak Asian or Pacific Island language at home (51% speak English very well , 42% speak English well , 6% speak English not well , 2% don't speak English at all ).of residents speak other language at home (91% speak English very well , 9% speak English well ).
Foreign born population: 1,801 (12.3%)of them are naturalized citizens )
Median number of rooms in houses and condos:
Median number of rooms in apartments
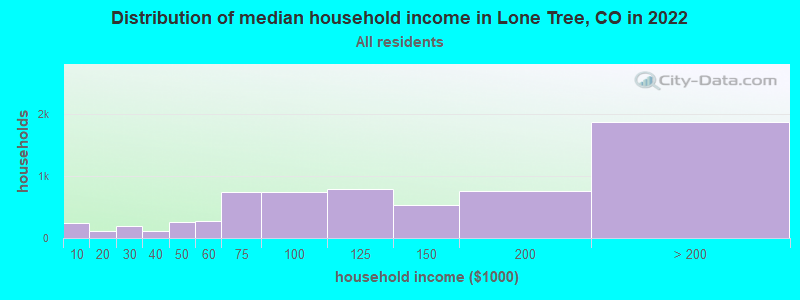
Lone Tree, CO household income distribution 236 Less than $10,000113 $10,000 to $19,999197 $20,000 to $29,999107 $30,000 to $39,999255 $40,000 to $49,999281 $50,000 to $59,999743 $60,000 to $74,999736 $75,000 to $99,999788 $100,000 to $124,999531 $125,000 to $149,999752 $150,000 to $199,9991,868 $200,000 or more
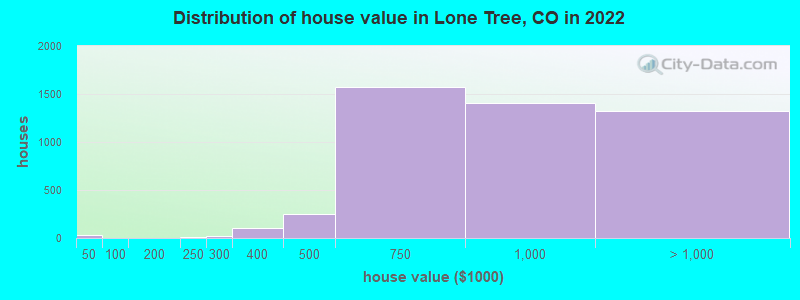
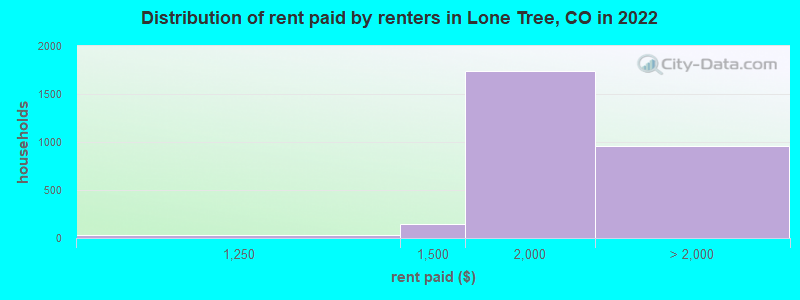
Home value of owner - occupied houses in 2022 in Lone Tree, CO 15 Less than $10,00014 $20,000 to $24,9994 $90,000 to $99,99910 $200,000 to $249,99916 $250,000 to $299,999108 $300,000 to $399,999253 $400,000 to $499,9991,570 $500,000 to $749,9991,401 $750,000 to $999,999938 $1,000,000 to $1,499,999268 $1,500,000 to $1,999,999115 $2,000,000 or moreRent paid by renters in 2022 in Lone Tree, CO 31 $1,000 to $1,249149 $1,250 to $1,4991,734 $1,500 to $1,999594 $2,000 to $2,499255 $2,500 to $2,99946 $3,000 to $3,49965 No cash rent
Percentage of workers working in this county: 58.5%Number of people working at home: 2,554 (29.9% of all workers )
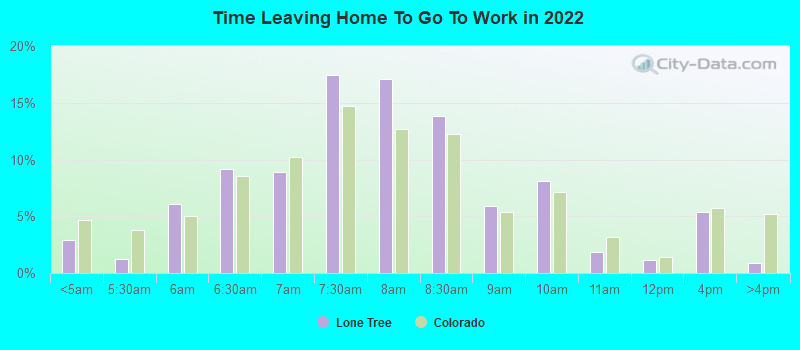
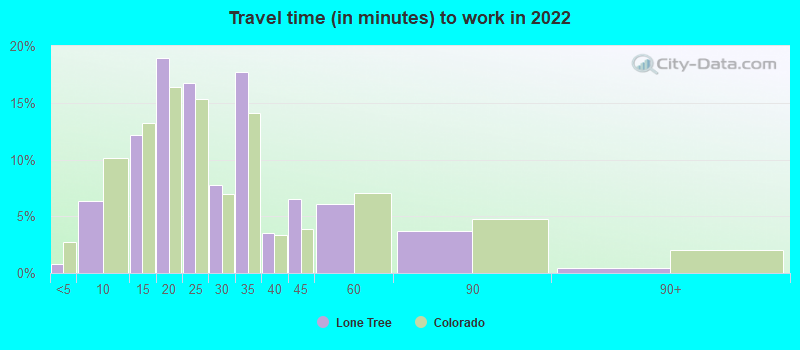
Travel time to work (commute)
Less than 5 minutes: 1005 to 9 minutes: 73310 to 14 minutes: 99015 to 19 minutes: 1,18320 to 24 minutes: 64225 to 29 minutes: 42130 to 34 minutes: 61835 to 39 minutes: 24340 to 44 minutes: 15345 to 59 minutes: 50760 to 89 minutes: 35190 or more minutes: 31
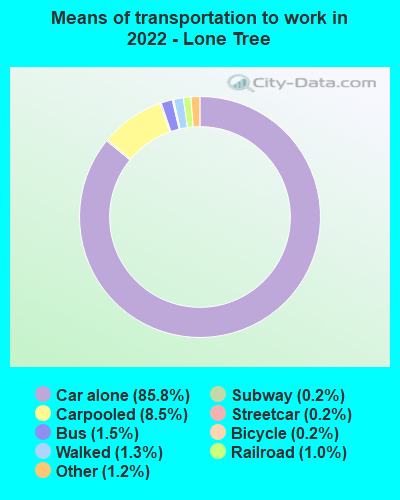
Means of transportation to work:
Drove a car alone: 16,720 (70.0%)Carpooled: 1,893 (7.9%)Bus : 419 (1.8%)Subway or elevated rail : 55 (0.2%)Long-distance train or commuter rail : 40 (0.2%)Light rail, streetcar or trolley : 246 (1.0%)Taxi: 223 (0.9%)Bicycle: 76 (0.3%)Walked: 240 (1.0%)Worked at home: 2,554 (10.7%)
Unemployment by race in 2022
Unemployment rate for White non-Hispanic residents 2.6% Males3.1% FemalesUnemployment rate for Black residents 30.4% FemalesUnemployment rate for American Indian and Alaska Native residents 82.6% MalesUnemployment rate for Asian residents 4.9% Males4.6% Females
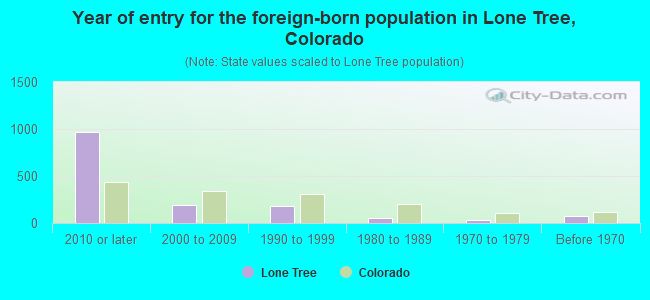
Year of entry for the foreign-born population in Lone Tree, Colorado
966 2010 or later 194 2000 to 2009 185 1990 to 1999 49 1980 to 1989 37 1970 to 1979 79 Before 1970
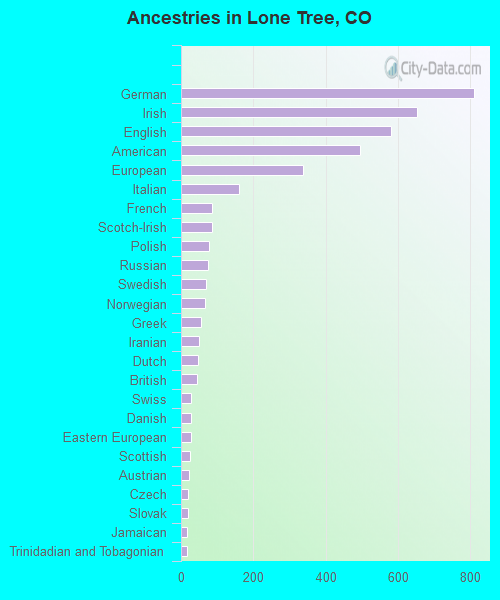
First ancestries reported:
German: 811 (12.6%)
Irish: 653 (10.1%)
English: 581 (9.0%)
American: 495 (7.7%)
European: 338 (5.3%)
Italian: 160 (2.5%)
French: 85 (1.3%)
Scotch-Irish: 85 (1.3%)
Polish: 77 (1.2%)
Russian: 74 (1.1%)
Swedish: 68 (1.1%)
Norwegian: 65 (1.0%)
Greek: 54 (0.8%)
Iranian: 51 (0.8%)
Dutch: 46 (0.7%)
British: 44 (0.7%)
Swiss: 28 (0.4%)
Danish: 27 (0.4%)
Eastern European: 27 (0.4%)
Scottish: 24 (0.4%)
Austrian: 23 (0.4%)
Czech: 20 (0.3%)
Slovak: 18 (0.3%)
Jamaican: 16 (0.2%)
Trinidadian and Tobagonian: 16 (0.2%)
Ukrainian: 14 (0.2%)
Brazilian: 11 (0.2%)
Latvian: 9 (0.1%)
Northern European: 9 (0.1%)
Finnish: 8 (0.1%)
Nigerian: 8 (0.1%)
Czechoslovakian: 7 (0.1%)
Scandinavian: 7 (0.1%)
Lebanese: 4 (0.06%)
Moroccan: 4 (0.06%)
Serbian: 4 (0.06%) Most common places of birth for foreign-born residents (%): India Lone Tree:
33.3% (557)Colorado:
4.0% (21,689)
China, excluding Hong Kong and Taiwan Lone Tree:
11.1% (186)Colorado:
3.3% (17,998)
Vietnam Lone Tree:
6.5% (108)Colorado:
3.0% (16,616)
Guatemala Lone Tree:
4.9% (82)Colorado:
1.4% (7,898)
Senegal Lone Tree:
4.2% (70)Colorado:
0.1% (651)
France Lone Tree:
4.2% (70)Colorado:
0.5% (2,620)
Russia Lone Tree:
3.7% (62)Colorado:
1.4% (7,860)
Indonesia Lone Tree:
2.8% (46)Colorado:
0.4% (2,007)
Colombia Lone Tree:
2.6% (43)Colorado:
1.1% (5,971)
Argentina Lone Tree:
2.4% (40)Colorado:
0.6% (3,016)
Iran Lone Tree:
2.3% (39)Colorado:
0.7% (3,568)
Mexico Lone Tree:
1.6% (27)Colorado:
38.3% (209,491)
Saudi Arabia Lone Tree:
1.6% (26)Colorado:
0.1% (648)
Place of birth for U.S.-born residents:
This state: 4,894Other state: 7,601Northeast: 1,349Midwest: 2,645South: 1,517West: 2,092 78.2% of Lone Tree residents lived in the same house 1 years ago.
Out of people who lived in different houses, 31.9% lived in this county.
Out of people who lived in different counties, 57.0% lived in Colorado.
Lone Tree:
78.2%State average:
83.6%
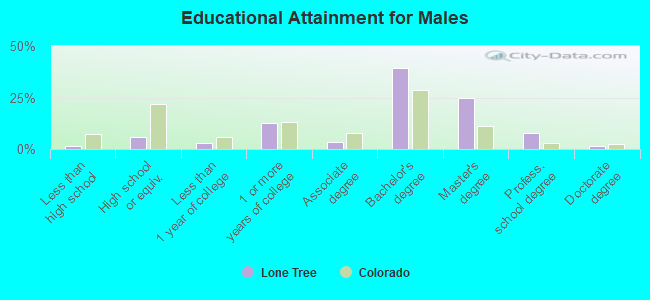
Education attainment for males 25 years and older:
No schooling: 25Nursery to 4th grade: 05th and 6th grade: 187th and 8th grade: 09th grade: 2010th grade: 911th grade: 012th grade, no diploma: 8High school graduate (or equivalency): 332Less than 1 year of college: 152Some college more than 1 year, no degree: 691Associate degree: 196Bachelor's degree: 2,183Master's degree: 1,354Professional school degree: 440Doctorate degree: 92
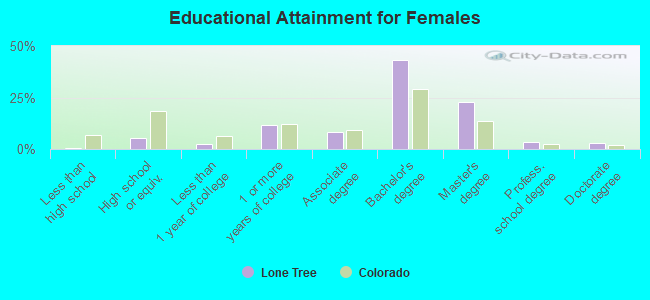
Education attainment for females 25 years and older:
No schooling: 6Nursery to 4th grade: 05th and 6th grade: 47th and 8th grade: 09th grade: 010th grade: 011th grade: 012th grade, no diploma: 18High school graduate (or equivalency): 281Less than 1 year of college: 139Some college more than 1 year, no degree: 626Associate degree: 439Bachelor's degree: 2,337Master's degree: 1,245Professional school degree: 183Doctorate degree: 156
Housing units in structures:
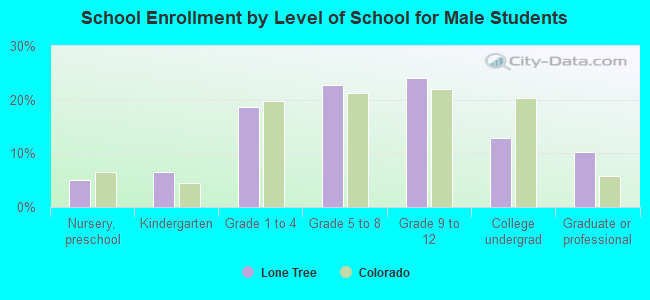
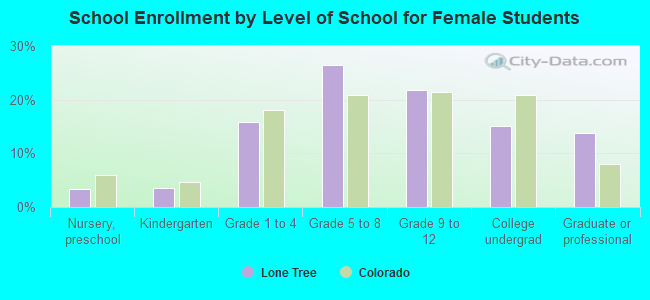
One, detached: 3,092One, attached: 848Two: 823 or 4: 575 to 9: 19910 to 19: 47320 to 49: 55150 or more: 1,662Mobile homes: 35Private vs. public school enrollment:
Students in private schools in grades 1 to 8 (elementary and middle school): 230 Students in private schools in grades 9 to 12 (high school): 102 Students in private undergraduate colleges: 65