Long Beach, MS (Mississippi) Houses and Residents
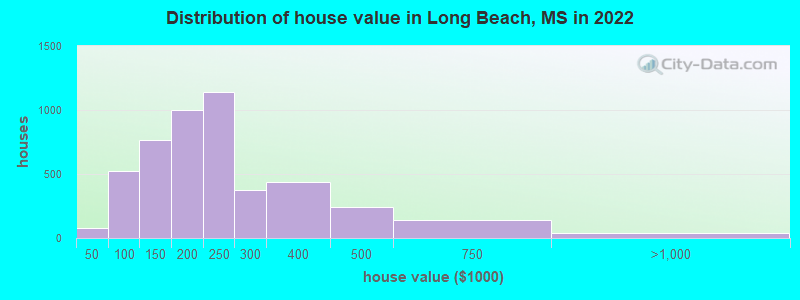
Estimated median house or condo value in 2022: $209,524 (it was $92,900 in 2000 )
Long Beach:
$209,524Mississippi:
$162,500
Lower value quartile - upper value quartile: $150,513 - $271,699Total population: 15,448 (All urban)
Houses: 7,722 (6,872 occupied: 4,569 owner occupied, 2,433 renter occupied )
% of renters here:
35%State:
30%
Housing density: 764 houses/condos per square mile
Median price asked for vacant for-sale houses and condos in 2022: $167,330.
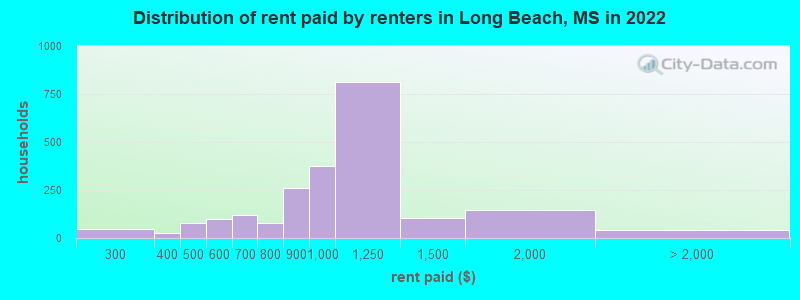
Median contract rent in 2022: $996 (lower quartile is $758, upper quartile is $1,195)
Median rent asked for vacant for-rent units in 2022: $1,052
Median gross rent in Long Beach, MS in 2022: $1,127
Housing units in Long Beach with a mortgage: 2,687 (285 second mortgage, 0 home equity loan, 241 both second mortgage and home equity loan )Houses without a mortgage: 43
Median household income for houses/condos with a mortgage: $97,580
Median household income for apartments without a mortgage: $57,535
Median monthly housing costs: $1,078
Data:
Median house or condo value ($)
Median house or condo value ($ change since 2000)
Median house or condo value ($) - White
Median house or condo value ($) - Black or African American
Median house or condo value ($) - Asian
Median house or condo value ($) - Hispanic or Latino
Median house or condo value ($) - American Indian and Alaska Native
Median house or condo value ($) - Multirace
Median house or condo value ($) - Other Race
Median price asked for mobile homes ($)
Household density (households per square mile)
Mean house or condo value by units in structure - 1, detached ($)
Mean house or condo value by units in structure - 1, attached ($)
Mean house or condo value by units in structure - 2 ($)
Mean house or condo value by units in structure by units in structure - 3 or 4 ($)
Mean house or condo value by units in structure - 5 or more ($)
Mean house or condo value by units in structure - Boat, RV, van, etc. ($)
Mean house or condo value by units in structure - Mobile home ($)
Median contract rent ($)
Median contract rent - Lower quartile ($)
Median contract rent - Upper quartile ($)
Median gross rent ($)
Urban houses (%)
Rural houses (%)
Houses occupied (%)
Houses occupied (% change since 2000)
Houses owner occupied (%)
Houses owner occupied (% change since 2000)
Houses renter occupied (%)
Houses renter occupied (% change since 2000)
Vacant housing units - For rent (%)
Vacant housing units - For rent (% change since 2000)
Vacant housing units - For sale only (%)
Vacant housing units - For sale only (% change since 2000)
Vacant housing units - Rented or sold, not occupied (%)
Vacant housing units - Rented or sold, not occupied (% change since 2000)
Vacant housing units - For seasonal, recreational, or occasional use (%)
Vacant housing units - For seasonal, recreational, or occasional use (% change since 2000)
Vacant housing units - For migrant workers (%)
Vacant housing units - For migrant workers (% change since 2000)
Vacant housing units - Other vacant (%)
Vacant housing units - Other vacant (% change since 2000)
Median monthly housing costs ($)
Median household income for houses/condos with a mortgage ($)
Median household income for houses/condos without a mortgage ($)
Median household income ($)
Median household income ($) - White
Median household income ($) - Black or African American
Median household income ($) - Asian
Median household income ($) - Hispanic or Latino
Median household income ($) - American Indian and Alaska Native
Median household income ($) - Multirace
Median household income ($) - Other Race
Mortgage status - with mortgage (%)
Mortgage status - with second mortgage (%)
Mortgage status - with home equity loan (%)
Mortgage status - with both second mortgage and home equity loan (%)
Mortgage status - without a mortgage (%)
Median year house/condo built
Median year apartment built
Household type by relationship - Male householder living alone (%)
Household type by relationship - Male householder not living alone (%)
Household type by relationship - Female householder living alone (%)
Household type by relationship - Female householder not living alone (%)
Household type by relationship - Opposite-Sex spouse (%)
Household type by relationship - Same-Sex spouse (%)
Household type by relationship - Opposite-Sex unmarried partner (%)
Household type by relationship - Same-Sex unmarried partner (%)
Household type by relationship - In group quarters (%)
Size of family households - 2-person household (%)
Size of family households - 3-person household (%)
Size of family households - 4-person household (%)
Size of family households - 5-person household (%)
Size of family households - 6-person household (%)
Size of family households - 7-or-more-person household (%)
Size of nonfamily households - 1-person household (%)
Size of nonfamily households - 2-person household (%)
Size of nonfamily households - 3-person household (%)
Size of nonfamily households - 4-person household (%)
Size of nonfamily households - 5-person household (%)
Size of nonfamily households - 6-person household (%)
Size of nonfamily households - 7-or-moreperson household (%)
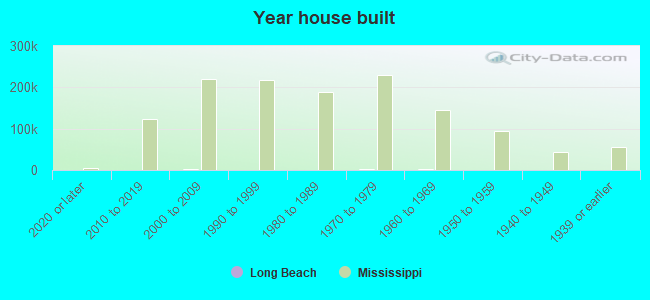
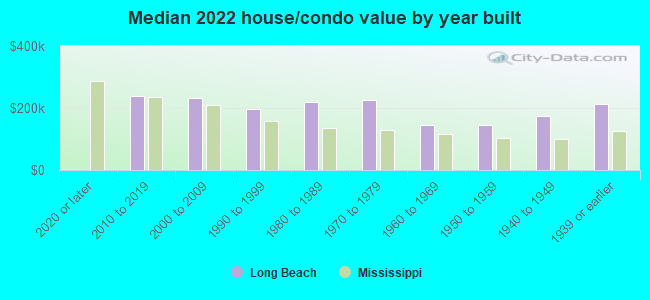
Year house built - Built 2010 or later (%)
Year house built - Built 2000 to 2009 (%)
Year house built - Built 1990 to 1999 (%)
Year house built - Built 1980 to 1989 (%)
Year house built - Built 1970 to 1979 (%)
Year house built - Built 1960 to 1969 (%)
Year house built - Built 1950 to 1959 (%)
Year house built - Built 1940 to 1949 (%)
Year house built - Built 1939 or earlier (%)
Median number of rooms in houses and condos
Median number of rooms in apartments
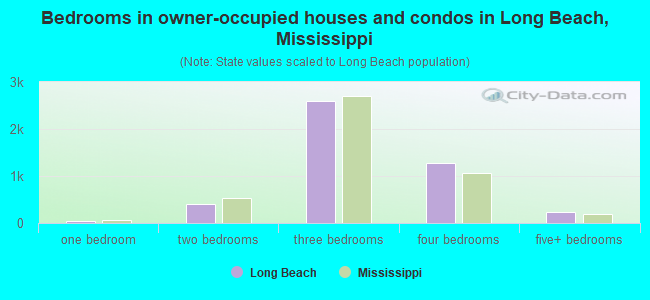
Median number of bedrooms in owner occupied houses
Mean number of bedrooms in owner occupied houses
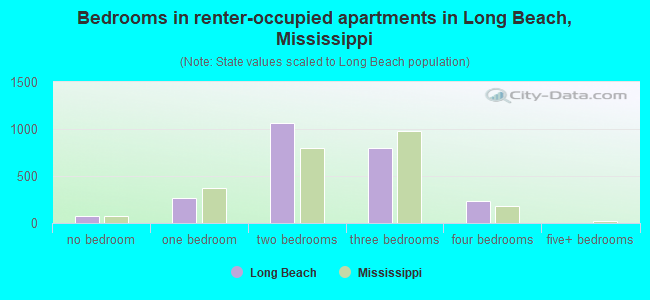
Median number of bedrooms in renter occupied houses
Mean number of bedrooms in renter occupied houses
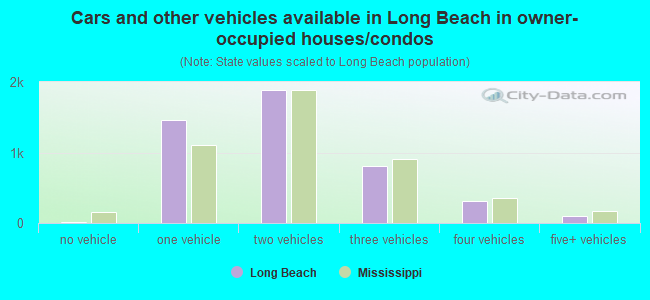
Median number of vehichles in owner occupied houses
Mean number of vehichles in owner occupied houses
Median number of vehichles in renter occupied houses
Mean number of vehichles in renter occupied houses
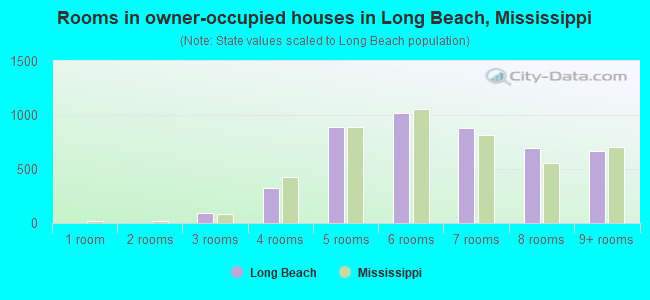
Rooms in owner-occupied houses - 1 room (%)
Rooms in owner-occupied houses - 2 rooms (%)
Rooms in owner-occupied houses - 3 rooms (%)
Rooms in owner-occupied houses - 4 rooms (%)
Rooms in owner-occupied houses - 5 rooms (%)
Rooms in owner-occupied houses - 6 rooms (%)
Rooms in owner-occupied houses - 7 rooms (%)
Rooms in owner-occupied houses - 8 rooms (%)
Rooms in owner-occupied houses - 9+ rooms (%)
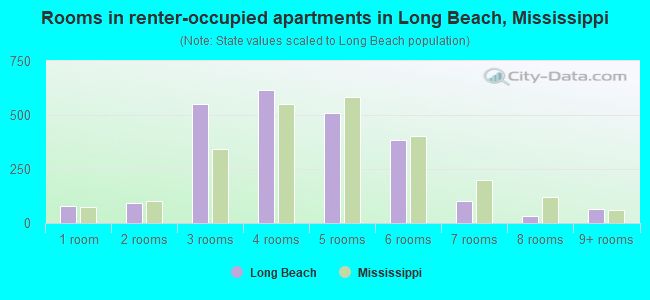
Rooms in renter-occupied houses - 1 room (%)
Rooms in renter-occupied houses - 2 rooms (%)
Rooms in renter-occupied houses - 3 rooms (%)
Rooms in renter-occupied houses - 4 rooms (%)
Rooms in renter-occupied houses - 5 rooms (%)
Rooms in renter-occupied houses - 6 rooms (%)
Rooms in renter-occupied houses - 7 rooms (%)
Rooms in renter-occupied houses - 8 rooms (%)
Rooms in renter-occupied houses - 9+ rooms (%)
Bedrooms in owner-occupied houses - no bedrooms (%)
Bedrooms in owner-occupied houses - 1 bedroom (%)
Bedrooms in owner-occupied houses - 2 bedrooms (%)
Bedrooms in owner-occupied houses - 3 bedrooms (%)
Bedrooms in owner-occupied houses - 4 bedrooms (%)
Bedrooms in owner-occupied houses - 5+ bedrooms (%)
Bedrooms in renter-occupied houses - no bedrooms (%)
Bedrooms in renter-occupied houses - 1 bedroom (%)
Bedrooms in renter-occupied houses - 2 bedrooms (%)
Bedrooms in renter-occupied houses - 3 bedrooms (%)
Bedrooms in renter-occupied houses - 4 bedrooms (%)
Bedrooms in renter-occupied houses - 5+ bedrooms (%)
Vehicles available in owner-occupied houses - no vehicle available (%)
Vehicles available in owner-occupied houses - 1 vehicle available(%)
Vehicles available in owner-occupied houses - 2 Vehicles available (%)
Vehicles available in owner-occupied houses - 3 Vehicles available (%)
Vehicles available in owner-occupied houses - 4 Vehicles available (%)
Vehicles available in owner-occupied houses - 5+ Vehicles available (%)
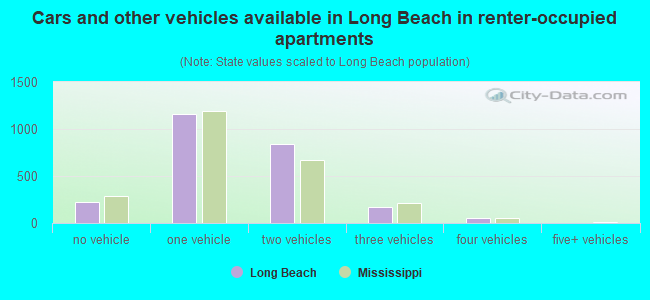
Vehicles available in renter-occupied houses - no vehicle available (%)
Vehicles available in renter-occupied houses - 1 vehicle available (%)
Vehicles available in renter-occupied houses - 2 Vehicles available (%)
Vehicles available in renter-occupied houses - 3 Vehicles available (%)
Vehicles available in renter-occupied houses - 4 Vehicles available (%)
Vehicles available in renter-occupied houses - 5+ Vehicles available (%)
Housing units in structures - 1, detached (%)
Housing units in structures - 1, attached (%)
Housing units in structures - 2 (%)
Housing units in structures - 3 or 4 (%)
Housing units in structures - 5 to 9 (%)
Housing units in structures - 10 to 19 (%)
Housing units in structures - 20 to 49 (%)
Housing units in structures - 50 or more (%)
Housing units in structures - Mobile home (%)
Housing units in structures - Boat, RV, van, etc. (%)
Housing units in structures - Owners - 1, detached (%)
Housing units in structures - Owners - 1, attached (%)
Housing units in structures - Owners - 2 (%)
Housing units in structures - Owners - 3 or 4 (%)
Housing units in structures - Owners - 5 to 9 (%)
Housing units in structures - Owners - 10 to 19 (%)
Housing units in structures - Owners - 20 to 49 (%)
Housing units in structures - Owners - 50 or more (%)
Housing units in structures - Owners - Mobile home (%)
Housing units in structures - Owners - Boat, RV, van, etc. (%)
Housing units in structures - Renters - 1, detached (%)
Housing units in structures - Renters - 1, attached (%)
Housing units in structures - Renters - 2 (%)
Housing units in structures - Renters - 3 or 4 (%)
Housing units in structures - Renters - 5 to 9 (%)
Housing units in structures - Renters - 10 to 19 (%)
Housing units in structures - Renters - 20 to 49 (%)
Housing units in structures - Renters - 50 or more (%)
Housing units in structures - Renters - Mobile home (%)
Housing units in structures - Renters - Boat, RV, van, etc. (%)
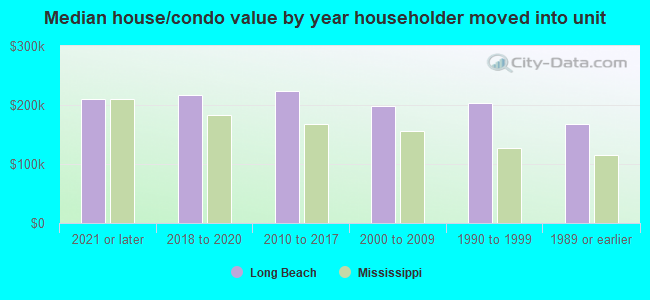
House/condo owner moved in on average (years ago)
Renter moved in on average (years ago)
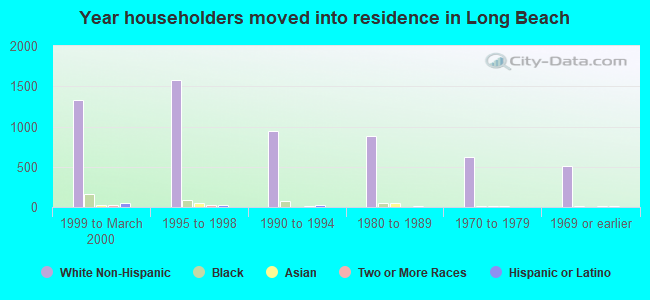
Year householder moved into unit - Moved in 1999 to March 2000 (%)
Year householder moved into unit - Moved in 1999 to March 2000 (%) - White
Year householder moved into unit - Moved in 1999 to March 2000 (%) - Black or African American
Year householder moved into unit - Moved in 1999 to March 2000 (%) - Asian
Year householder moved into unit - Moved in 1999 to March 2000 (%) - Hispanic or Latino
Year householder moved into unit - Moved in 1999 to March 2000 (%) - American Indian and Alaska Native
Year householder moved into unit - Moved in 1999 to March 2000 (%) - Multirace
Year householder moved into unit - Moved in 1999 to March 2000 (%) - Other Race
Year householder moved into unit - Moved in 1995 to 1998 (%)
Year householder moved into unit - Moved in 1995 to 1998 (%) - White
Year householder moved into unit - Moved in 1995 to 1998 (%) - Black or African American
Year householder moved into unit - Moved in 1995 to 1998 (%) - Asian
Year householder moved into unit - Moved in 1995 to 1998 (%) - Hispanic or Latino
Year householder moved into unit - Moved in 1995 to 1998 (%) - American Indian and Alaska Native
Year householder moved into unit - Moved in 1995 to 1998 (%) - Multirace
Year householder moved into unit - Moved in 1995 to 1998 (%) - Other Race
Year householder moved into unit - Moved in 1990 to 1994 (%)
Year householder moved into unit - Moved in 1990 to 1994 (%) - White
Year householder moved into unit - Moved in 1990 to 1994 (%) - Black or African American
Year householder moved into unit - Moved in 1990 to 1994 (%) - Asian
Year householder moved into unit - Moved in 1990 to 1994 (%) - Hispanic or Latino
Year householder moved into unit - Moved in 1990 to 1994 (%) - American Indian and Alaska Native
Year householder moved into unit - Moved in 1990 to 1994 (%) - Multirace
Year householder moved into unit - Moved in 1990 to 1994 (%) - Other Race
Year householder moved into unit - Moved in 1980 to 1989 (%)
Year householder moved into unit - Moved in 1980 to 1989 (%) - White
Year householder moved into unit - Moved in 1980 to 1989 (%) - Black or African American
Year householder moved into unit - Moved in 1980 to 1989 (%) - Asian
Year householder moved into unit - Moved in 1980 to 1989 (%) - Hispanic or Latino
Year householder moved into unit - Moved in 1980 to 1989 (%) - American Indian and Alaska Native
Year householder moved into unit - Moved in 1980 to 1989 (%) - Multirace
Year householder moved into unit - Moved in 1980 to 1989 (%) - Other Race
Year householder moved into unit - Moved in 1970 to 1979 (%)
Year householder moved into unit - Moved in 1970 to 1979 (%) - White
Year householder moved into unit - Moved in 1970 to 1979 (%) - Black or African American
Year householder moved into unit - Moved in 1970 to 1979 (%) - Asian
Year householder moved into unit - Moved in 1970 to 1979 (%) - Hispanic or Latino
Year householder moved into unit - Moved in 1970 to 1979 (%) - American Indian and Alaska Native
Year householder moved into unit - Moved in 1970 to 1979 (%) - Multirace
Year householder moved into unit - Moved in 1970 to 1979 (%) - Other Race
Year householder moved into unit - Moved in 1969 or earlier (%)
Year householder moved into unit - Moved in 1969 or earlier (%) - White
Year householder moved into unit - Moved in 1969 or earlier (%) - Black or African American
Year householder moved into unit - Moved in 1969 or earlier (%) - Asian
Year householder moved into unit - Moved in 1969 or earlier (%) - Hispanic or Latino
Year householder moved into unit - Moved in 1969 or earlier (%) - American Indian and Alaska Native
Year householder moved into unit - Moved in 1969 or earlier (%) - Multirace
Year householder moved into unit - Moved in 1969 or earlier (%) - Other Race
Housing units lacking complete plumbing facilities (%)
Housing units lacking complete kitchen facilities (%)
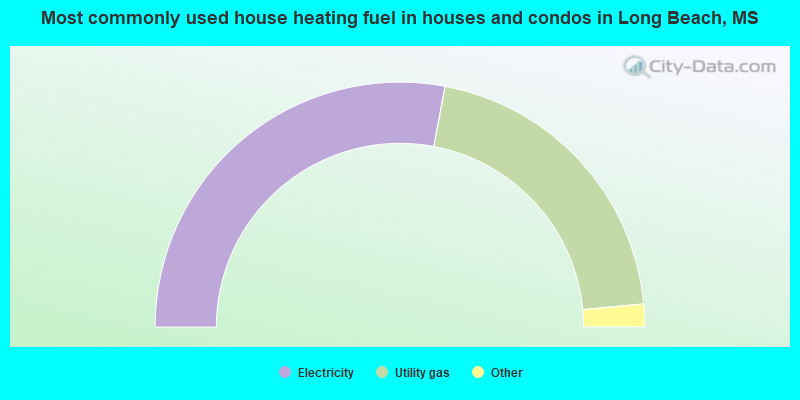
House heating fuel used in houses and condos - Utility gas (%)
House heating fuel used in houses and condos - Bottled, tank, or LP gas (%)
House heating fuel used in houses and condos - Electricity (%)
House heating fuel used in houses and condos - Fuel oil, kerosene, etc. (%)
House heating fuel used in houses and condos - Coal or coke (%)
House heating fuel used in houses and condos - Wood (%)
House heating fuel used in houses and condos - Solar energy (%)
House heating fuel used in houses and condos - Other fuel (%)
House heating fuel used in houses and condos - No fuel used (%)
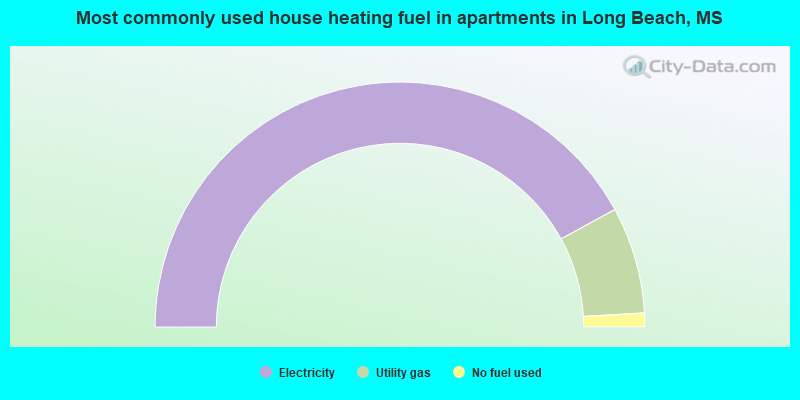
House heating fuel used in apartments - Utility gas (%)
House heating fuel used in apartments - Bottled, tank, or LP gas (%)
House heating fuel used in apartments - Electricity (%)
House heating fuel used in apartments - Fuel oil, kerosene, etc. (%)
House heating fuel used in apartments - Coal or coke (%)
House heating fuel used in apartments - Wood (%)
House heating fuel used in apartments - Solar energy (%)
House heating fuel used in apartments - Other fuel (%)
House heating fuel used in apartments - No fuel used (%)
Median year house/condo built: 1980Median year apartment built: 1991Household type by relationship:
Households: 16,993
Male householders: 3,194 (665 living alone ), Female householders: 3,587 (1,299 living alone )2,925 spouses (2,913 opposite-sex spouses ), 320 unmarried partners , (262 opposite-sex unmarried partners ), 5,372 children (5,072 natural , 189 adopted , 111 stepchildren ), 479 grandchildren , 294 brothers or sisters , 226 parents , 0 foster children , 132 other relatives , 414 non-relatives In group quarters: 46
Size of family households: 2,344 2-persons , 876 3-persons , 614 4-persons , 393 5-persons , 55 6-persons , 68 7-or-more-persons .
Size of nonfamily households: 2,197 1-person , 387 2-persons , 67 3-persons , 36 4-persons .
2,855 married couples with children. single-parent households (307 men , 582 women ).
93.9% of residents of Long Beach speak English at home. of residents speak Spanish at home (66% speak English very well , 13% speak English well , 20% speak English not well ).of residents speak other Indo-European language at home (78% speak English very well , 22% speak English well ).of residents speak Asian or Pacific Island language at home (77% speak English very well , 10% speak English well , 13% speak English not well ).of residents speak other language at home (100% speak English very well ).
Foreign born population: 759 (4.5%)of them are naturalized citizens )
Median number of rooms in houses and condos:
Median number of rooms in apartments
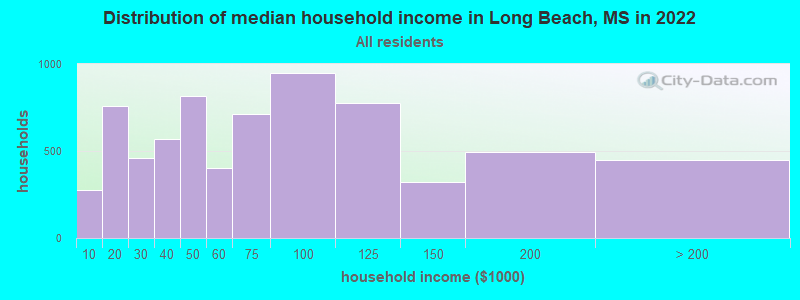
Long Beach, MS household income distribution 275 Less than $10,000757 $10,000 to $19,999461 $20,000 to $29,999570 $30,000 to $39,999816 $40,000 to $49,999401 $50,000 to $59,999713 $60,000 to $74,999951 $75,000 to $99,999775 $100,000 to $124,999321 $125,000 to $149,999495 $150,000 to $199,999451 $200,000 or more
Home value of owner - occupied houses in 2022 in Long Beach, MS 3 Less than $10,00045 $10,000 to $14,9999 $15,000 to $19,9995 $30,000 to $34,99910 $35,000 to $39,9997 $40,000 to $49,99985 $50,000 to $59,99935 $60,000 to $69,999186 $70,000 to $79,999165 $80,000 to $89,99945 $90,000 to $99,999265 $100,000 to $124,999500 $125,000 to $149,999469 $150,000 to $174,999530 $175,000 to $199,9991,138 $200,000 to $249,999374 $250,000 to $299,999437 $300,000 to $399,999238 $400,000 to $499,999142 $500,000 to $749,99935 $750,000 to $999,999Rent paid by renters in 2022 in Long Beach, MS 46 $250 to $29925 $300 to $34977 $450 to $49997 $550 to $59948 $600 to $64969 $650 to $69962 $700 to $74914 $750 to $799258 $800 to $899374 $900 to $999813 $1,000 to $1,249105 $1,250 to $1,499146 $1,500 to $1,99939 No cash rent
Percentage of workers working in this county: 87.4%Number of people working at home: 381 (5.1% of all workers )
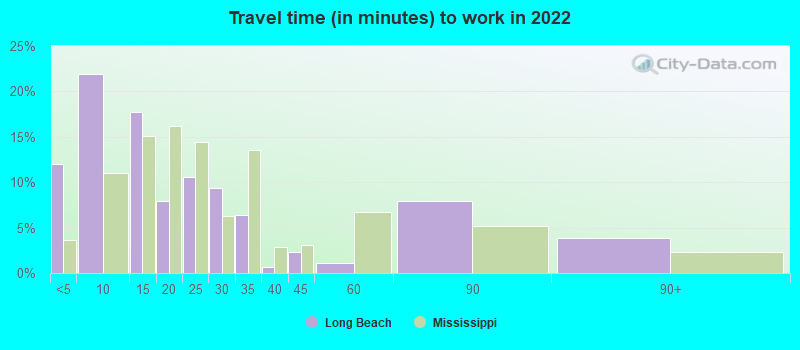
Travel time to work (commute)
Less than 5 minutes: 4785 to 9 minutes: 1,14410 to 14 minutes: 1,13215 to 19 minutes: 81320 to 24 minutes: 1,25625 to 29 minutes: 44130 to 34 minutes: 78435 to 39 minutes: 11540 to 44 minutes: 11145 to 59 minutes: 55660 to 89 minutes: 29290 or more minutes: 57
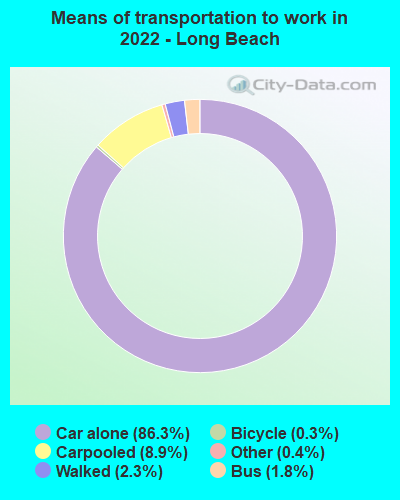
Means of transportation to work:
Drove a car alone: 2,905 (77.9%)Carpooled: 312 (8.4%)Bus : 115 (3.1%)Taxi: 7 (0.2%)Bicycle: 11 (0.3%)Walked: 85 (2.3%)Worked at home: 381 (10.2%)
Unemployment by race in 2022
Unemployment rate for White non-Hispanic residents 4.2% Males4.5% FemalesUnemployment rate for Black residents 16.6% MalesUnemployment rate for American Indian and Alaska Native residents 100.0% FemalesUnemployment rate for two or more race residents 3.5% Females
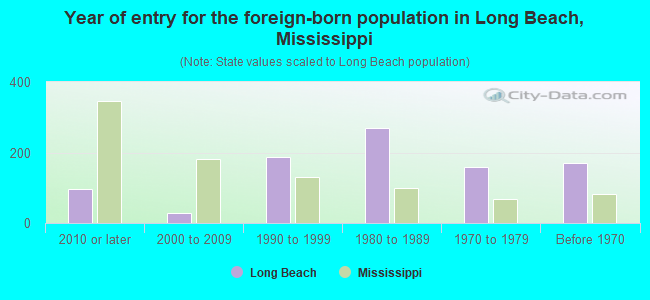
Year of entry for the foreign-born population in Long Beach, Mississippi
96 2010 or later 29 2000 to 2009 187 1990 to 1999 269 1980 to 1989 158 1970 to 1979 169 Before 1970
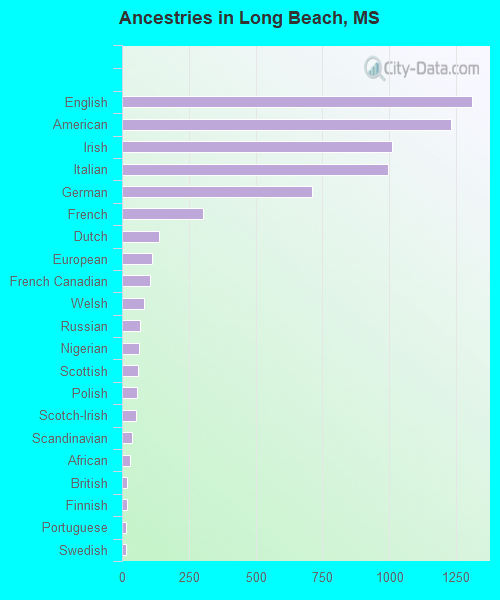
First ancestries reported:
English: 1,309 (15.5%)
American: 1,233 (14.6%)
Irish: 1,010 (11.9%)
Italian: 998 (11.8%)
German: 710 (8.4%)
French: 302 (3.6%)
Dutch: 137 (1.6%)
European: 112 (1.3%)
French Canadian: 104 (1.2%)
Welsh: 82 (1.0%)
Russian: 66 (0.8%)
Nigerian: 64 (0.8%)
Scottish: 61 (0.7%)
Polish: 58 (0.7%)
Scotch-Irish: 51 (0.6%)
Scandinavian: 36 (0.4%)
African: 30 (0.4%)
British: 20 (0.2%)
Finnish: 18 (0.2%)
Portuguese: 15 (0.2%)
Swedish: 14 (0.2%)
Canadian: 9 (0.1%)
Norwegian: 8 (0.09%)
Cajun: 6 (0.07%)
Danish: 1 (0.01%) Most common places of birth for foreign-born residents (%): Philippines Long Beach:
20.3% (200)Mississippi:
4.7% (3,211)
Other Eastern Europe Long Beach:
16.4% (161)Mississippi:
0.3% (235)
Canada Long Beach:
15.2% (150)Mississippi:
2.0% (1,390)
Mexico Long Beach:
13.9% (137)Mississippi:
25.4% (17,354)
Germany Long Beach:
6.9% (68)Mississippi:
3.1% (2,126)
Vietnam Long Beach:
5.9% (58)Mississippi:
5.8% (3,948)
Korea Long Beach:
4.1% (40)Mississippi:
1.5% (1,043)
China, excluding Hong Kong and Taiwan Long Beach:
2.7% (27)Mississippi:
4.3% (2,948)
United Kingdom, excluding England and Scotland Long Beach:
2.3% (23)Mississippi:
0.8% (518)
Netherlands Long Beach:
2.2% (22)Mississippi:
0.4% (285)
Grenada Long Beach:
1.7% (17)Mississippi:
0.0% (21)
Thailand Long Beach:
1.6% (16)Mississippi:
1.2% (815)
Place of birth for U.S.-born residents:
This state: 8,064Other state: 7,975Northeast: 586Midwest: 2,152South: 4,374West: 774 85.8% of Long Beach residents lived in the same house 1 years ago.
Out of people who lived in different houses, 29.3% lived in this county.
Out of people who lived in different counties, 28.3% lived in Mississippi.
Long Beach:
85.8%State average:
88.9%
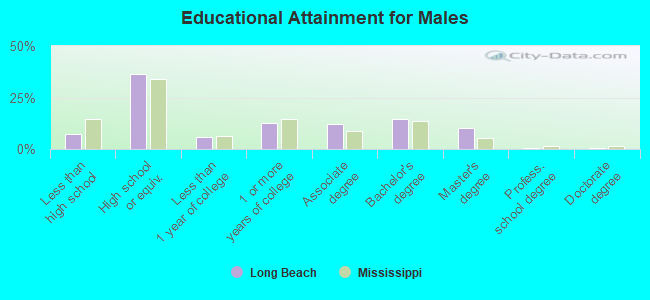
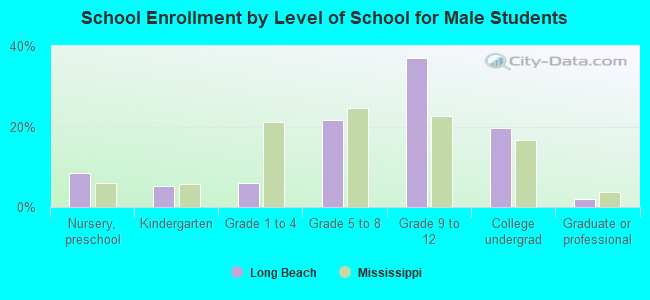
Education attainment for males 25 years and older:
No schooling: 38Nursery to 4th grade: 05th and 6th grade: 207th and 8th grade: 139th grade: 9610th grade: 2311th grade: 15412th grade, no diploma: 24High school graduate (or equivalency): 1,787Less than 1 year of college: 295Some college more than 1 year, no degree: 612Associate degree: 582Bachelor's degree: 704Master's degree: 499Professional school degree: 14Doctorate degree: 31
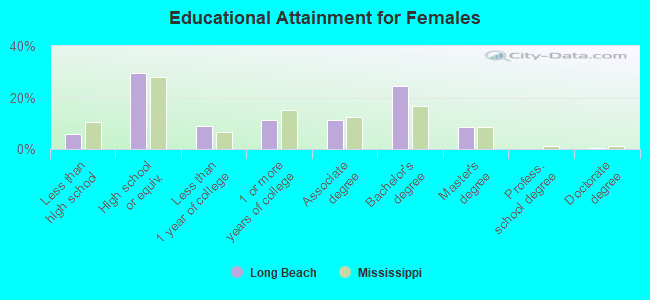
Education attainment for females 25 years and older:
No schooling: 49Nursery to 4th grade: 75th and 6th grade: 337th and 8th grade: 09th grade: 2210th grade: 1711th grade: 16512th grade, no diploma: 110High school graduate (or equivalency): 2,012Less than 1 year of college: 600Some college more than 1 year, no degree: 780Associate degree: 765Bachelor's degree: 1,668Master's degree: 585Professional school degree: 5Doctorate degree: 23
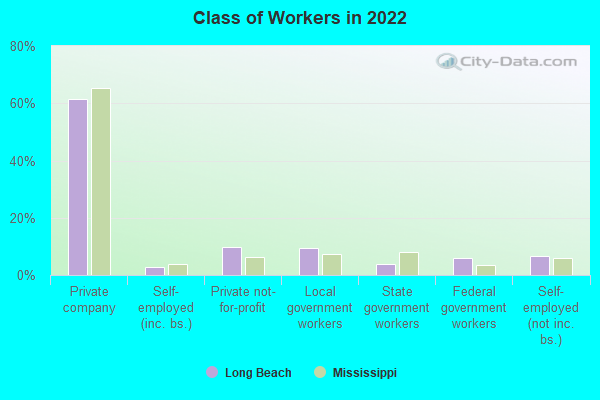
Housing units in structures:
One, detached: 5,746One, attached: 88Two: 1893 or 4: 4385 to 9: 58810 to 19: 40220 to 49: 12450 or more: 110Mobile homes: 31Boats, RVs, vans, etc.: 2Housing units lacking complete plumbing facilities in 2022: 0.0%Housing units lacking complete kitchen facilities in 2022: 0.6%House/condo owner moved in on average 13 years ago
Renter moved in on average 1 years ago
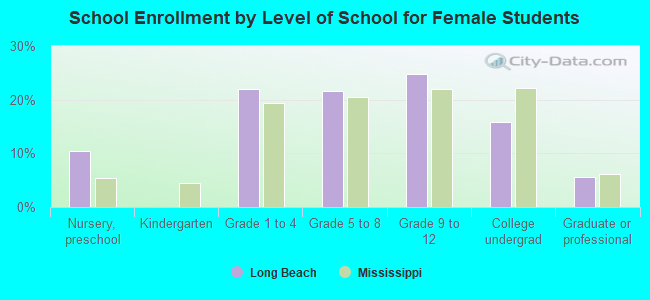
Private vs. public school enrollment:
Students in private schools in grades 1 to 8 (elementary and middle school): 159 Here:
10.7%Mississippi:
16.1%
Students in private schools in grades 9 to 12 (high school): 118 Here:
8.2%Mississippi:
14.6%
Students in private undergraduate colleges: 31 Here:
4.1%Mississippi:
12.8%