Long Beach, NY (New York) Houses and Residents
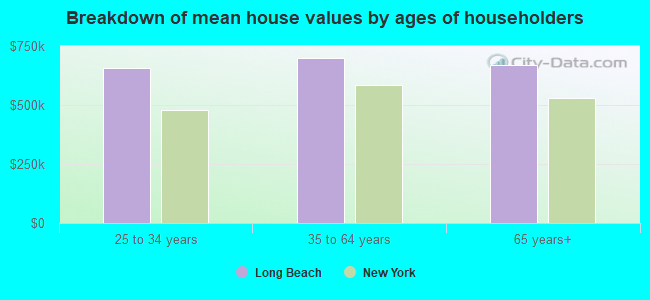
| Long Beach: | $652,018 |
| New York: | $400,400 |
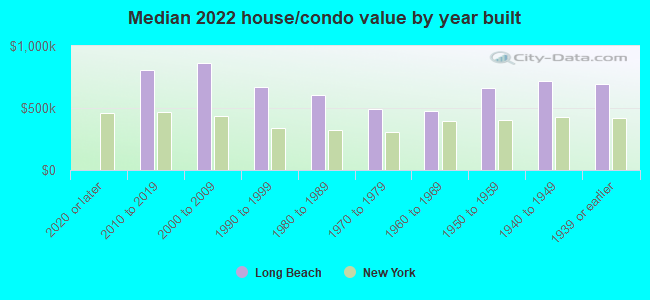
Mean price in 2022:
Detached houses: $802,309
Here: $802,309 State: $476,719 Townhouses or other attached units: $659,830
Here: $659,830 State: $699,270 In 2-unit structures: $619,877
Here: $619,877 State: $713,077 In 3-to-4-unit structures: $515,077
Here: $515,077 State: $764,568 In 5-or-more-unit structures: $424,401
Here: $424,401 State: $912,009
Total population: 33,664 (All urban)
Houses: 16,314 (14,326 occupied: 9,004 owner occupied, 5,298 renter occupied)
| % of renters here: | 37% |
| State: | 46% |
Housing density: 7,634 houses/condos per square mile
Median price asked for vacant for-sale houses and condos in 2022: $906,266.
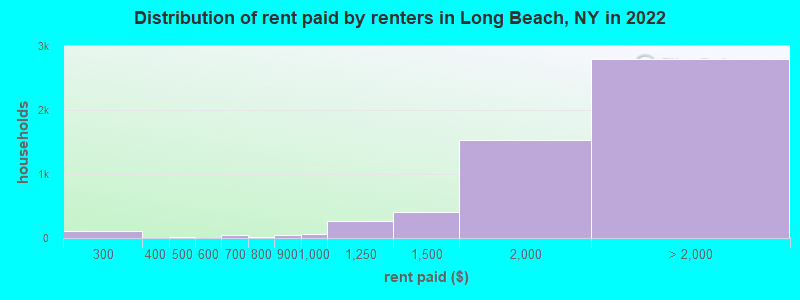
Median contract rent in 2022: over $2,000 (lower quartile is $1,532, upper quartile is over $2,000)
Median rent asked for vacant for-rent units in 2022: $3,150
Median gross rent in Long Beach, NY in 2022: over $2,000
Housing units in Long Beach with a mortgage: 5,702 (601 second mortgage, 10 home equity loan, 577 both second mortgage and home equity loan)
Houses without a mortgage: 79
Median household income for houses/condos with a mortgage: $149,922
Median household income for apartments without a mortgage: $114,600
Median monthly housing costs: $2,329
Compare current foreclosures in Long Beach, NY:
| Photo | Address | Area | Beds / Baths | Price | Details |
|---|---|---|---|---|---|

|
#1
E Hudson St
Long Beach, NY 11561
|
936 sq. feet
|
2 baths 3 beds |
show details | |

|
#2
W Hudson St
Long Beach, NY 11561
|
3,499 sq. feet
|
3 baths 7 beds |
show details | |

|
#3
Wilson Ave
Long Beach, NY 11561
|
1,311 sq. feet
|
1 baths 1 beds |
show details | |

|
#4
E Chester St
Long Beach, NY 11561
|
2,433 sq. feet
|
3 baths 6 beds |
show details | |

|
#5
E Fulton St
Long Beach, NY 11561
|
1,952 sq. feet
|
2 baths - beds |
show details | |

|
#6
E Hudson St
Long Beach, NY 11561
|
1,870 sq. feet
|
2 baths - beds |
show details | |

|
#7
California St
Long Beach, NY 11561
|
1,404 sq. feet
|
2 baths - beds |
show details | |

|
#8
W Olive St
Long Beach, NY 11561
|
1,358 sq. feet
|
3 baths - beds |
show details | |

|
#9
E Olive St
Long Beach, NY 11561
|
2,546 sq. feet
|
3 baths - beds |
show details | |

|
#10
E Hudson St
Long Beach, NY 11561
|
2,088 sq. feet
|
2 baths - beds |
show details |
| Photo | Address | Area | Beds / Baths | Price | Details |
|---|---|---|---|---|---|

|
#11
New Hampshire St
Long Beach, NY 11561
|
804 sq. feet
|
1 baths - beds |
show details | |

|
#12
Atlantic Ave
Long Beach, NY 11561
|
1,551 sq. feet
|
4 baths - beds |
show details | |

|
#13
E Hudson St
Long Beach, NY 11561
|
1,392 sq. feet
|
3 baths - beds |
show details | |

|
#14
W Hudson St
Long Beach, NY 11561
|
2,352 sq. feet
|
3 baths - beds |
show details | |

|
#15
W Olive St # 2
Long Beach, NY 11561
|
3,018 sq. feet
|
4 baths - beds |
show details | |

|
#16
E Beech St
Long Beach, NY 11561
|
2,541 sq. feet
|
4 baths - beds |
show details | |

|
#17
E Beech St
Long Beach, NY 11561
|
1,314 sq. feet
|
2 baths - beds |
show details | |

|
#18
Lido Blvd Apt 79a
Long Beach, NY 11561
|
1,040 sq. feet
|
1 baths - beds |
show details | |

|
#19
E Beech St
Long Beach, NY 11561
|
4,514 sq. feet
|
2 baths - beds |
show details | |

|
#20
E Market St
Long Beach, NY 11561
|
1,872 sq. feet
|
2 baths - beds |
show details |
| Photo | Address | Area | Beds / Baths | Price | Details |
|---|---|---|---|---|---|

|
#21
Broadway
Long Beach, NY 11561
|
895 sq. feet
|
2 baths - beds |
show details | |

|
#22
E Fulton St
Long Beach, NY 11561
|
2,061 sq. feet
|
4 baths - beds |
show details | |

|
#23
Belmont Ave
Long Beach, NY 11561
|
1,698 sq. feet
|
1 baths - beds |
show details | |

|
#24
W Bay Dr
Long Beach, NY 11561
|
2,753 sq. feet
|
3 baths - beds |
show details | |

|
#25
Shore 14
Long Beach, NY 11561
|
958 sq. feet
|
2 baths - beds |
show details | |

|
#26
E Park Ave
Long Beach, NY 11561
|
1,894 sq. feet
|
3 baths - beds |
show details | |

|
#27
Minnesota Ave
Long Beach, NY 11561
|
1,012 sq. feet
|
2 baths - beds |
show details | |

|
#28
E Market St
Long Beach, NY 11561
|
3,792 sq. feet
|
5 baths - beds |
show details | |

|
#29
E Fulton St
Long Beach, NY 11561
|
1,162 sq. feet
|
1 baths - beds |
show details | |

|
#30
E Pine St
Long Beach, NY 11561
|
1,272 sq. feet
|
1 baths - beds |
show details |
| Photo | Address | Area | Beds / Baths | Price | Details |
|---|---|---|---|---|---|

|
#31
W Penn St
Long Beach, NY 11561
|
1,641 sq. feet
|
1 baths - beds |
show details | |

|
#32
Wyoming Ave
Long Beach, NY 11561
|
1,034 sq. feet
|
2 baths - beds |
show details | |

|
#33
Belmont Ave
Long Beach, NY 11561
|
1,686 sq. feet
|
2 baths - beds |
show details | |

|
#34
W Penn St
Long Beach, NY 11561
|
2,007 sq. feet
|
2 baths - beds |
show details | |

|
#35
Michigan St
Long Beach, NY 11561
|
930 sq. feet
|
1 baths - beds |
show details | |

|
#36
Farrell St
Long Beach, NY 11561
|
924 sq. feet
|
2 baths - beds |
show details | |

|
#37
New York Ave
Long Beach, NY 11561
|
924 sq. feet
|
1 baths - beds |
show details | |

|
#38
Vinton St
Long Beach, NY 11561
|
1,757 sq. feet
|
2 baths - beds |
show details | |

|
#39
Troy Ave
Long Beach, NY 11561
|
2,120 sq. feet
|
4 baths - beds |
show details | |

|
#40
Wilson Ave
Long Beach, NY 11561
|
1,311 sq. feet
|
3 baths - beds |
show details |
| Photo | Address | Area | Beds / Baths | Price | Details |
|---|---|---|---|---|---|

|
#41
Washington Blvd
Long Beach, NY 11561
|
2,588 sq. feet
|
3 baths - beds |
show details | |

|
#42
E Hudson St
Long Beach, NY 11561
|
2,059 sq. feet
|
4 baths - beds |
show details | |

|
#43
Franklin Blvd
Long Beach, NY 11561
|
2,327 sq. feet
|
3 baths - beds |
show details | |

|
#44
W Park Ave
Long Beach, NY 11561
|
2,032 sq. feet
|
2 baths - beds |
show details | |

|
#45
E Park Ave
Long Beach, NY 11561
|
1,977 sq. feet
|
3 baths - beds |
show details | |

|
#46
Laurelton Blvd
Long Beach, NY 11561
|
3,821 sq. feet
|
2 baths - beds |
show details | |

|
#47
Pennsylvania Ave
Long Beach, NY 11561
|
576 sq. feet
|
1 baths - beds |
show details | |

|
#48
Doyle St
Long Beach, NY 11561
|
1,917 sq. feet
|
1 baths - beds |
show details | |

|
#49
New York Ave
Long Beach, NY 11561
|
1,812 sq. feet
|
2 baths - beds |
show details | |

|
Check over 1 million property listings on Foreclosure.com!
|
browse all offers | |||


 | What has happened to Long Beach ?? (11 replies) |
| Young Professionals Finding Apartments (20 replies) |
| Long Beach changes? (2 replies) |
| Interested in buying in Long Beach (flood insurance, commutability, etc.) (15 replies) |
| Sister in Long Beach Reports on Board Walk (31 replies) |
| Renting the spare room in our house illegal? (35 replies) |

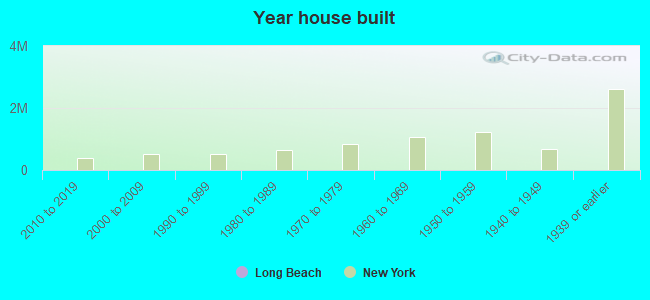
Median year apartment built: 1965
Household type by relationship:
Households: 34,598- Male householders: 7,117 (2,047 living alone), Female householders: 7,086 (2,692 living alone)
5,908 spouses (5,848 opposite-sex spouses), 1,498 unmarried partners, (1,189 opposite-sex unmarried partners), 7,533 children (7,233 natural, 101 adopted, 198 stepchildren), 1,064 grandchildren, 216 brothers or sisters, 623 parents, 0 foster children, 695 other relatives, 1,668 non-relatives
- In group quarters: 1,186
Size of family households: 3,446 2-persons, 2,114 3-persons, 1,179 4-persons, 617 5-persons, 237 6-persons, 186 7-or-more-persons.
Size of nonfamily households: 4,942 1-person, 1,365 2-persons, 274 3-persons, 34 4-persons.
2,576 married couples with children.
1,114 single-parent households (194 men, 920 women).
80.5% of residents of Long Beach speak English at home.
8.5% of residents speak Spanish at home (66% speak English very well, 18% speak English well, 13% speak English not well, 3% don't speak English at all).
6.1% of residents speak other Indo-European language at home (61% speak English very well, 29% speak English well, 6% speak English not well, 5% don't speak English at all).
3.4% of residents speak Asian or Pacific Island language at home (58% speak English very well, 37% speak English well, 5% speak English not well).
0.6% of residents speak other language at home (94% speak English very well, 5% speak English well, 2% speak English not well).
Foreign born population: 5,490 (15.9%)
(71.2% of them are naturalized citizens)
| Here: | 5.8 |
| State: | 6.3 |
| Here: | 3.9 |
| State: | 3.8 |

- Bedrooms in owner-occupied houses and condos in Long Beach, New York
- 327no bedroom
- 1,4821 bedroom
- 1,7782 bedrooms
- 2,7443 bedrooms
- 1,9544 bedrooms
- 7185+ bedrooms
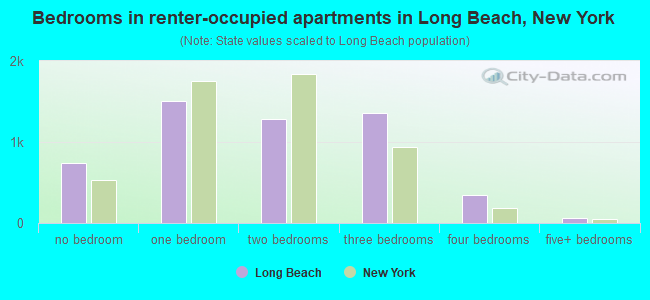
- Bedrooms in renter-occupied apartments in Long Beach, New York
- 735no bedroom
- 1,5091 bedroom
- 1,2822 bedrooms
- 1,3643 bedrooms
- 3494 bedrooms
- 595+ bedrooms
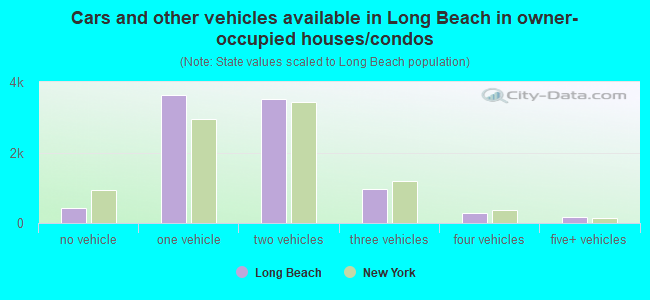
- Cars and other vehicles available in Long Beach in owner-occupied houses/condos
- 432no vehicle
- 3,6451 vehicle
- 3,5112 vehicles
- 9593 vehicles
- 2894 vehicles
- 1695+ vehicles
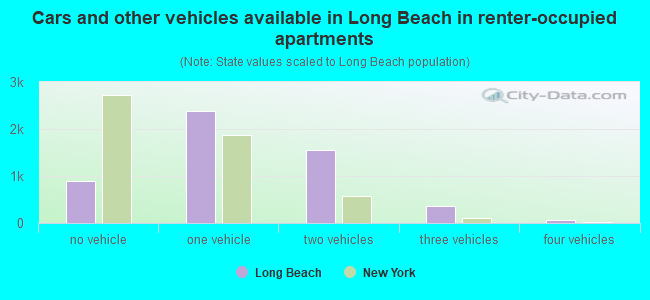
- Cars and other vehicles available in Long Beach in renter-occupied apartments
- 891no vehicle
- 2,3921 vehicle
- 1,5592 vehicles
- 3643 vehicles
- 734 vehicles
- 195+ vehicles
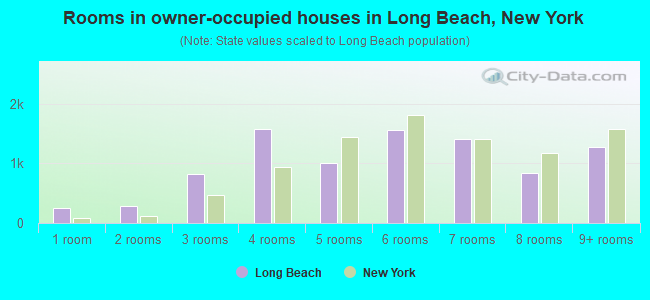
- Rooms in owner-occupied houses in Long Beach, New York
- 2431 room
- 2922 rooms
- 8243 rooms
- 1,5744 rooms
- 1,0125 rooms
- 1,5646 rooms
- 1,4007 rooms
- 8328 rooms
- 1,2649+ rooms
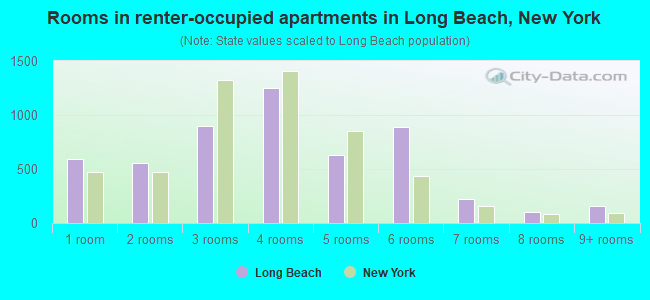
- Rooms in renter-occupied apartments in Long Beach, New York
- 5901 room
- 5552 rooms
- 8983 rooms
- 1,2514 rooms
- 6275 rooms
- 8906 rooms
- 2267 rooms
- 1018 rooms
- 1619+ rooms
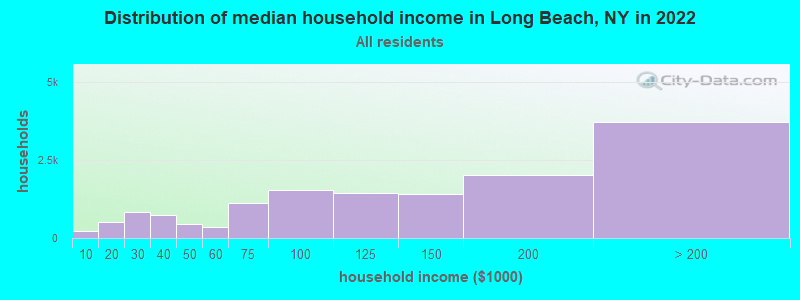
Long Beach, NY household income distribution

- 231Less than $10,000
- 511$10,000 to $19,999
- 841$20,000 to $29,999
- 747$30,000 to $39,999
- 438$40,000 to $49,999
- 346$50,000 to $59,999
- 1,134$60,000 to $74,999
- 1,526$75,000 to $99,999
- 1,439$100,000 to $124,999
- 1,410$125,000 to $149,999
- 2,026$150,000 to $199,999
- 3,717$200,000 or more
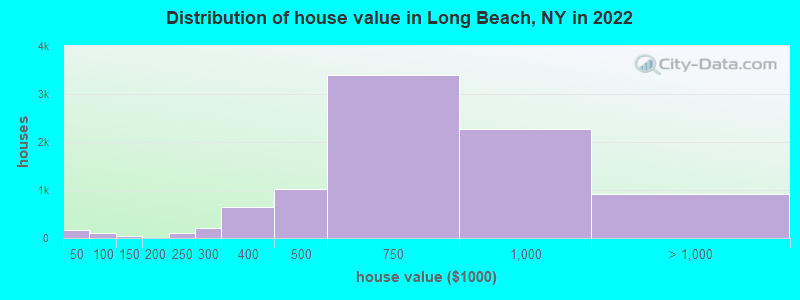
Home value of owner - occupied houses in 2022 in Long Beach, NY
-
- 113Less than $10,000
- 33$30,000 to $34,999
- 16$40,000 to $49,999
- 71$50,000 to $59,999
- 4$60,000 to $69,999
- 14$80,000 to $89,999
- 20$100,000 to $124,999
- 24$125,000 to $149,999
- 97$200,000 to $249,999
- 217$250,000 to $299,999
- 641$300,000 to $399,999
- 1,028$400,000 to $499,999
- 3,391$500,000 to $749,999
- 2,276$750,000 to $999,999
- 717$1,000,000 to $1,499,999
- 134$1,500,000 to $1,999,999
- 64$2,000,000 or more
Rent paid by renters in 2022 in Long Beach, NY
-
- 24$200 to $249
- 77$250 to $299
- 15$450 to $499
- 41$650 to $699
- 12$700 to $749
- 42$800 to $899
- 61$900 to $999
- 267$1,000 to $1,249
- 407$1,250 to $1,499
- 1,530$1,500 to $1,999
- 948$2,000 to $2,499
- 986$2,500 to $2,999
- 486$3,000 to $3,499
- 307$3,500 or more
- 64No cash rent
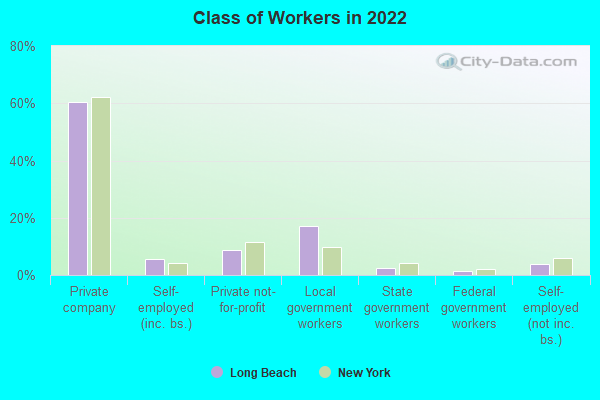
Percentage of workers working in this county: 65.7%
Number of people working at home: 3,460 (17.5% of all workers)
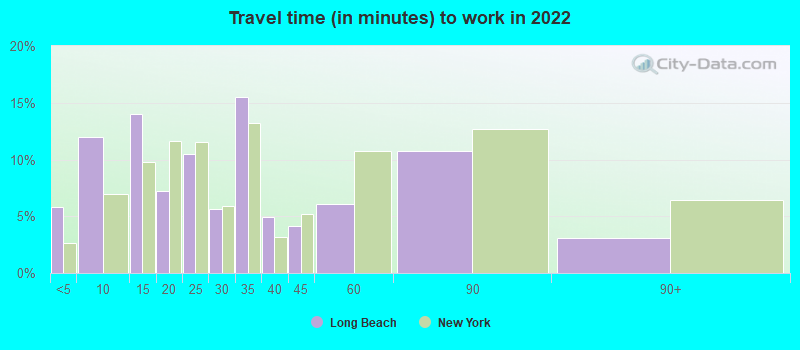
Travel time to work (commute)
- Less than 5 minutes: 484
- 5 to 9 minutes: 1,045
- 10 to 14 minutes: 1,082
- 15 to 19 minutes: 816
- 20 to 24 minutes: 1,039
- 25 to 29 minutes: 533
- 30 to 34 minutes: 2,421
- 35 to 39 minutes: 758
- 40 to 44 minutes: 729
- 45 to 59 minutes: 2,665
- 60 to 89 minutes: 2,863
- 90 or more minutes: 2,067
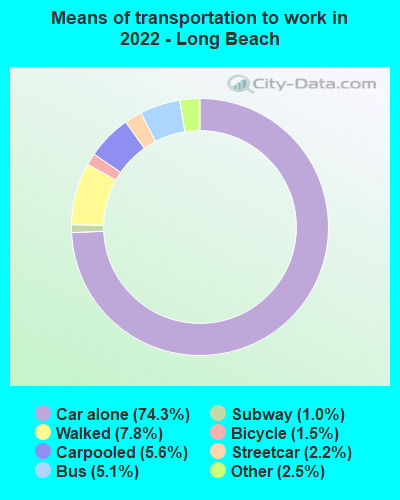
Means of transportation to work:
- Drove a car alone: 4,841 (50.1%)
- Carpooled: 351 (3.6%)
- Bus: 322 (3.3%)
- Subway or elevated rail: 128 (1.3%)
- Long-distance train or commuter rail: 59 (0.6%)
- Taxi: 230 (2.4%)
- Bicycle: 147 (1.5%)
- Walked: 546 (5.6%)
- Worked at home: 3,460 (35.8%)
- Unemployment by race in 2022
- Unemployment rate for White non-Hispanic residents
- 1.8%Males
- 2.1%Females
- Unemployment rate for Black residents
- 20.3%Males
- 10.4%Females
- Unemployment rate for Asian residents
- 0.2%Males
- 6.2%Females
- Unemployment rate for other race residents
- 5.5%Males
- 9.5%Females
- Unemployment rate for two or more race residents
- 0.5%Males
- 10.4%Females
- Unemployment rate for Hispanic or Latino residents
- 7.7%Males
- 5.5%Females
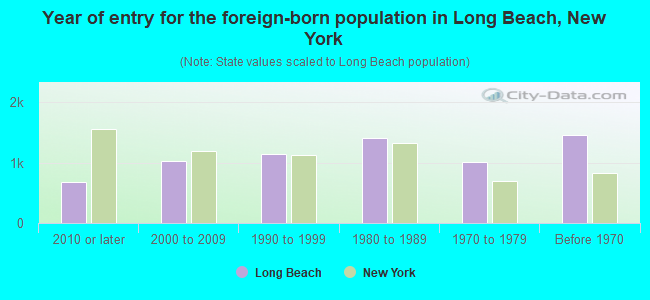
- Year of entry for the foreign-born population in Long Beach, New York
- 6762010 or later
- 1,0252000 to 2009
- 1,1411990 to 1999
- 1,4031980 to 1989
- 1,0021970 to 1979
- 1,451Before 1970
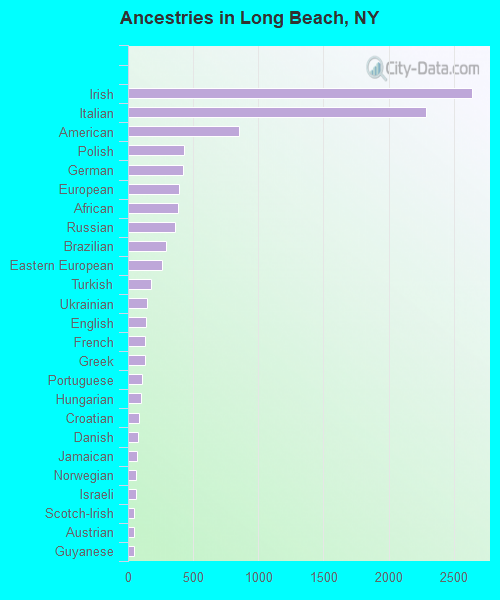
First ancestries reported:
- Irish: 2,638 (17.1%)
- Italian: 2,284 (14.8%)
- American: 848 (5.5%)
- Polish: 430 (2.8%)
- German: 422 (2.7%)
- European: 388 (2.5%)
- African: 382 (2.5%)
- Russian: 364 (2.4%)
- Brazilian: 289 (1.9%)
- Eastern European: 262 (1.7%)
- Turkish: 174 (1.1%)
- Ukrainian: 145 (0.9%)
- English: 136 (0.9%)
- French: 133 (0.9%)
- Greek: 128 (0.8%)
- Portuguese: 111 (0.7%)
- Hungarian: 100 (0.6%)
- Croatian: 85 (0.6%)
- Danish: 74 (0.5%)
- Jamaican: 66 (0.4%)
- Norwegian: 65 (0.4%)
- Israeli: 65 (0.4%)
- Scotch-Irish: 49 (0.3%)
- Austrian: 48 (0.3%)
- Guyanese: 45 (0.3%)
- Trinidadian and Tobagonian: 35 (0.2%)
- Welsh: 28 (0.2%)
- Czechoslovakian: 24 (0.2%)
- Czech: 21 (0.1%)
- Lithuanian: 19 (0.1%)
- Scottish: 18 (0.1%)
- Latvian: 17 (0.1%)
- Maltese: 17 (0.1%)
- Cypriot: 15 (0.10%)
- Armenian: 14 (0.09%)
- Palestinian: 12 (0.08%)
- Soviet Union: 12 (0.08%)
- Romanian: 10 (0.06%)
- Haitian: 9 (0.06%)
- Albanian: 7 (0.05%)
- Swiss: 7 (0.05%)
- Scandinavian: 2 (0.01%)
Most common places of birth for foreign-born residents (%):
| Long Beach: | 12.0% (636) |
| New York: | 2.0% (91,070) |
| Long Beach: | 7.4% (392) |
| New York: | 2.4% (108,067) |
| Long Beach: | 7.2% (381) |
| New York: | 0.7% (30,658) |
| Long Beach: | 6.1% (323) |
| New York: | 11.1% (501,040) |
| Long Beach: | 6.0% (319) |
| New York: | 0.1% (5,566) |
| Long Beach: | 5.7% (303) |
| New York: | 2.5% (111,920) |
| Long Beach: | 3.1% (167) |
| New York: | 3.9% (177,448) |
| Long Beach: | 3.0% (157) |
| New York: | 0.1% (2,564) |
| Long Beach: | 2.9% (155) |
| New York: | 0.4% (19,652) |
| Long Beach: | 2.9% (155) |
| New York: | 0.0% (1,860) |
| Long Beach: | 2.7% (145) |
| New York: | 1.8% (81,374) |
| Long Beach: | 2.6% (137) |
| New York: | 0.3% (11,831) |
| Long Beach: | 2.6% (136) |
| New York: | 0.0% (2,145) |
| Long Beach: | 2.5% (132) |
| New York: | 0.6% (26,772) |
| Long Beach: | 2.4% (126) |
| New York: | 3.8% (172,129) |
| Long Beach: | 2.3% (121) |
| New York: | 9.1% (410,910) |
| Long Beach: | 1.9% (100) |
| New York: | 1.2% (54,759) |
| Long Beach: | 1.8% (97) |
| New York: | 0.5% (21,009) |
| Long Beach: | 1.8% (96) |
| New York: | 0.1% (6,580) |
| Long Beach: | 1.7% (91) |
| New York: | 0.9% (38,713) |
| Long Beach: | 1.7% (89) |
| New York: | 1.7% (78,421) |
| Long Beach: | 1.6% (83) |
| New York: | 0.6% (28,604) |
Place of birth for U.S.-born residents:
- This state: 25,606
- Other state: 2,742
- Northeast: 1,002
- Midwest: 514
- South: 882
- West: 346
90.1% of Long Beach residents lived in the same house 1 years ago.
Out of people who lived in different houses, 39.8% lived in this county.
Out of people who lived in different counties, 76.6% lived in New York.
| Long Beach: | 90.1% |
| State average: | 89.6% |
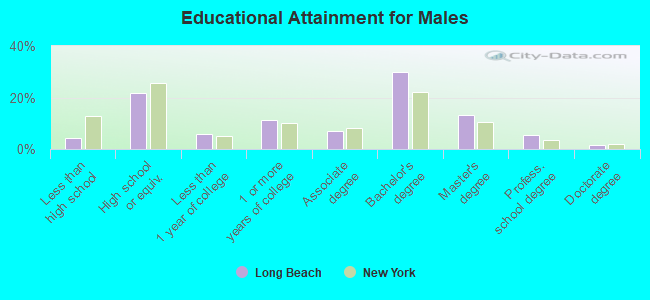
Education attainment for males 25 years and older:
- No schooling: 201
- Nursery to 4th grade: 10
- 5th and 6th grade: 64
- 7th and 8th grade: 68
- 9th grade: 63
- 10th grade: 24
- 11th grade: 25
- 12th grade, no diploma: 111
- High school graduate (or equivalency): 2,982
- Less than 1 year of college: 808
- Some college more than 1 year, no degree: 1,525
- Associate degree: 987
- Bachelor's degree: 4,112
- Master's degree: 1,828
- Professional school degree: 728
- Doctorate degree: 239
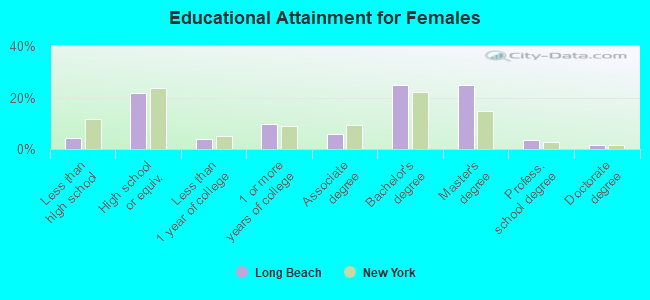
Education attainment for females 25 years and older:
- No schooling: 66
- Nursery to 4th grade: 15
- 5th and 6th grade: 101
- 7th and 8th grade: 128
- 9th grade: 22
- 10th grade: 87
- 11th grade: 4
- 12th grade, no diploma: 144
- High school graduate (or equivalency): 2,996
- Less than 1 year of college: 511
- Some college more than 1 year, no degree: 1,316
- Associate degree: 798
- Bachelor's degree: 3,434
- Master's degree: 3,456
- Professional school degree: 493
- Doctorate degree: 240


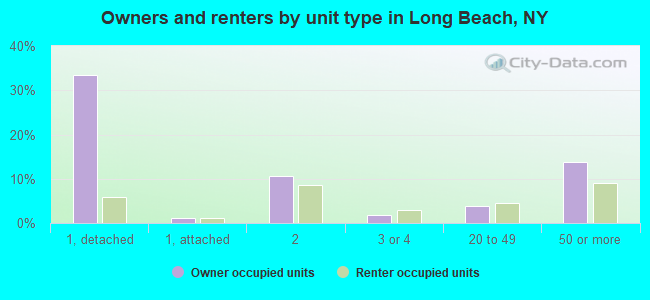
Housing units in structures:
- One, detached: 6,525
- One, attached: 393
- Two: 2,823
- 3 or 4: 590
- 5 to 9: 369
- 10 to 19: 431
- 20 to 49: 1,398
- 50 or more: 3,675
- Mobile homes: 106
Housing units lacking complete kitchen facilities in 2022: 1.0%
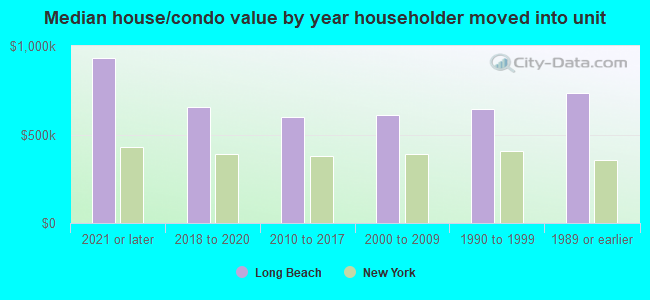
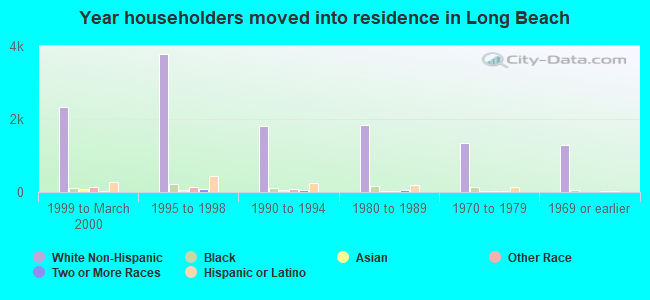
House/condo owner moved in on average 15 years ago
Renter moved in on average 2 years ago
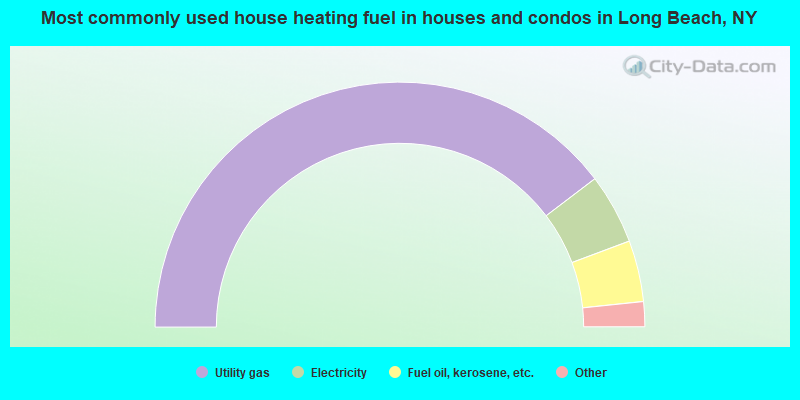
- 79.3%Utility gas
- 9.3%Electricity
- 8.1%Fuel oil, kerosene, etc.
- 2.4%Bottled, tank, or LP gas
- 0.6%Solar energy
- 0.1%Wood
- 0.1%Other fuel
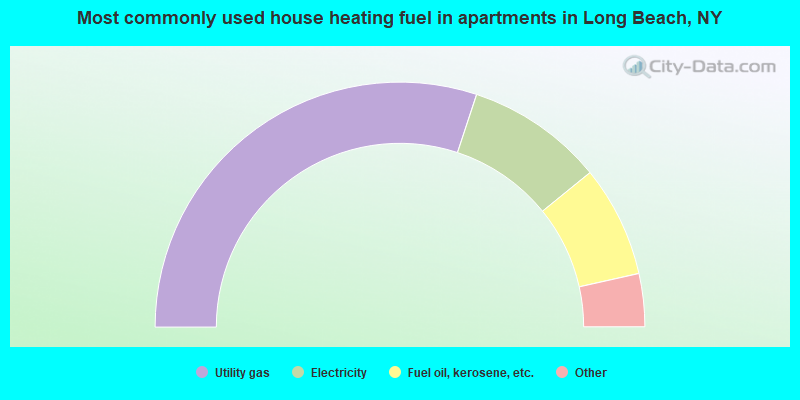
- 60.1%Utility gas
- 18.1%Electricity
- 14.7%Fuel oil, kerosene, etc.
- 3.9%Bottled, tank, or LP gas
- 2.6%No fuel used
- 0.5%Other fuel
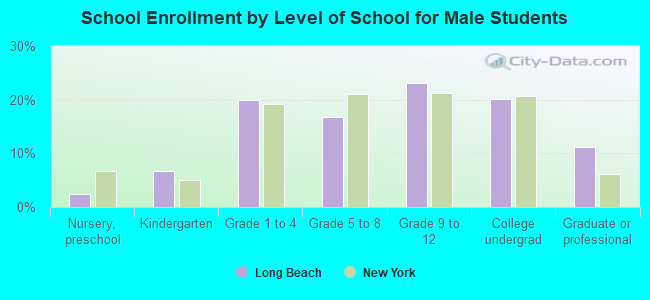
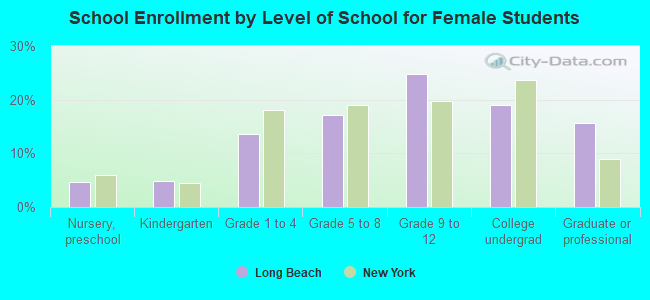
Private vs. public school enrollment:
| Here: | 7.7% |
| New York: | 15.6% |
| Here: | 14.1% |
| New York: | 15.0% |
| Here: | 48.0% |
| New York: | 39.2% |