Long Valley, NJ (New Jersey) Houses and Residents
| Long Valley: | $451,115 |
| New Jersey: | $428,900 |
Mean price in 2022:
Detached houses: $690,559
Here: $690,559 State: $537,591 Mobile homes: $159,023
Here: $159,023 State: $119,788
Total population: 1,879 (Urban population: 777, Rural population: 1,132 (68 farm, 1,064 nonfarm))
Houses: 873 (759 occupied: 683 owner occupied, 88 renter occupied)
| % of renters here: | 11% |
| State: | 35% |
Housing density: 185 houses/condos per square mile
Median price asked for vacant for-sale houses and condos in 2022 in this county: $423,360.
Median contract rent in 2022: $1,318 (lower quartile is $1,246, upper quartile is $1,376)
Median gross rent in Long Valley, NJ in 2022: $1,642
Housing units in Long Valley with a mortgage: 411 (70 second mortgage, 0 home equity loan, 56 both second mortgage and home equity loan)
Houses without a mortgage: 0
Median household income for houses/condos with a mortgage: $172,505
Median household income for apartments without a mortgage: $102,206
Median monthly housing costs: $2,379
Compare current foreclosures near Long Valley, NJ:
| Photo | Address | Area | Beds / Baths | Price | Details |
|---|---|---|---|---|---|

|
#1
Old Farmers Rd # A
Long Valley, NJ 07853
|
2,543 sq. feet
|
- baths - beds |
show details | |

|
#2
Fairview Ave
Long Valley, NJ 07853
|
1,892 sq. feet
|
- baths - beds |
show details | |

|
#3
Flocktown Rd
Long Valley, NJ 07853
|
- sq. feet
|
- baths - beds |
show details | |

|
#4
Kim Ln
Long Valley, NJ 07853
|
3,810 sq. feet
|
- baths - beds |
show details | |

|
#5
Wolfe Run Ct
Long Valley, NJ 07853
|
5,841 sq. feet
|
- baths - beds |
show details | |

|
#6
Ann Rd
Long Valley, NJ 07853
|
2,188 sq. feet
|
- baths - beds |
show details | |

|
#7
W Valley Brook Rd
Long Valley, NJ 07853
|
1,221 sq. feet
|
- baths - beds |
show details | |

|
#8
Cedar Ct
Long Valley, NJ 07853
|
2,198 sq. feet
|
- baths - beds |
show details | |

|
#9
Nestlingwood Dr
Long Valley, NJ 07853
|
2,306 sq. feet
|
- baths - beds |
show details | |

|
#10
Schooleys Mountain Rd
Long Valley, NJ 07853
|
- sq. feet
|
- baths - beds |
show details |
| Photo | Address | Area | Beds / Baths | Price | Details |
|---|---|---|---|---|---|

|
#11
Parker Rd
Long Valley, NJ 07853
|
2,296 sq. feet
|
- baths - beds |
show details | |

|
#12
Fairmount Rd
Long Valley, NJ 07853
|
1,574 sq. feet
|
- baths - beds |
show details | |

|
#13
Pleasant Grove Rd
Long Valley, NJ 07853
|
1,887 sq. feet
|
- baths - beds |
show details | |

|
#14
Woodland Dr
Long Valley, NJ 07853
|
- sq. feet
|
- baths - beds |
show details | |

|
#15
Ramsey Way
Long Valley, NJ 07853
|
3,248 sq. feet
|
- baths - beds |
show details | |

|
#16
Fox Hill Rd
Long Valley, NJ 07853
|
- sq. feet
|
- baths - beds |
show details | |

|
#17
Markham Dr
Long Valley, NJ 07853
|
2,648 sq. feet
|
- baths - beds |
show details | |

|
#18
Fox Hill Rd
Long Valley, NJ 07853
|
3,464 sq. feet
|
- baths - beds |
show details | |

|
#19
Jones Ln
Long Valley, NJ 07853
|
- sq. feet
|
- baths - beds |
show details | |

|
#20
Jones Ln
Long Valley, NJ 07853
|
- sq. feet
|
- baths - beds |
show details |
| Photo | Address | Area | Beds / Baths | Price | Details |
|---|---|---|---|---|---|

|
#21
Winay Ter
Long Valley, NJ 07853
|
2,618 sq. feet
|
- baths - beds |
show details | |

|
#22
Bucknell Trl
Hopatcong, NJ 07843
|
672 sq. feet
|
1 baths 2 beds |
$279,900
|
show details |

|
#23
Hill St
Washington, NJ 07882
|
2,418 sq. feet
|
2 baths 5 beds |
$322,500
|
show details |

|
#24
Jersey Ave
Morristown, NJ 07960
|
2,406 sq. feet
|
2 baths 4 beds |
$665,000
|
show details |

|
#25
Buckley Ave
Oxford, NJ 07863
|
1,872 sq. feet
|
1 baths 3 beds |
$439,900
|
show details |

|
#26
Aspen Ct
Stanhope, NJ 07874
|
861 sq. feet
|
1 baths 1 beds |
show details | |

|
#27
Slope Dr
Hackettstown, NJ 07840
|
1,310 sq. feet
|
1 baths 3 beds |
show details | |

|
#28
Center St
Clinton, NJ 08809
|
1,824 sq. feet
|
1 baths 2 beds |
show details | |

|
#29
Ironia Rd
Mendham, NJ 07945
|
4,522 sq. feet
|
4 baths 5 beds |
show details | |

|
#30
Rollins Trl
Hopatcong, NJ 07843
|
2,251 sq. feet
|
2 baths 3 beds |
show details |
| Photo | Address | Area | Beds / Baths | Price | Details |
|---|---|---|---|---|---|

|
#31
W Baldwin St
Hackettstown, NJ 07840
|
1,778 sq. feet
|
2 baths 3 beds |
show details | |

|
#32
Presidential Dr
Washington, NJ 07882
|
920 sq. feet
|
1 baths 3 beds |
show details | |

|
#33
Vivian Plz
Newton, NJ 07860
|
1,776 sq. feet
|
2 baths 3 beds |
show details | |

|
#34
State Route 10 Bldg
Morris Plains, NJ 07950
|
800 sq. feet
|
1 baths 1 beds |
show details | |

|
#35
Rt 10 Building 21
Morris Plains, NJ 07950
|
- sq. feet
|
1 baths 1 beds |
show details | |

|
#36
Birch Pkwy
Sparta, NJ 07871
|
1,792 sq. feet
|
3 baths 3 beds |
show details | |

|
#37
Hutchins Ln
Randolph, NJ 07869
|
3,731 sq. feet
|
3 baths 4 beds |
show details | |

|
#38
Sand Shore Rd
Budd Lake, NJ 07828
|
936 sq. feet
|
1 baths 2 beds |
show details | |

|
#39
Kensington Ct
Morristown, NJ 07960
|
4,424 sq. feet
|
6 baths 6 beds |
show details | |

|
#40
Tamarack Rd
Belvidere, NJ 07823
|
3,466 sq. feet
|
2 baths 4 beds |
show details |
| Photo | Address | Area | Beds / Baths | Price | Details |
|---|---|---|---|---|---|

|
#41
Warren Ct
Sparta, NJ 07871
|
1,755 sq. feet
|
2 baths 4 beds |
show details | |

|
#42
Douglas Dr
Sparta, NJ 07871
|
5,746 sq. feet
|
5 baths 4 beds |
show details | |

|
#43
Water St
Lebanon, NJ 08833
|
- sq. feet
|
8 baths 6 beds |
show details | |

|
#44
Timbercroft Rd
High Bridge, NJ 08829
|
768 sq. feet
|
- baths - beds |
show details | |

|
#45
Victory Ct
Dover, NJ 07801
|
1,090 sq. feet
|
- baths - beds |
show details | |

|
#46
Lexington Ave
Neshanic Station, NJ 08853
|
2,462 sq. feet
|
- baths - beds |
show details | |

|
#47
Lopatcong St
Belvidere, NJ 07823
|
1,318 sq. feet
|
- baths - beds |
show details | |

|
#48
Sanatorium Rd
Glen Gardner, NJ 08826
|
846 sq. feet
|
- baths - beds |
show details | |

|
#49
Maple Path
Landing, NJ 07850
|
2,432 sq. feet
|
- baths - beds |
show details | |

|
Check over 1 million property listings on Foreclosure.com!
|
browse all offers | |||


Median year apartment built: 1966
Household type by relationship:
Households: 2,055- Male householders: 333 (43 living alone), Female householders: 423 (75 living alone)
532 spouses (509 opposite-sex spouses), 20 unmarried partners, (7 opposite-sex unmarried partners), 717 children (590 natural, 24 adopted, 102 stepchildren), 0 grandchildren, 0 brothers or sisters, 9 parents, 0 foster children, 7 other relatives, 0 non-relatives
- In group quarters: 12
Size of family households: 326 2-persons, 101 3-persons, 135 4-persons, 75 5-persons.
Size of nonfamily households: 114 1-person, 17 2-persons.
440 married couples with children.
75 single-parent households (56 men, 19 women).
79.8% of residents of Long Valley speak English at home.
14.0% of residents speak Spanish at home (79% speak English very well, 15% speak English well, 6% don't speak English at all).
4.3% of residents speak other Indo-European language at home (100% speak English very well).
1.0% of residents speak Asian or Pacific Island language at home (80% speak English well, 20% speak English not well).
Foreign born population: 263 (12.8%)
(63.9% of them are naturalized citizens)
| Here: | 7.6 |
| State: | 6.8 |
| Here: | 3.7 |
| State: | 3.9 |

- Bedrooms in owner-occupied houses and condos in Long Valley, New Jersey
- 0no bedroom
- 01 bedroom
- 392 bedrooms
- 3363 bedrooms
- 2894 bedrooms
- 205+ bedrooms

- Bedrooms in renter-occupied apartments in Long Valley, New Jersey
- 0no bedroom
- 251 bedroom
- 532 bedrooms
- 103 bedrooms
- 04 bedrooms
- 05+ bedrooms

- Cars and other vehicles available in Long Valley in owner-occupied houses/condos
- 0no vehicle
- 1111 vehicle
- 3372 vehicles
- 1803 vehicles
- 244 vehicles
- 335+ vehicles

- Cars and other vehicles available in Long Valley in renter-occupied apartments
- 0no vehicle
- 251 vehicle
- 532 vehicles
- 103 vehicles
- 04 vehicles
- 05+ vehicles

- Rooms in owner-occupied houses in Long Valley, New Jersey
- 01 room
- 02 rooms
- 143 rooms
- 154 rooms
- 1145 rooms
- 1016 rooms
- 677 rooms
- 978 rooms
- 2759+ rooms

- Rooms in renter-occupied apartments in Long Valley, New Jersey
- 01 room
- 02 rooms
- 253 rooms
- 534 rooms
- 105 rooms
- 06 rooms
- 07 rooms
- 08 rooms
- 09+ rooms


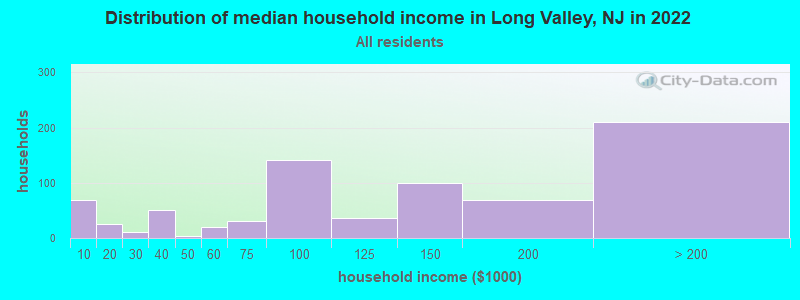
Long Valley, NJ household income distribution

- 68Less than $10,000
- 25$10,000 to $19,999
- 11$20,000 to $29,999
- 50$30,000 to $39,999
- 3$40,000 to $49,999
- 20$50,000 to $59,999
- 31$60,000 to $74,999
- 141$75,000 to $99,999
- 36$100,000 to $124,999
- 99$125,000 to $149,999
- 68$150,000 to $199,999
- 210$200,000 or more
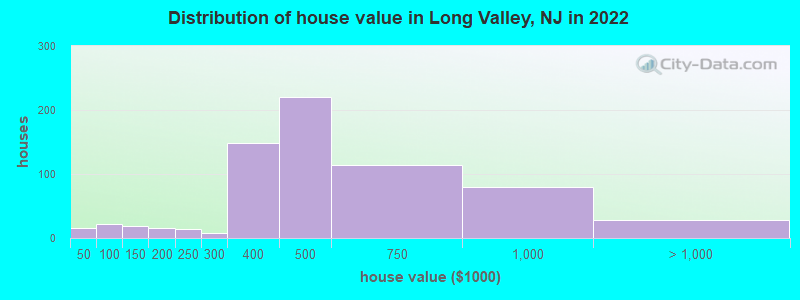
Home value of owner - occupied houses in 2022 in Long Valley, NJ
-
- 15$15,000 to $19,999
- 10$50,000 to $59,999
- 11$90,000 to $99,999
- 17$125,000 to $149,999
- 7$150,000 to $174,999
- 7$175,000 to $199,999
- 14$200,000 to $249,999
- 8$250,000 to $299,999
- 149$300,000 to $399,999
- 219$400,000 to $499,999
- 113$500,000 to $749,999
- 79$750,000 to $999,999
- 28$1,000,000 to $1,499,999
Rent paid by renters in 2022 in Long Valley, NJ
-
- 7$800 to $899
- 8$1,000 to $1,249
- 55$1,250 to $1,499
- 17$1,500 to $1,999


Percentage of workers working in this county: 66.7%
Number of people working at home: 199 (20.1% of all workers)
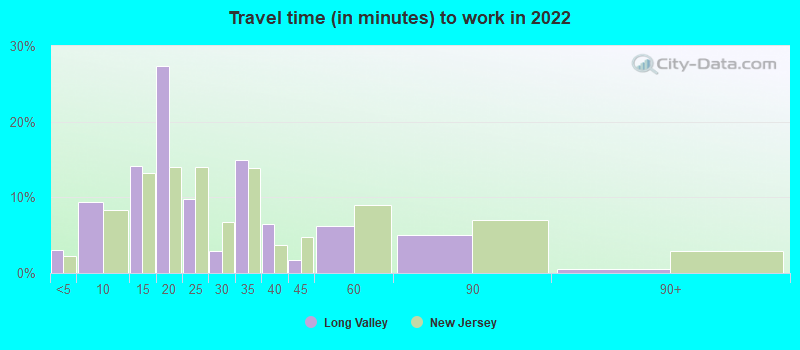
Travel time to work (commute)
- Less than 5 minutes: 40
- 5 to 9 minutes: 32
- 10 to 14 minutes: 82
- 15 to 19 minutes: 46
- 20 to 24 minutes: 87
- 25 to 29 minutes: 36
- 30 to 34 minutes: 41
- 35 to 39 minutes: 91
- 40 to 44 minutes: 0
- 45 to 59 minutes: 126
- 60 to 89 minutes: 118
- 90 or more minutes: 70
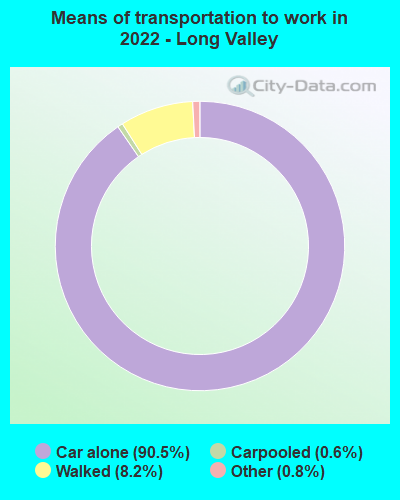
Means of transportation to work:
- Drove a car alone: 909 (73.7%)
- Carpooled: 5 (0.4%)
- Taxi: 9 (0.7%)
- Walked: 111 (9.0%)
- Worked at home: 199 (16.1%)

- Unemployment by race in 2022
- Unemployment rate for White non-Hispanic residents
- 4.7%Males
- 1.6%Females

- Year of entry for the foreign-born population in Long Valley, New Jersey
- 672010 or later
- 1032000 to 2009
- 601990 to 1999
- 71980 to 1989
- 61970 to 1979
- 26Before 1970

First ancestries reported:
- Italian: 111 (14.7%)
- Irish: 85 (11.2%)
- German: 60 (7.9%)
- European: 59 (7.8%)
- English: 44 (5.8%)
- Polish: 36 (4.8%)
- American: 17 (2.2%)
- Canadian: 16 (2.1%)
- French: 14 (1.9%)
- Belgian: 12 (1.6%)
- Northern European: 10 (1.3%)
- Norwegian: 7 (0.9%)
- Portuguese: 7 (0.9%)
- Scottish: 6 (0.8%)
Most common places of birth for foreign-born residents (%):
| Long Valley: | 26.4% (72) |
| New Jersey: | 2.2% (46,813) |
| Long Valley: | 15.0% (41) |
| New Jersey: | 0.9% (18,317) |
| Long Valley: | 14.3% (39) |
| New Jersey: | 0.5% (10,246) |
| Long Valley: | 10.6% (29) |
| New Jersey: | 1.7% (37,335) |
| Long Valley: | 8.8% (24) |
| New Jersey: | 3.7% (78,969) |
| Long Valley: | 7.0% (19) |
| New Jersey: | 0.1% (2,517) |
| Long Valley: | 5.5% (15) |
| New Jersey: | 12.8% (274,609) |
| Long Valley: | 4.8% (13) |
| New Jersey: | 2.3% (48,811) |
| Long Valley: | 3.3% (9) |
| New Jersey: | 0.0% (655) |
| Long Valley: | 3.3% (9) |
| New Jersey: | 2.1% (46,020) |
| Long Valley: | 2.2% (6) |
| New Jersey: | 0.3% (6,882) |
Place of birth for U.S.-born residents:
- This state: 1,257
- Other state: 542
- Northeast: 404
- Midwest: 43
- South: 35
- West: 62
90.6% of Long Valley residents lived in the same house 1 years ago.
Out of people who lived in different houses, 29.9% lived in this county.
Out of people who lived in different counties, 100.0% lived in New Jersey.
| Long Valley: | 90.6% |
| State average: | 90.4% |
Education attainment for males 25 years and older:
- No schooling: 0
- Nursery to 4th grade: 34
- 5th and 6th grade: 0
- 7th and 8th grade: 3
- 9th grade: 0
- 10th grade: 0
- 11th grade: 0
- 12th grade, no diploma: 0
- High school graduate (or equivalency): 77
- Less than 1 year of college: 45
- Some college more than 1 year, no degree: 21
- Associate degree: 65
- Bachelor's degree: 134
- Master's degree: 222
- Professional school degree: 31
- Doctorate degree: 36

Education attainment for females 25 years and older:
- No schooling: 6
- Nursery to 4th grade: 0
- 5th and 6th grade: 0
- 7th and 8th grade: 0
- 9th grade: 0
- 10th grade: 0
- 11th grade: 0
- 12th grade, no diploma: 0
- High school graduate (or equivalency): 85
- Less than 1 year of college: 40
- Some college more than 1 year, no degree: 57
- Associate degree: 112
- Bachelor's degree: 219
- Master's degree: 190
- Professional school degree: 0
- Doctorate degree: 0


Housing units in structures:
- One, detached: 711
- One, attached: 39
- Two: 16
- 3 or 4: 27
- Mobile homes: 79
House/condo owner moved in on average 21 years ago
Renter moved in on average 3 years ago

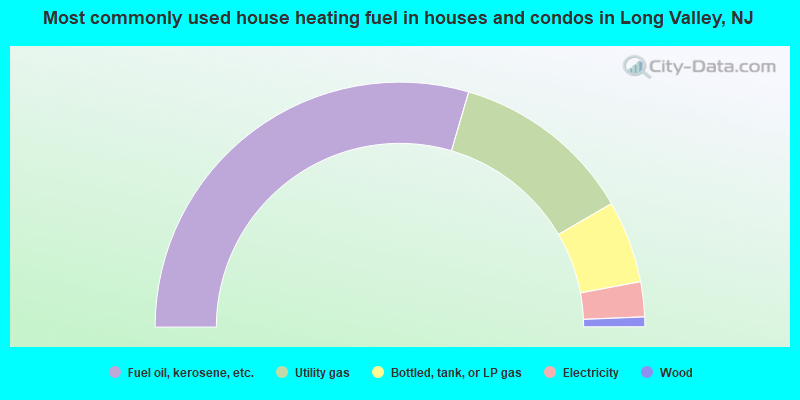
- 59.0%Fuel oil, kerosene, etc.
- 24.1%Utility gas
- 10.9%Bottled, tank, or LP gas
- 4.6%Electricity
- 1.3%Wood
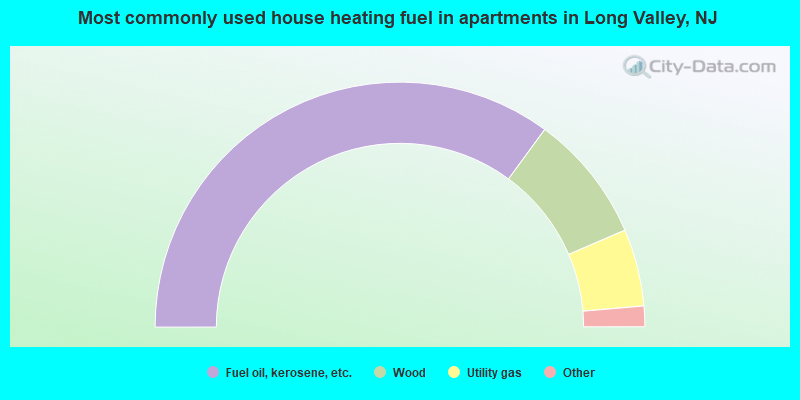
- 72.1%Fuel oil, kerosene, etc.
- 17.4%Wood
- 10.5%Utility gas
Private vs. public school enrollment:
| Here: | 19.8% |
| New Jersey: | 12.3% |
| Here: | 0.0% |
| New Jersey: | 13.1% |
| Here: | 57.1% |
| New Jersey: | 33.2% |


