Longwood, FL (Florida) Houses and Residents
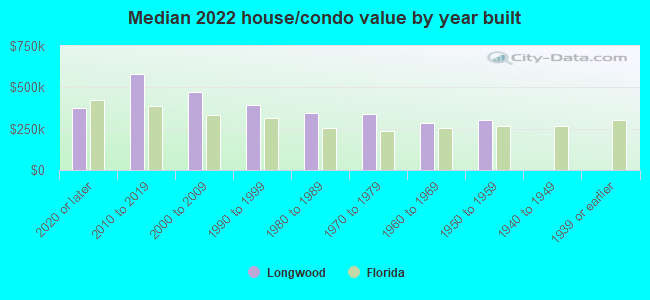
Estimated median house or condo value in 2022: $342,544 (it was $100,000 in 2000 )
Longwood:
$342,544Florida:
$354,100
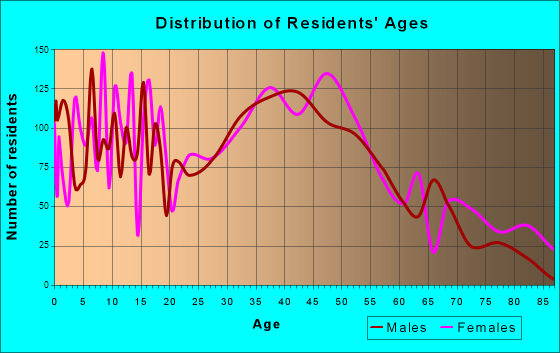
Lower value quartile - upper value quartile: $272,502 - $451,095Total population: 13,877 (Urban population: 13,712, Rural population: 0)
Houses: 6,247 (5,849 occupied: 4,281 owner occupied, 1,612 renter occupied )
% of renters here:
27%State:
33%
Housing density: 1,174 houses/condos per square mile
Median price asked for vacant for-sale houses and condos in 2022: $282,130.
Median contract rent in 2022: $1,464 (lower quartile is $1,162, upper quartile is $1,933)
Median rent asked for vacant for-rent units in 2022: $1,755
Median gross rent in Longwood, FL in 2022: $1,696
Housing units in Longwood with a mortgage: 2,852 (212 second mortgage, 48 home equity loan, 158 both second mortgage and home equity loan )Houses without a mortgage: 82
Median household income for houses/condos with a mortgage: $97,746
Median household income for apartments without a mortgage: $80,466
Median monthly housing costs: $1,480
Data:
Median house or condo value ($)
Median house or condo value ($ change since 2000)
Median house or condo value ($) - White
Median house or condo value ($) - Black or African American
Median house or condo value ($) - Asian
Median house or condo value ($) - Hispanic or Latino
Median house or condo value ($) - American Indian and Alaska Native
Median house or condo value ($) - Multirace
Median house or condo value ($) - Other Race
Median price asked for mobile homes ($)
Household density (households per square mile)
Mean house or condo value by units in structure - 1, detached ($)
Mean house or condo value by units in structure - 1, attached ($)
Mean house or condo value by units in structure - 2 ($)
Mean house or condo value by units in structure by units in structure - 3 or 4 ($)
Mean house or condo value by units in structure - 5 or more ($)
Mean house or condo value by units in structure - Boat, RV, van, etc. ($)
Mean house or condo value by units in structure - Mobile home ($)
Median contract rent ($)
Median contract rent - Lower quartile ($)
Median contract rent - Upper quartile ($)
Median gross rent ($)
Urban houses (%)
Rural houses (%)
Houses occupied (%)
Houses occupied (% change since 2000)
Houses owner occupied (%)
Houses owner occupied (% change since 2000)
Houses renter occupied (%)
Houses renter occupied (% change since 2000)
Vacant housing units - For rent (%)
Vacant housing units - For rent (% change since 2000)
Vacant housing units - For sale only (%)
Vacant housing units - For sale only (% change since 2000)
Vacant housing units - Rented or sold, not occupied (%)
Vacant housing units - Rented or sold, not occupied (% change since 2000)
Vacant housing units - For seasonal, recreational, or occasional use (%)
Vacant housing units - For seasonal, recreational, or occasional use (% change since 2000)
Vacant housing units - For migrant workers (%)
Vacant housing units - For migrant workers (% change since 2000)
Vacant housing units - Other vacant (%)
Vacant housing units - Other vacant (% change since 2000)
Median monthly housing costs ($)
Median household income for houses/condos with a mortgage ($)
Median household income for houses/condos without a mortgage ($)
Median household income ($)
Median household income ($) - White
Median household income ($) - Black or African American
Median household income ($) - Asian
Median household income ($) - Hispanic or Latino
Median household income ($) - American Indian and Alaska Native
Median household income ($) - Multirace
Median household income ($) - Other Race
Mortgage status - with mortgage (%)
Mortgage status - with second mortgage (%)
Mortgage status - with home equity loan (%)
Mortgage status - with both second mortgage and home equity loan (%)
Mortgage status - without a mortgage (%)
Median year house/condo built
Median year apartment built
Household type by relationship - Male householder living alone (%)
Household type by relationship - Male householder not living alone (%)
Household type by relationship - Female householder living alone (%)
Household type by relationship - Female householder not living alone (%)
Household type by relationship - Opposite-Sex spouse (%)
Household type by relationship - Same-Sex spouse (%)
Household type by relationship - Opposite-Sex unmarried partner (%)
Household type by relationship - Same-Sex unmarried partner (%)
Household type by relationship - In group quarters (%)
Size of family households - 2-person household (%)
Size of family households - 3-person household (%)
Size of family households - 4-person household (%)
Size of family households - 5-person household (%)
Size of family households - 6-person household (%)
Size of family households - 7-or-more-person household (%)
Size of nonfamily households - 1-person household (%)
Size of nonfamily households - 2-person household (%)
Size of nonfamily households - 3-person household (%)
Size of nonfamily households - 4-person household (%)
Size of nonfamily households - 5-person household (%)
Size of nonfamily households - 6-person household (%)
Size of nonfamily households - 7-or-moreperson household (%)
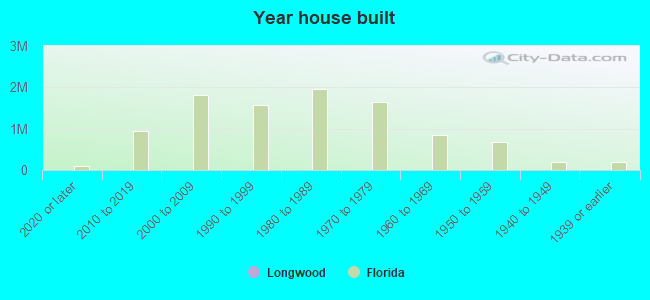
Year house built - Built 2010 or later (%)
Year house built - Built 2000 to 2009 (%)
Year house built - Built 1990 to 1999 (%)
Year house built - Built 1980 to 1989 (%)
Year house built - Built 1970 to 1979 (%)
Year house built - Built 1960 to 1969 (%)
Year house built - Built 1950 to 1959 (%)
Year house built - Built 1940 to 1949 (%)
Year house built - Built 1939 or earlier (%)
Median number of rooms in houses and condos
Median number of rooms in apartments
Median number of bedrooms in owner occupied houses
Mean number of bedrooms in owner occupied houses
Median number of bedrooms in renter occupied houses
Mean number of bedrooms in renter occupied houses
Median number of vehichles in owner occupied houses
Mean number of vehichles in owner occupied houses
Median number of vehichles in renter occupied houses
Mean number of vehichles in renter occupied houses
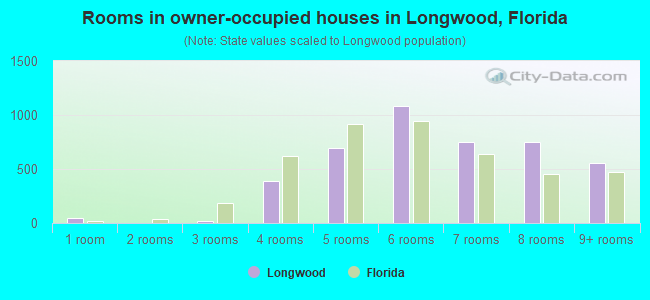
Rooms in owner-occupied houses - 1 room (%)
Rooms in owner-occupied houses - 2 rooms (%)
Rooms in owner-occupied houses - 3 rooms (%)
Rooms in owner-occupied houses - 4 rooms (%)
Rooms in owner-occupied houses - 5 rooms (%)
Rooms in owner-occupied houses - 6 rooms (%)
Rooms in owner-occupied houses - 7 rooms (%)
Rooms in owner-occupied houses - 8 rooms (%)
Rooms in owner-occupied houses - 9+ rooms (%)
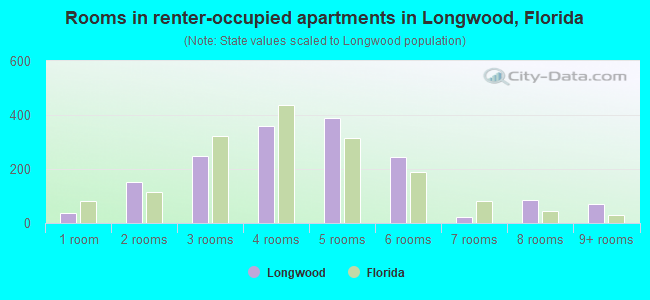
Rooms in renter-occupied houses - 1 room (%)
Rooms in renter-occupied houses - 2 rooms (%)
Rooms in renter-occupied houses - 3 rooms (%)
Rooms in renter-occupied houses - 4 rooms (%)
Rooms in renter-occupied houses - 5 rooms (%)
Rooms in renter-occupied houses - 6 rooms (%)
Rooms in renter-occupied houses - 7 rooms (%)
Rooms in renter-occupied houses - 8 rooms (%)
Rooms in renter-occupied houses - 9+ rooms (%)
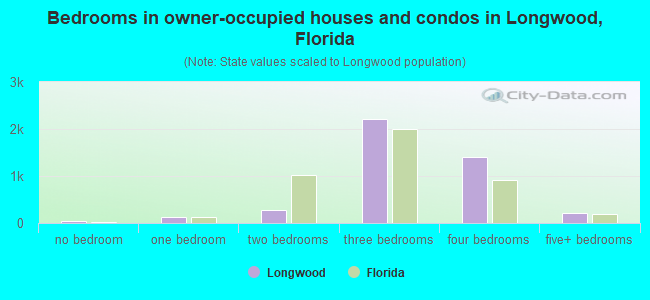
Bedrooms in owner-occupied houses - no bedrooms (%)
Bedrooms in owner-occupied houses - 1 bedroom (%)
Bedrooms in owner-occupied houses - 2 bedrooms (%)
Bedrooms in owner-occupied houses - 3 bedrooms (%)
Bedrooms in owner-occupied houses - 4 bedrooms (%)
Bedrooms in owner-occupied houses - 5+ bedrooms (%)
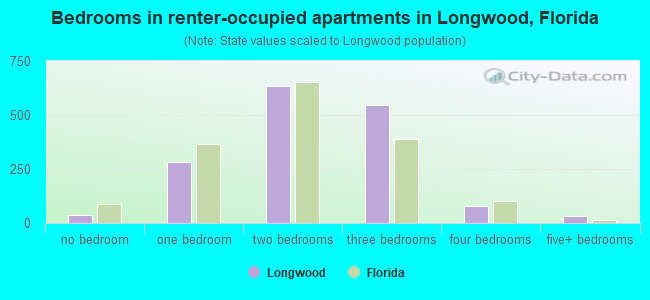
Bedrooms in renter-occupied houses - no bedrooms (%)
Bedrooms in renter-occupied houses - 1 bedroom (%)
Bedrooms in renter-occupied houses - 2 bedrooms (%)
Bedrooms in renter-occupied houses - 3 bedrooms (%)
Bedrooms in renter-occupied houses - 4 bedrooms (%)
Bedrooms in renter-occupied houses - 5+ bedrooms (%)
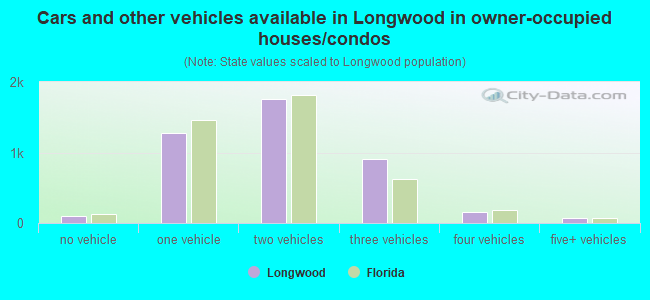
Vehicles available in owner-occupied houses - no vehicle available (%)
Vehicles available in owner-occupied houses - 1 vehicle available(%)
Vehicles available in owner-occupied houses - 2 Vehicles available (%)
Vehicles available in owner-occupied houses - 3 Vehicles available (%)
Vehicles available in owner-occupied houses - 4 Vehicles available (%)
Vehicles available in owner-occupied houses - 5+ Vehicles available (%)
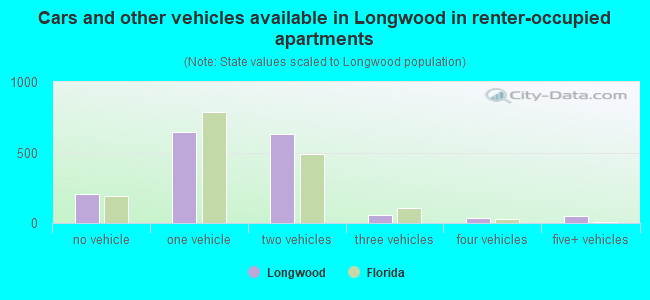
Vehicles available in renter-occupied houses - no vehicle available (%)
Vehicles available in renter-occupied houses - 1 vehicle available (%)
Vehicles available in renter-occupied houses - 2 Vehicles available (%)
Vehicles available in renter-occupied houses - 3 Vehicles available (%)
Vehicles available in renter-occupied houses - 4 Vehicles available (%)
Vehicles available in renter-occupied houses - 5+ Vehicles available (%)
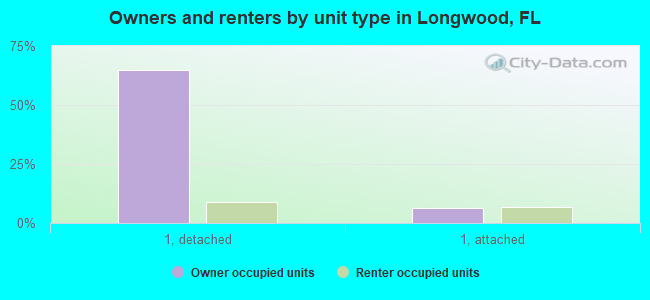
Housing units in structures - 1, detached (%)
Housing units in structures - 1, attached (%)
Housing units in structures - 2 (%)
Housing units in structures - 3 or 4 (%)
Housing units in structures - 5 to 9 (%)
Housing units in structures - 10 to 19 (%)
Housing units in structures - 20 to 49 (%)
Housing units in structures - 50 or more (%)
Housing units in structures - Mobile home (%)
Housing units in structures - Boat, RV, van, etc. (%)
Housing units in structures - Owners - 1, detached (%)
Housing units in structures - Owners - 1, attached (%)
Housing units in structures - Owners - 2 (%)
Housing units in structures - Owners - 3 or 4 (%)
Housing units in structures - Owners - 5 to 9 (%)
Housing units in structures - Owners - 10 to 19 (%)
Housing units in structures - Owners - 20 to 49 (%)
Housing units in structures - Owners - 50 or more (%)
Housing units in structures - Owners - Mobile home (%)
Housing units in structures - Owners - Boat, RV, van, etc. (%)
Housing units in structures - Renters - 1, detached (%)
Housing units in structures - Renters - 1, attached (%)
Housing units in structures - Renters - 2 (%)
Housing units in structures - Renters - 3 or 4 (%)
Housing units in structures - Renters - 5 to 9 (%)
Housing units in structures - Renters - 10 to 19 (%)
Housing units in structures - Renters - 20 to 49 (%)
Housing units in structures - Renters - 50 or more (%)
Housing units in structures - Renters - Mobile home (%)
Housing units in structures - Renters - Boat, RV, van, etc. (%)
House/condo owner moved in on average (years ago)
Renter moved in on average (years ago)
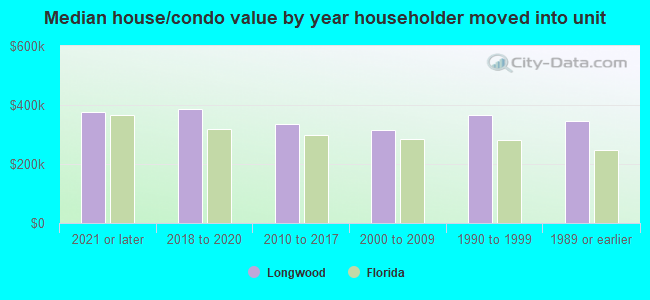
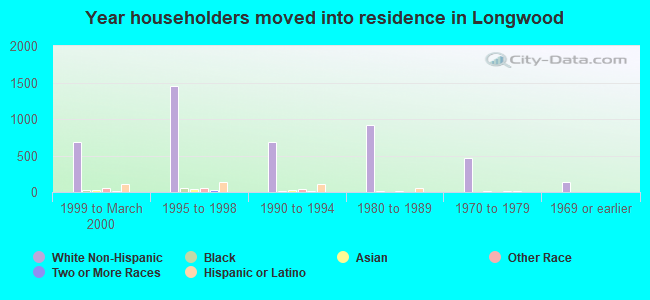
Year householder moved into unit - Moved in 1999 to March 2000 (%)
Year householder moved into unit - Moved in 1999 to March 2000 (%) - White
Year householder moved into unit - Moved in 1999 to March 2000 (%) - Black or African American
Year householder moved into unit - Moved in 1999 to March 2000 (%) - Asian
Year householder moved into unit - Moved in 1999 to March 2000 (%) - Hispanic or Latino
Year householder moved into unit - Moved in 1999 to March 2000 (%) - American Indian and Alaska Native
Year householder moved into unit - Moved in 1999 to March 2000 (%) - Multirace
Year householder moved into unit - Moved in 1999 to March 2000 (%) - Other Race
Year householder moved into unit - Moved in 1995 to 1998 (%)
Year householder moved into unit - Moved in 1995 to 1998 (%) - White
Year householder moved into unit - Moved in 1995 to 1998 (%) - Black or African American
Year householder moved into unit - Moved in 1995 to 1998 (%) - Asian
Year householder moved into unit - Moved in 1995 to 1998 (%) - Hispanic or Latino
Year householder moved into unit - Moved in 1995 to 1998 (%) - American Indian and Alaska Native
Year householder moved into unit - Moved in 1995 to 1998 (%) - Multirace
Year householder moved into unit - Moved in 1995 to 1998 (%) - Other Race
Year householder moved into unit - Moved in 1990 to 1994 (%)
Year householder moved into unit - Moved in 1990 to 1994 (%) - White
Year householder moved into unit - Moved in 1990 to 1994 (%) - Black or African American
Year householder moved into unit - Moved in 1990 to 1994 (%) - Asian
Year householder moved into unit - Moved in 1990 to 1994 (%) - Hispanic or Latino
Year householder moved into unit - Moved in 1990 to 1994 (%) - American Indian and Alaska Native
Year householder moved into unit - Moved in 1990 to 1994 (%) - Multirace
Year householder moved into unit - Moved in 1990 to 1994 (%) - Other Race
Year householder moved into unit - Moved in 1980 to 1989 (%)
Year householder moved into unit - Moved in 1980 to 1989 (%) - White
Year householder moved into unit - Moved in 1980 to 1989 (%) - Black or African American
Year householder moved into unit - Moved in 1980 to 1989 (%) - Asian
Year householder moved into unit - Moved in 1980 to 1989 (%) - Hispanic or Latino
Year householder moved into unit - Moved in 1980 to 1989 (%) - American Indian and Alaska Native
Year householder moved into unit - Moved in 1980 to 1989 (%) - Multirace
Year householder moved into unit - Moved in 1980 to 1989 (%) - Other Race
Year householder moved into unit - Moved in 1970 to 1979 (%)
Year householder moved into unit - Moved in 1970 to 1979 (%) - White
Year householder moved into unit - Moved in 1970 to 1979 (%) - Black or African American
Year householder moved into unit - Moved in 1970 to 1979 (%) - Asian
Year householder moved into unit - Moved in 1970 to 1979 (%) - Hispanic or Latino
Year householder moved into unit - Moved in 1970 to 1979 (%) - American Indian and Alaska Native
Year householder moved into unit - Moved in 1970 to 1979 (%) - Multirace
Year householder moved into unit - Moved in 1970 to 1979 (%) - Other Race
Year householder moved into unit - Moved in 1969 or earlier (%)
Year householder moved into unit - Moved in 1969 or earlier (%) - White
Year householder moved into unit - Moved in 1969 or earlier (%) - Black or African American
Year householder moved into unit - Moved in 1969 or earlier (%) - Asian
Year householder moved into unit - Moved in 1969 or earlier (%) - Hispanic or Latino
Year householder moved into unit - Moved in 1969 or earlier (%) - American Indian and Alaska Native
Year householder moved into unit - Moved in 1969 or earlier (%) - Multirace
Year householder moved into unit - Moved in 1969 or earlier (%) - Other Race
Housing units lacking complete plumbing facilities (%)
Housing units lacking complete kitchen facilities (%)
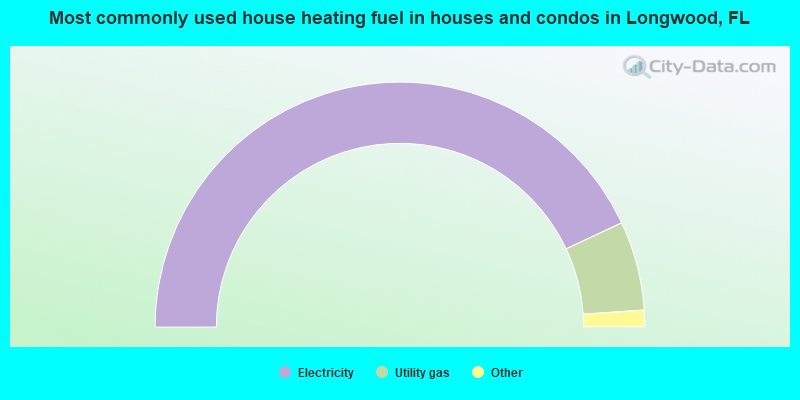
House heating fuel used in houses and condos - Utility gas (%)
House heating fuel used in houses and condos - Bottled, tank, or LP gas (%)
House heating fuel used in houses and condos - Electricity (%)
House heating fuel used in houses and condos - Fuel oil, kerosene, etc. (%)
House heating fuel used in houses and condos - Coal or coke (%)
House heating fuel used in houses and condos - Wood (%)
House heating fuel used in houses and condos - Solar energy (%)
House heating fuel used in houses and condos - Other fuel (%)
House heating fuel used in houses and condos - No fuel used (%)
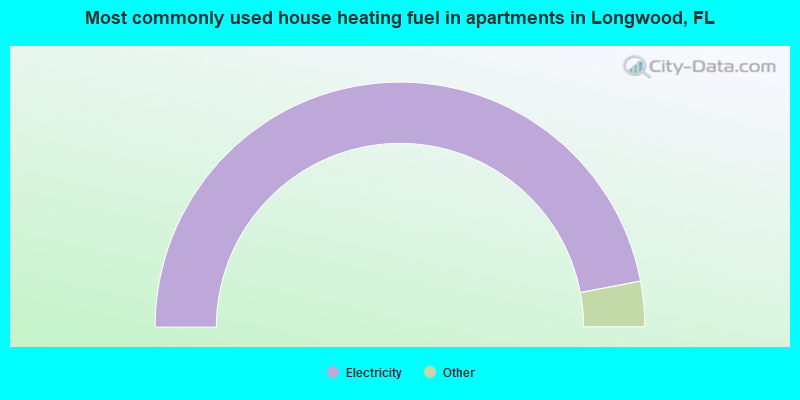
House heating fuel used in apartments - Utility gas (%)
House heating fuel used in apartments - Bottled, tank, or LP gas (%)
House heating fuel used in apartments - Electricity (%)
House heating fuel used in apartments - Fuel oil, kerosene, etc. (%)
House heating fuel used in apartments - Coal or coke (%)
House heating fuel used in apartments - Wood (%)
House heating fuel used in apartments - Solar energy (%)
House heating fuel used in apartments - Other fuel (%)
House heating fuel used in apartments - No fuel used (%)
Latest news about housing in Longwood, FL collected exclusively by city-data.com from local newspapers, TV, and radio stations
Median year house/condo built: 1978Median year apartment built: 1984Household type by relationship:
Households: 15,875
Male householders: 2,514 (579 living alone ), Female householders: 3,283 (935 living alone )3,019 spouses (2,995 opposite-sex spouses ), 520 unmarried partners , (500 opposite-sex unmarried partners ), 4,520 children (4,113 natural , 161 adopted , 245 stepchildren ), 477 grandchildren , 107 brothers or sisters , 280 parents , 0 foster children , 372 other relatives , 281 non-relatives In group quarters: 497
Size of family households: 1,462 2-persons , 829 3-persons , 946 4-persons , 260 5-persons , 292 6-persons , 76 7-or-more-persons .
Size of nonfamily households: 1,495 1-person , 521 2-persons , 11 3-persons .
1,928 married couples with children. single-parent households (33 men , 628 women ).
80.7% of residents of Longwood speak English at home. of residents speak Spanish at home (68% speak English very well , 11% speak English well , 20% speak English not well , 1% don't speak English at all ).of residents speak other Indo-European language at home (50% speak English very well , 37% speak English well , 13% speak English not well ).of residents speak Asian or Pacific Island language at home (34% speak English very well , 55% speak English well , 11% speak English not well ).of residents speak other language at home (69% speak English very well , 27% speak English well , 4% speak English not well ).
Foreign born population: 2,388 (15.0%)of them are naturalized citizens )
Median number of rooms in houses and condos:
Median number of rooms in apartments
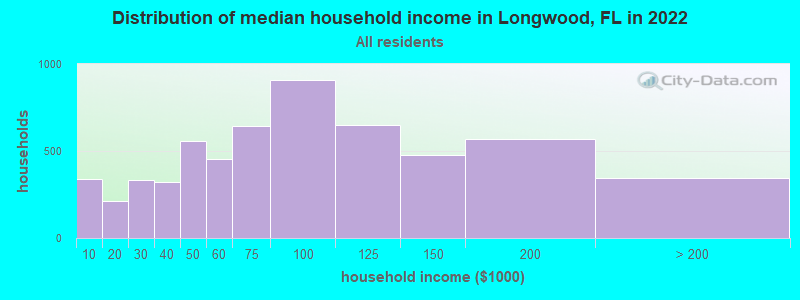
Longwood, FL household income distribution 339 Less than $10,000212 $10,000 to $19,999336 $20,000 to $29,999321 $30,000 to $39,999557 $40,000 to $49,999452 $50,000 to $59,999641 $60,000 to $74,999910 $75,000 to $99,999649 $100,000 to $124,999479 $125,000 to $149,999571 $150,000 to $199,999343 $200,000 or more
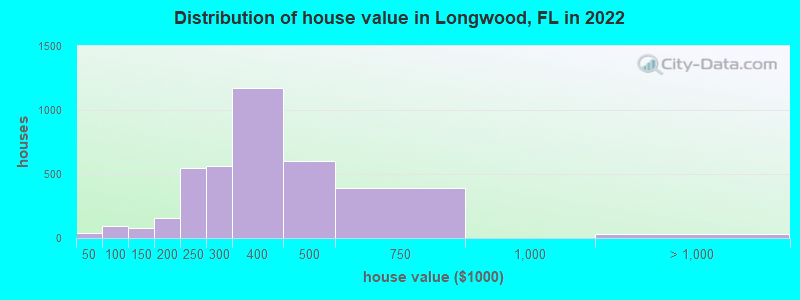
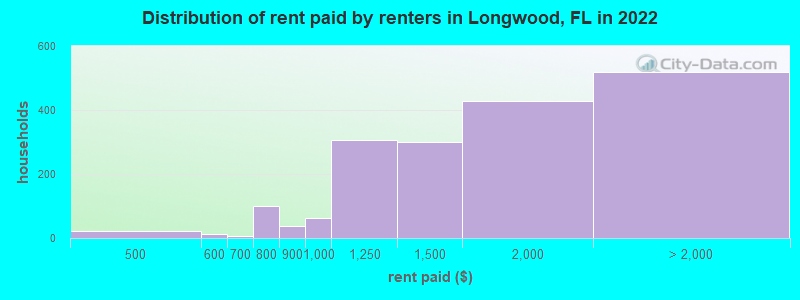
Home value of owner - occupied houses in 2022 in Longwood, FL 14 $20,000 to $24,99926 $35,000 to $39,99955 $50,000 to $59,99917 $60,000 to $69,9999 $80,000 to $89,99910 $90,000 to $99,99966 $100,000 to $124,99911 $125,000 to $149,99956 $150,000 to $174,99999 $175,000 to $199,999549 $200,000 to $249,999559 $250,000 to $299,9991,172 $300,000 to $399,999604 $400,000 to $499,999389 $500,000 to $749,9996 $1,000,000 to $1,499,99926 $2,000,000 or moreRent paid by renters in 2022 in Longwood, FL 22 $450 to $49912 $550 to $5995 $600 to $64912 $700 to $74989 $750 to $79938 $800 to $89962 $900 to $999305 $1,000 to $1,249300 $1,250 to $1,499428 $1,500 to $1,999184 $2,000 to $2,499141 $2,500 to $2,999105 $3,500 or more88 No cash rent
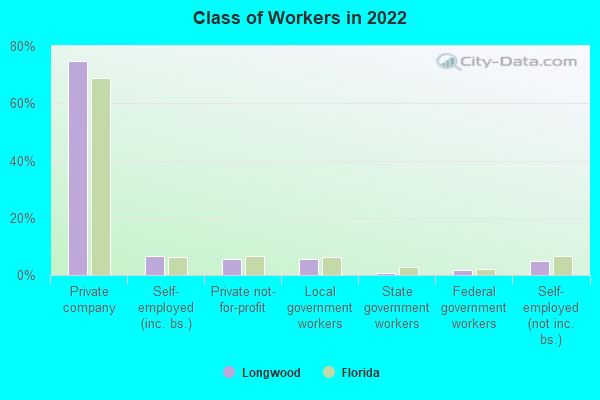
Percentage of workers working in this county: 72.2%Number of people working at home: 1,547 (18.8% of all workers )
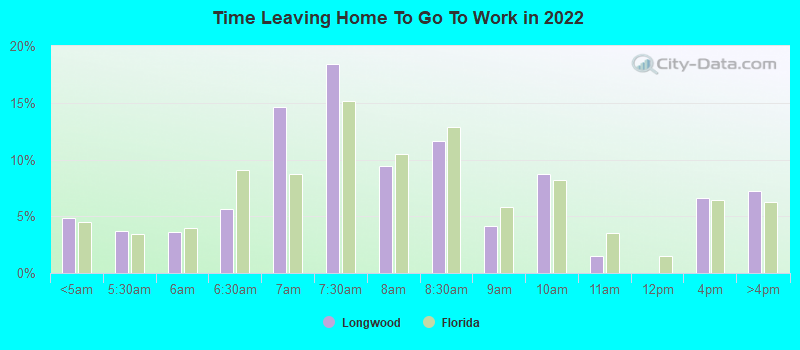
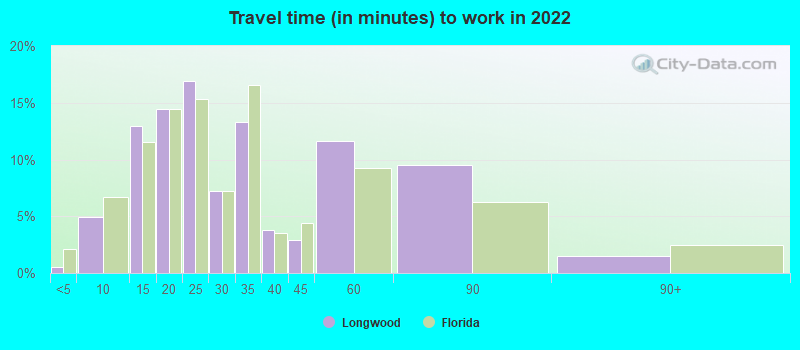
Travel time to work (commute)
Less than 5 minutes: 1045 to 9 minutes: 34310 to 14 minutes: 84115 to 19 minutes: 92820 to 24 minutes: 1,25425 to 29 minutes: 61730 to 34 minutes: 1,06435 to 39 minutes: 40440 to 44 minutes: 13645 to 59 minutes: 46660 to 89 minutes: 32190 or more minutes: 112
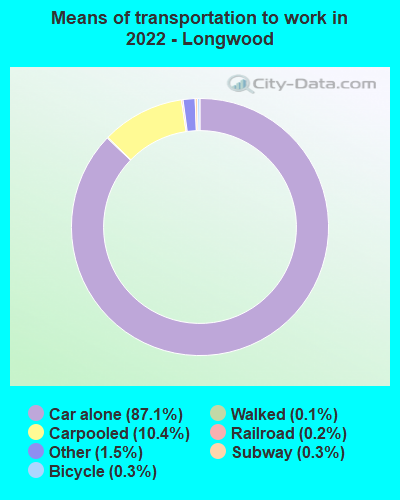
Means of transportation to work:
Drove a car alone: 11,575 (72.7%)Carpooled: 1,748 (11.0%)Bus : 8 (0.1%)Long-distance train or commuter rail : 40 (0.3%)Light rail, streetcar or trolley : 28 (0.2%)Taxi: 227 (1.4%)Bicycle: 41 (0.3%)Walked: 14 (0.1%)Worked at home: 1,547 (9.7%)
Unemployment by race in 2022
Unemployment rate for White non-Hispanic residents 6.0% Males5.0% FemalesUnemployment rate for Black residents 11.0% Males3.2% FemalesUnemployment rate for two or more race residents 0.8% MalesUnemployment rate for Hispanic or Latino residents 0.3% Males1.1% Females
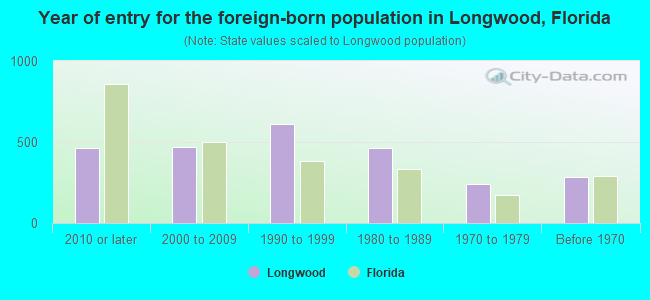
Year of entry for the foreign-born population in Longwood, Florida
464 2010 or later 470 2000 to 2009 610 1990 to 1999 465 1980 to 1989 241 1970 to 1979 287 Before 1970
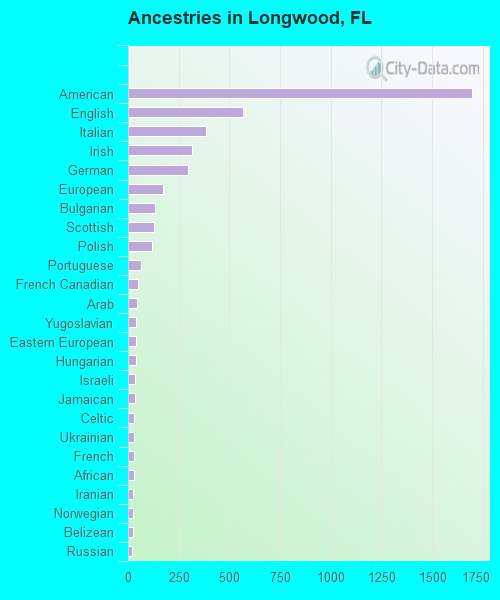
First ancestries reported:
American: 1,696 (22.4%)
English: 565 (7.5%)
Italian: 384 (5.1%)
Irish: 316 (4.2%)
German: 298 (3.9%)
European: 175 (2.3%)
Bulgarian: 133 (1.8%)
Scottish: 129 (1.7%)
Polish: 120 (1.6%)
Portuguese: 66 (0.9%)
French Canadian: 51 (0.7%)
Arab: 42 (0.6%)
Yugoslavian: 40 (0.5%)
Eastern European: 38 (0.5%)
Hungarian: 38 (0.5%)
Israeli: 34 (0.4%)
Jamaican: 33 (0.4%)
Celtic: 32 (0.4%)
Ukrainian: 29 (0.4%)
French: 28 (0.4%)
African: 28 (0.4%)
Iranian: 26 (0.3%)
Norwegian: 23 (0.3%)
Belizean: 23 (0.3%)
Russian: 22 (0.3%)
British: 22 (0.3%)
West Indian: 20 (0.3%)
Dutch: 19 (0.3%)
Romanian: 16 (0.2%)
Canadian: 15 (0.2%)
Czech: 14 (0.2%)
Scotch-Irish: 10 (0.1%)
Lebanese: 8 (0.1%)
Jordanian: 7 (0.09%)
Greek: 6 (0.08%)
Slovak: 6 (0.08%)
Swedish: 6 (0.08%)
Swiss: 6 (0.08%)
Pennsylvania German: 4 (0.05%)
Serbian: 4 (0.05%)
Haitian: 4 (0.05%)
Lithuanian: 3 (0.04%)
Welsh: 3 (0.04%)
Trinidadian and Tobagonian: 3 (0.04%) Most common places of birth for foreign-born residents (%): Colombia Longwood:
15.1% (348)Florida:
6.5% (298,669)
Cuba Longwood:
10.6% (245)Florida:
22.0% (1,006,576)
Peru Longwood:
7.1% (164)Florida:
2.1% (96,693)
Guyana Longwood:
6.7% (154)Florida:
0.7% (33,556)
Mexico Longwood:
6.4% (148)Florida:
5.6% (257,152)
Albania Longwood:
3.6% (84)Florida:
0.2% (9,779)
China, excluding Hong Kong and Taiwan Longwood:
3.2% (75)Florida:
1.2% (56,071)
Korea Longwood:
3.2% (74)Florida:
0.4% (19,445)
Brazil Longwood:
3.1% (71)Florida:
2.7% (122,906)
Canada Longwood:
2.9% (68)Florida:
2.4% (109,132)
United Kingdom, excluding England and Scotland Longwood:
2.2% (51)Florida:
0.7% (34,227)
Ukraine Longwood:
2.1% (49)Florida:
0.5% (21,886)
Israel Longwood:
2.1% (48)Florida:
0.3% (14,535)
Bulgaria Longwood:
2.0% (46)Florida:
0.2% (6,883)
Vietnam Longwood:
2.0% (46)Florida:
1.3% (60,604)
Jordan Longwood:
1.9% (45)Florida:
0.1% (5,245)
Ecuador Longwood:
1.9% (45)Florida:
1.2% (54,585)
El Salvador Longwood:
1.6% (38)Florida:
1.1% (49,838)
Argentina Longwood:
1.6% (37)Florida:
1.3% (57,263)
Bosnia and Herzegovina Longwood:
1.6% (36)Florida:
0.2% (8,695)
Guatemala Longwood:
1.6% (36)Florida:
2.1% (97,632)
Place of birth for U.S.-born residents:
This state: 5,983Other state: 7,003Northeast: 3,159Midwest: 1,639South: 1,725West: 403 89.3% of Longwood residents lived in the same house 1 years ago.
Out of people who lived in different houses, 25.8% lived in this county.
Out of people who lived in different counties, 62.8% lived in Florida.
Longwood:
89.3%State average:
86.3%
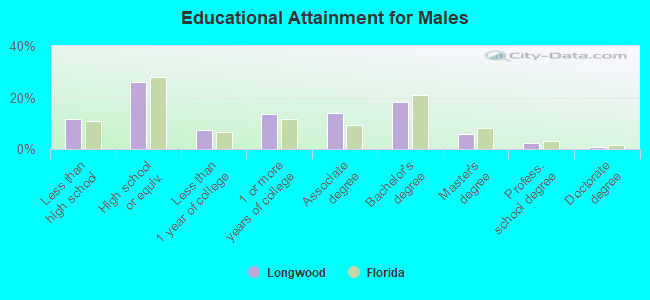
Education attainment for males 25 years and older:
No schooling: 233Nursery to 4th grade: 535th and 6th grade: 07th and 8th grade: 549th grade: 8910th grade: 4811th grade: 9412th grade, no diploma: 98High school graduate (or equivalency): 1,469Less than 1 year of college: 407Some college more than 1 year, no degree: 761Associate degree: 796Bachelor's degree: 1,039Master's degree: 330Professional school degree: 129Doctorate degree: 54
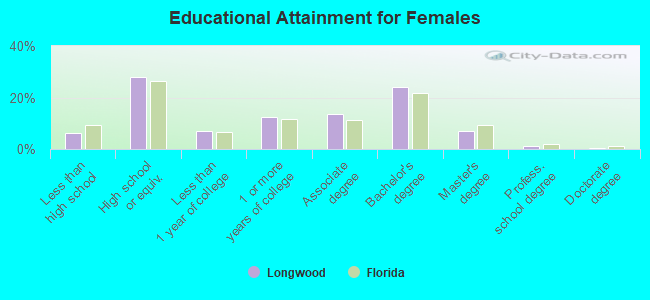
Education attainment for females 25 years and older:
No schooling: 67Nursery to 4th grade: 205th and 6th grade: 447th and 8th grade: 09th grade: 1410th grade: 4511th grade: 10412th grade, no diploma: 94High school graduate (or equivalency): 1,744Less than 1 year of college: 443Some college more than 1 year, no degree: 771Associate degree: 856Bachelor's degree: 1,496Master's degree: 434Professional school degree: 66Doctorate degree: 25
Housing units in structures:
One, detached: 4,666One, attached: 765Two: 1763 or 4: 435 to 9: 1320 to 49: 2450 or more: 545Mobile homes: 12Housing units lacking complete plumbing facilities in 2022: 0.5%Housing units lacking complete kitchen facilities in 2022: 1.7%House/condo owner moved in on average 12 years ago
Renter moved in on average 4 years ago
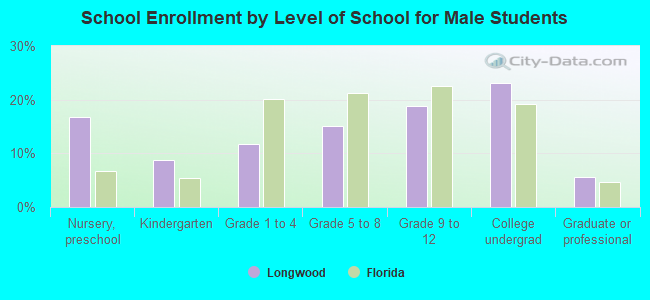
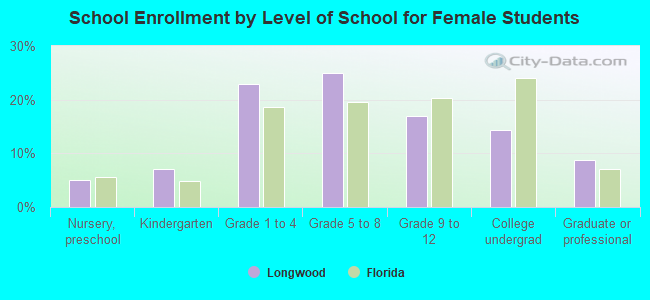
Private vs. public school enrollment:
Students in private schools in grades 1 to 8 (elementary and middle school): 120 Students in private schools in grades 9 to 12 (high school): 74 Students in private undergraduate colleges: 60