Lorena, TX (Texas) Houses and Residents
| Lorena: | $286,878 |
| Texas: | $275,400 |
Mean price in 2022:
Detached houses: $261,375
Here: $261,375 State: $369,058
Total population: 1,733 (Urban population: 0, Rural population: 1,448 (all nonfarm))
Houses: 649 (607 occupied: 457 owner occupied, 135 renter occupied)
| % of renters here: | 23% |
| State: | 38% |
Housing density: 201 houses/condos per square mile
Median price asked for vacant for-sale houses and condos in 2022 in this county: $214,746.
Median contract rent in 2022: $1,151 (lower quartile is $717, upper quartile is $1,521)
Median rent asked for vacant for-rent units in 2022: $1,121
Median gross rent in Lorena, TX in 2022: $1,509
Housing units in Lorena with a mortgage: 274 (32 second mortgage, 0 home equity loan, 16 both second mortgage and home equity loan)
Houses without a mortgage: 0
Median household income for houses/condos with a mortgage: $122,073
Median household income for apartments without a mortgage: $73,105
Median monthly housing costs: $1,426
Compare current foreclosures near Lorena, TX:
| Photo | Address | Area | Beds / Baths | Price | Details |
|---|---|---|---|---|---|

|
#1
Woodland Dr
Lorena, TX 76655
|
- sq. feet
|
3 baths 4 beds |
show details | |

|
#2
Brosnan Rd
Lorena, TX 76655
|
- sq. feet
|
- baths - beds |
show details | |

|
#3
Solar St
Lorena, TX 76655
|
- sq. feet
|
- baths - beds |
show details | |

|
#4
Jackal Dr
Lorena, TX 76655
|
- sq. feet
|
- baths - beds |
show details | |

|
#5
Degrate St
Lorena, TX 76655
|
1,444 sq. feet
|
- baths - beds |
show details | |

|
#6
Cranbrook Dr
Wac-Woodway, TX 76712
|
1,888 sq. feet
|
2 baths 3 beds |
$319,900
|
show details |

|
#7
Lux Dr
Waco, TX 76706
|
1,745 sq. feet
|
2 baths 4 beds |
$182,000
|
show details |

|
#8
Royals Ranch Rd
Lorena, TX 76655
|
- sq. feet
|
- baths - beds |
show details | |

|
#9
South Fork Ranch Road
Waco, TX 76705
|
1,626 sq. feet
|
2 baths 3 beds |
show details | |

|
#10
Alexander Ave
Waco, TX 76708
|
1,428 sq. feet
|
2 baths 2 beds |
show details |
| Photo | Address | Area | Beds / Baths | Price | Details |
|---|---|---|---|---|---|

|
#11
Mosley Dr
Waco, TX 76705
|
1,792 sq. feet
|
2 baths 3 beds |
show details | |

|
#12
Hawthorne Dr
Waco, TX 76710
|
- sq. feet
|
2 baths 3 beds |
show details | |

|
#13
N 43rd St
Waco, TX 76710
|
1,958 sq. feet
|
2 baths 4 beds |
show details | |

|
#14
N 40th St
Waco, TX 76707
|
- sq. feet
|
1 baths 2 beds |
show details | |

|
#15
Torrance St
Waco, TX 76705
|
1,380 sq. feet
|
2 baths 3 beds |
show details | |

|
#16
Neely Rd
Hewitt, TX 76643
|
1,627 sq. feet
|
2 baths 3 beds |
show details | |

|
#17
W 10th St
Mc Gregor, TX 76657
|
1,030 sq. feet
|
1 baths 2 beds |
show details | |

|
#18
Tejas Dr
Wac-Woodway, TX 76712
|
- sq. feet
|
2 baths 3 beds |
show details | |

|
#19
N 30th St
Waco, TX 76707
|
1,506 sq. feet
|
1 baths 3 beds |
show details | |

|
#20
Serena Ln
Wac-Woodway, TX 76712
|
1,947 sq. feet
|
2 baths 4 beds |
show details |
| Photo | Address | Area | Beds / Baths | Price | Details |
|---|---|---|---|---|---|

|
#21
Eagles Nest Dr
Hewitt, TX 76643
|
1,593 sq. feet
|
2 baths 3 beds |
show details | |

|
#22
Lake Haven Dr
Waco, TX 76710
|
1,836 sq. feet
|
2 baths 3 beds |
show details | |

|
#23
Dossett St
Waco, TX 76705
|
1,668 sq. feet
|
1 baths 3 beds |
show details | |

|
#24
Glasgow Dr
Waco, TX 76710
|
2,271 sq. feet
|
2 baths 4 beds |
show details | |

|
#25
Brewster St
Waco, TX 76706
|
1,585 sq. feet
|
2 baths 3 beds |
show details | |

|
#26
White Hall Rd
Wac-Woodway, TX 76712
|
2,120 sq. feet
|
2 baths 4 beds |
show details | |

|
#27
Haden Dr
Waco, TX 76710
|
1,642 sq. feet
|
1 baths 3 beds |
show details | |

|
#28
Cleveland Ave
Waco, TX 76711
|
868 sq. feet
|
1 baths 2 beds |
show details | |

|
#29
Elmore Dr
Wac-Woodway, TX 76712
|
1,472 sq. feet
|
2 baths 3 beds |
show details | |

|
#30
Guyton Rd
Moody, TX 76557
|
1,744 sq. feet
|
1 baths 2 beds |
show details |
| Photo | Address | Area | Beds / Baths | Price | Details |
|---|---|---|---|---|---|

|
#31
N 22nd St
Waco, TX 76708
|
1,160 sq. feet
|
1 baths 3 beds |
show details | |

|
#32
Durango Trl
Wac-Woodway, TX 76712
|
1,759 sq. feet
|
2 baths 3 beds |
show details | |

|
#33
Cedarwood Ln
Hewitt, TX 76643
|
1,931 sq. feet
|
2 baths 3 beds |
show details | |

|
#34
N 62nd St
Waco, TX 76710
|
1,754 sq. feet
|
2 baths - beds |
show details | |

|
#35
Paradise Island Rd
Waco, TX 76705
|
1,161 sq. feet
|
2 baths - beds |
show details | |

|
#36
Sydney Dr
Waco, TX 76708
|
1,224 sq. feet
|
2 baths - beds |
show details | |

|
#37
Armstrong Dr
Waco, TX 76704
|
1,362 sq. feet
|
1 baths - beds |
show details | |

|
#38
Mahalia Dr
Waco, TX 76705
|
2,647 sq. feet
|
2 baths - beds |
show details | |

|
#39
Memorial Dr
Waco, TX 76711
|
922 sq. feet
|
1 baths - beds |
show details | |

|
#40
Carver St
Waco, TX 76704
|
1,080 sq. feet
|
1 baths - beds |
show details |
| Photo | Address | Area | Beds / Baths | Price | Details |
|---|---|---|---|---|---|

|
#41
Old Marlin Rd
Waco, TX 76705
|
1,292 sq. feet
|
1 baths - beds |
show details | |

|
#42
Hubby Ave
Waco, TX 76710
|
1,648 sq. feet
|
2 baths - beds |
show details | |

|
#43
N 26th St
Waco, TX 76708
|
1,864 sq. feet
|
1 baths - beds |
show details | |

|
#44
N 26th St
Waco, TX 76708
|
1,686 sq. feet
|
1 baths - beds |
show details | |

|
#45
Macarthur Dr
Waco, TX 76708
|
3,964 sq. feet
|
2 baths - beds |
show details | |

|
#46
N 10th St
Waco, TX 76707
|
1,092 sq. feet
|
1 baths - beds |
show details | |

|
#47
Cumberland Ave
Waco, TX 76707
|
1,264 sq. feet
|
1 baths - beds |
show details | |

|
#48
Sleeper Ave
Waco, TX 76707
|
1,438 sq. feet
|
1 baths - beds |
show details | |

|
#49
Cole Ave
Waco, TX 76707
|
1,074 sq. feet
|
1 baths - beds |
show details | |

|
Check over 1 million property listings on Foreclosure.com!
|
browse all offers | |||

Latest news about housing in Lorena, TX collected exclusively by city-data.com from local newspapers, TV, and radio stations

 | PCSing to Fort Hood (school and housing recommendations) (7 replies) |
| Can someone direct me to property manager that handles rental HOMES in Robinson? (2 replies) |
| Is Texas Right for Us? (48 replies) |
| Best Town in Texas for Family (26 replies) |
| Trip Planned in March - Kid Friendly Ideas? (7 replies) |
| Best Smallish Texas Town to Move Business and Family (14 replies) |

Median year apartment built: 1987
Household type by relationship:
Households: 1,686- Male householders: 287 (39 living alone), Female householders: 320 (66 living alone)
397 spouses (395 opposite-sex spouses), 7 unmarried partners, (7 opposite-sex unmarried partners), 607 children (542 natural, 7 adopted, 57 stepchildren), 26 grandchildren, 4 brothers or sisters, 16 parents, 3 foster children, 9 other relatives, 7 non-relatives
Size of family households: 224 2-persons, 110 3-persons, 87 4-persons, 67 5-persons, 12 6-persons.
Size of nonfamily households: 97 1-person, 5 2-persons.
355 married couples with children.
62 single-parent households (0 men, 62 women).
90.0% of residents of Lorena speak English at home.
6.8% of residents speak Spanish at home (64% speak English very well, 36% speak English well).
0.7% of residents speak other Indo-European language at home (100% speak English very well).
2.7% of residents speak Asian or Pacific Island language at home (100% speak English very well).
Foreign born population: 34 (2.0%)
(58.8% of them are naturalized citizens)
| Here: | 6.1 |
| State: | 6.3 |
| Here: | 4.7 |
| State: | 4.0 |

- Bedrooms in owner-occupied houses and condos in Lorena, Texas
- 3no bedroom
- 41 bedroom
- 412 bedrooms
- 2703 bedrooms
- 1324 bedrooms
- 85+ bedrooms

- Bedrooms in renter-occupied apartments in Lorena, Texas
- 3no bedroom
- 241 bedroom
- 532 bedrooms
- 503 bedrooms
- 64 bedrooms
- 05+ bedrooms

- Cars and other vehicles available in Lorena in owner-occupied houses/condos
- 3no vehicle
- 1081 vehicle
- 2112 vehicles
- 653 vehicles
- 594 vehicles
- 125+ vehicles

- Cars and other vehicles available in Lorena in renter-occupied apartments
- 10no vehicle
- 501 vehicle
- 582 vehicles
- 153 vehicles
- 04 vehicles
- 35+ vehicles

- Rooms in owner-occupied houses in Lorena, Texas
- 31 room
- 02 rooms
- 63 rooms
- 294 rooms
- 955 rooms
- 1466 rooms
- 937 rooms
- 398 rooms
- 489+ rooms

- Rooms in renter-occupied apartments in Lorena, Texas
- 31 room
- 02 rooms
- 373 rooms
- 204 rooms
- 285 rooms
- 306 rooms
- 37 rooms
- 68 rooms
- 99+ rooms


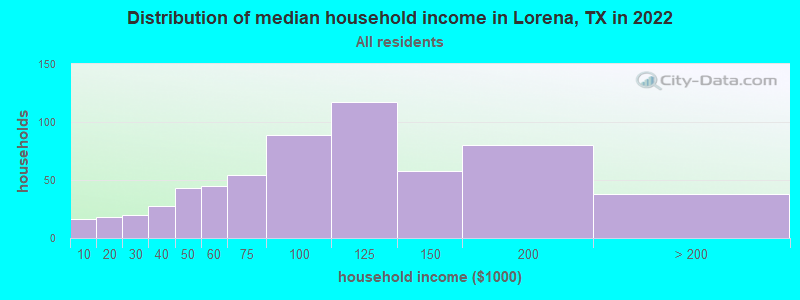
Lorena, TX household income distribution

- 16Less than $10,000
- 18$10,000 to $19,999
- 20$20,000 to $29,999
- 28$30,000 to $39,999
- 43$40,000 to $49,999
- 45$50,000 to $59,999
- 54$60,000 to $74,999
- 89$75,000 to $99,999
- 117$100,000 to $124,999
- 58$125,000 to $149,999
- 80$150,000 to $199,999
- 38$200,000 or more
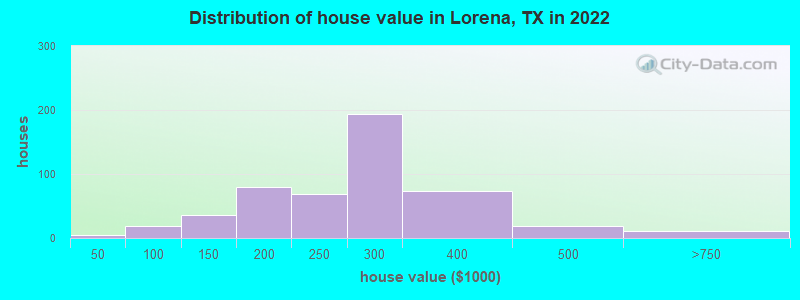
Home value of owner - occupied houses in 2022 in Lorena, TX
-
- 4$20,000 to $24,999
- 12$80,000 to $89,999
- 5$90,000 to $99,999
- 20$100,000 to $124,999
- 15$125,000 to $149,999
- 42$150,000 to $174,999
- 37$175,000 to $199,999
- 69$200,000 to $249,999
- 192$250,000 to $299,999
- 73$300,000 to $399,999
- 19$400,000 to $499,999
- 11$500,000 to $749,999
Rent paid by renters in 2022 in Lorena, TX
-
- 3$150 to $199
- 9$200 to $249
- 15$400 to $449
- 3$500 to $549
- 15$650 to $699
- 7$800 to $899
- 2$900 to $999
- 38$1,000 to $1,249
- 14$1,250 to $1,499
- 21$1,500 to $1,999
- 12$2,000 to $2,499
- 4No cash rent

Percentage of workers working in this county: 89.7%
Number of people working at home: 69 (8.3% of all workers)
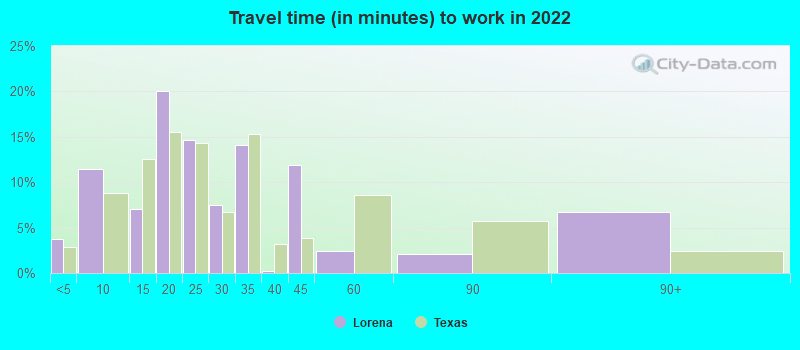
Travel time to work (commute)
- Less than 5 minutes: 43
- 5 to 9 minutes: 58
- 10 to 14 minutes: 117
- 15 to 19 minutes: 240
- 20 to 24 minutes: 139
- 25 to 29 minutes: 51
- 30 to 34 minutes: 61
- 35 to 39 minutes: 14
- 40 to 44 minutes: 0
- 45 to 59 minutes: 0
- 60 to 89 minutes: 12
- 90 or more minutes: 20
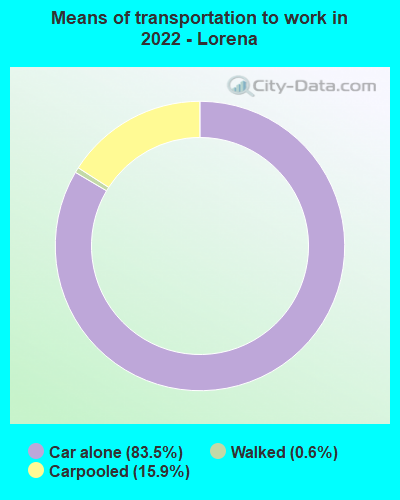
Means of transportation to work:
- Drove a car alone: 850 (77.6%)
- Carpooled: 143 (13.0%)
- Walked: 7 (0.6%)
- Worked at home: 69 (6.3%)
- Unemployment by race in 2022
- Unemployment rate for White non-Hispanic residents
- 1.0%Males
- 2.6%Females
- Unemployment rate for other race residents
- 13.7%Females
- Unemployment rate for Hispanic or Latino residents
- 3.2%Females

- Year of entry for the foreign-born population in Lorena, Texas
- 02010 or later
- 142000 to 2009
- 01990 to 1999
- 81980 to 1989
- 11970 to 1979
- 25Before 1970

First ancestries reported:
- German: 160 (19.7%)
- English: 120 (14.7%)
- American: 46 (5.7%)
- Irish: 29 (3.6%)
- Italian: 27 (3.3%)
- Czech: 24 (2.9%)
- Scotch-Irish: 20 (2.5%)
- French: 13 (1.6%)
- European: 12 (1.5%)
- Polish: 4 (0.5%)
- Welsh: 4 (0.5%)
- Alsatian: 3 (0.4%)
- Scandinavian: 2 (0.2%)
Most common places of birth for foreign-born residents (%):
| Lorena: | 36.1% (13) |
| Texas: | 48.4% (2,411,723) |
| Lorena: | 30.6% (11) |
| Texas: | 0.4% (17,796) |
| Lorena: | 8.3% (3) |
| Texas: | 2.1% (103,148) |
| Lorena: | 8.3% (3) |
| Texas: | 0.8% (37,989) |
| Lorena: | 5.6% (2) |
| Texas: | 3.7% (184,770) |
Place of birth for U.S.-born residents:
- This state: 1,343
- Other state: 262
- Northeast: 23
- Midwest: 86
- South: 81
- West: 66
90.5% of Lorena residents lived in the same house 1 years ago.
Out of people who lived in different houses, 44.2% lived in this county.
Out of people who lived in different counties, 59.4% lived in Texas.
| Lorena: | 90.5% |
| State average: | 85.7% |
Education attainment for males 25 years and older:
- No schooling: 0
- Nursery to 4th grade: 0
- 5th and 6th grade: 0
- 7th and 8th grade: 0
- 9th grade: 0
- 10th grade: 2
- 11th grade: 1
- 12th grade, no diploma: 0
- High school graduate (or equivalency): 98
- Less than 1 year of college: 55
- Some college more than 1 year, no degree: 110
- Associate degree: 58
- Bachelor's degree: 108
- Master's degree: 39
- Professional school degree: 0
- Doctorate degree: 48

Education attainment for females 25 years and older:
- No schooling: 0
- Nursery to 4th grade: 0
- 5th and 6th grade: 0
- 7th and 8th grade: 0
- 9th grade: 9
- 10th grade: 3
- 11th grade: 0
- 12th grade, no diploma: 0
- High school graduate (or equivalency): 85
- Less than 1 year of college: 130
- Some college more than 1 year, no degree: 119
- Associate degree: 76
- Bachelor's degree: 140
- Master's degree: 42
- Professional school degree: 3
- Doctorate degree: 3


Housing units in structures:
- One, detached: 532
- One, attached: 17
- Two: 46
- 3 or 4: 13
- 5 to 9: 14
- 10 to 19: 12
- 20 to 49: 6
- Mobile homes: 3
- Boats, RVs, vans, etc.: 3
House/condo owner moved in on average 10 years ago
Renter moved in on average 3 years ago

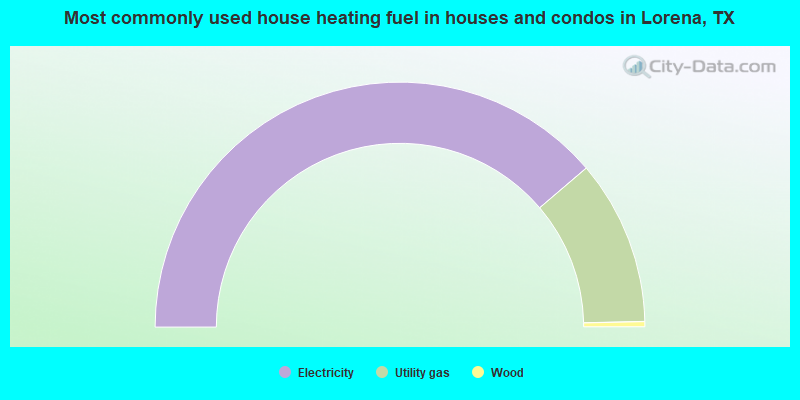
- 77.6%Electricity
- 21.8%Utility gas
- 0.7%Wood
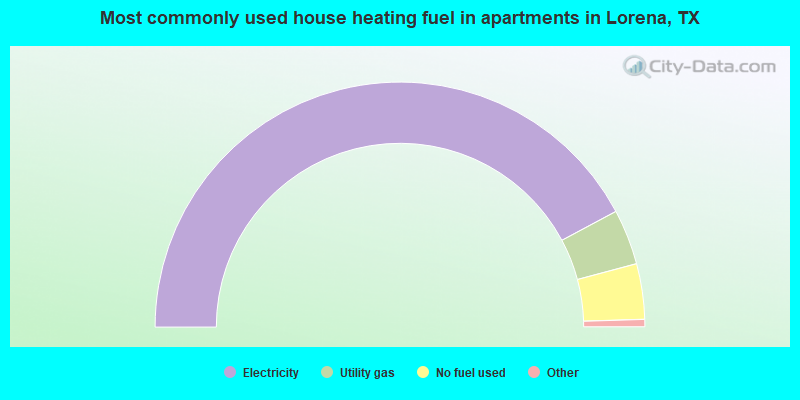
- 85.3%Electricity
- 7.4%Utility gas
- 7.4%No fuel used
Private vs. public school enrollment:
| Here: | 6.4% |
| Texas: | 8.8% |
| Here: | 3.4% |
| Texas: | 8.0% |
| Here: | 11.9% |
| Texas: | 16.2% |


