Loretto, PA (Pennsylvania) Houses and Residents
| Loretto: | $131,111 |
| Pennsylvania: | $245,500 |
Total population: 1,308 (Urban population: 1,079 (all inside urban clusters), Rural population: 78 (all nonfarm))
Houses: 162 (91 occupied: 66 owner occupied, 24 renter occupied)
| % of renters here: | 27% |
| State: | 31% |
Housing density: 159 houses/condos per square mile
Median price asked for vacant for-sale houses and condos in 2022 in this county: $90,499.
Median contract rent in 2022: $1,299
Median rent asked for vacant for-rent units in 2022: $1,217
Median gross rent in Loretto, PA in 2022: $1,280
Housing units in Loretto with a mortgage: 23 (3 second mortgage, 0 home equity loan, 3 both second mortgage and home equity loan)
Houses without a mortgage: 10
Median household income for houses/condos with a mortgage: $114,936
Median monthly housing costs: $711
Compare current foreclosures near Loretto, PA:
| Photo | Address | Area | Beds / Baths | Price | Details |
|---|---|---|---|---|---|

|
#1
Avalon Rd
Altoona, PA 16601
|
1,962 sq. feet
|
2 baths 3 beds |
$42,500
|
show details |

|
#2
Old Mill Run Rd
Altoona, PA 16601
|
1,408 sq. feet
|
1 baths 2 beds |
$151,900
|
show details |

|
#3
Vicars Ln
Altoona, PA 16601
|
3,019 sq. feet
|
2 baths 4 beds |
$549,900
|
show details |

|
#4
Thomas Rd
Loretto, PA 15940
|
- sq. feet
|
- baths - beds |
show details | |

|
#5
Criste Rd
Loretto, PA 15940
|
- sq. feet
|
- baths - beds |
show details | |

|
#6
Spring Hill Ln
Loretto, PA 15940
|
- sq. feet
|
- baths - beds |
show details | |

|
#7
Brick Rd
Loretto, PA 15940
|
- sq. feet
|
- baths - beds |
show details | |

|
#8
W Milton St
Ebensburg, PA 15931
|
4,394 sq. feet
|
- baths 5 beds |
$169,000
|
show details |

|
#9
Franklin St
Hollidaysburg, PA 16648
|
- sq. feet
|
1 baths 3 beds |
$63,900
|
show details |

|
#10
11th St
Altoona, PA 16601
|
1,995 sq. feet
|
2 baths 3 beds |
show details |
| Photo | Address | Area | Beds / Baths | Price | Details |
|---|---|---|---|---|---|

|
#11
N 2nd St
Altoona, PA 16601
|
- sq. feet
|
2 baths 4 beds |
show details | |

|
#12
Marson Ln
Duncansville, PA 16635
|
2,050 sq. feet
|
2 baths 2 beds |
show details | |

|
#13
White Ln
Saint Benedict, PA 15773
|
954 sq. feet
|
1 baths 2 beds |
show details | |

|
#14
Bell Ave
Altoona, PA 16602
|
1,816 sq. feet
|
1 baths 3 beds |
show details | |

|
#15
James Ave
Patton, PA 16668
|
1,440 sq. feet
|
2 baths 3 beds |
show details | |

|
#16
5th St
Colver, PA 15927
|
903 sq. feet
|
1 baths 2 beds |
show details | |

|
#17
Foster St
Gallitzin, PA 16641
|
2 sq. feet
|
2 baths 4 beds |
show details | |

|
#18
Pershing St
Gallitzin, PA 16641
|
1,306 sq. feet
|
1 baths 3 beds |
show details | |

|
#19
Bell Tip Rd
Tyrone, PA 16686
|
1,344 sq. feet
|
1 baths 3 beds |
show details | |

|
#20
11 16th Avenue
Altoona, PA 16601
|
- sq. feet
|
- baths - beds |
$39,900
|
show details |
| Photo | Address | Area | Beds / Baths | Price | Details |
|---|---|---|---|---|---|

|
#21
Baynton Ave
Altoona, PA 16602
|
- sq. feet
|
2 baths 3 beds |
show details | |

|
#22
Plummer Rd
Sidman, PA 15955
|
- sq. feet
|
2 baths 2 beds |
show details | |

|
#23
Caroline St
Nanty Glo, PA 15943
|
- sq. feet
|
- baths - beds |
$34,900
|
show details |

|
#24
Walnut Ave
Altoona, PA 16601
|
- sq. feet
|
1 baths 3 beds |
show details | |

|
#25
Barr Ave
Northern Cambria, PA 15714
|
- sq. feet
|
2 baths 3 beds |
show details | |

|
#26
Blue Bird Ln
Portage, PA 15946
|
- sq. feet
|
- baths - beds |
$19,900
|
show details |

|
#27
2nd Ave
Altoona, PA 16602
|
1,330 sq. feet
|
1 baths 4 beds |
show details | |

|
#28
3rd Ave
Altoona, PA 16602
|
- sq. feet
|
- baths - beds |
$14,900
|
show details |

|
#29
Ivy St
Parkhill, PA 15945
|
- sq. feet
|
- baths - beds |
$39,900
|
show details |

|
#30
Fiske Rd
Fallentimber, PA 16639
|
- sq. feet
|
1 baths 3 beds |
show details |
| Photo | Address | Area | Beds / Baths | Price | Details |
|---|---|---|---|---|---|

|
#31
E Crawford St
Ebensburg, PA 15931
|
- sq. feet
|
1 baths 4 beds |
show details | |

|
#32
Turkey Ridge Rd
Flinton, PA 16640
|
- sq. feet
|
2 baths 3 beds |
show details | |

|
#33
Broad Ave
Altoona, PA 16601
|
- sq. feet
|
2 baths 5 beds |
show details | |

|
#34
18th Ave
Altoona, PA 16601
|
- sq. feet
|
1 baths 3 beds |
show details | |

|
#35
4th Ave
Duncansville, PA 16635
|
2,264 sq. feet
|
1 baths 3 beds |
show details | |

|
#36
N 12th Ave
Altoona, PA 16601
|
- sq. feet
|
1 baths 4 beds |
show details | |

|
#37
N 6th Ave
Altoona, PA 16601
|
- sq. feet
|
1 baths 2 beds |
show details | |

|
#38
Pine St
Cassandra, PA 15925
|
- sq. feet
|
1 baths 4 beds |
show details | |

|
#39
11th Ave
Altoona, PA 16601
|
- sq. feet
|
1 baths 3 beds |
show details | |

|
#40
22nd Ave
Altoona, PA 16601
|
- sq. feet
|
2 baths 4 beds |
show details |
| Photo | Address | Area | Beds / Baths | Price | Details |
|---|---|---|---|---|---|

|
#41
Stewart St
Altoona, PA 16602
|
- sq. feet
|
- baths - beds |
show details | |

|
#42
39th St
Northern Cambria, PA 15714
|
- sq. feet
|
- baths - beds |
show details | |

|
#43
Broadway
Altoona, PA 16601
|
- sq. feet
|
- baths - beds |
show details | |

|
#44
Oak St
Johnstown, PA 15909
|
- sq. feet
|
- baths - beds |
show details | |

|
#45
Walton Ave
Altoona, PA 16602
|
- sq. feet
|
- baths - beds |
show details | |

|
#46
Ben Franklin Hwy, # 31
Belsano, PA 15922
|
- sq. feet
|
- baths - beds |
show details | |

|
#47
Dysart Ave # 3
Altoona, PA 16602
|
- sq. feet
|
- baths - beds |
show details | |

|
#48
4th Ave
Altoona, PA 16602
|
- sq. feet
|
- baths - beds |
show details | |

|
#49
Frantz Ln
Tyrone, PA 16686
|
- sq. feet
|
- baths - beds |
show details | |

|
Check over 1 million property listings on Foreclosure.com!
|
browse all offers | |||

Latest news about housing in Loretto, PA collected exclusively by city-data.com from local newspapers, TV, and radio stations

 | What's with all the trash on street? (60 replies) |
| Why Hasn't Philadelphia Been Gentrified Yet? (96 replies) |
| information on ebensburg?......schools, housing, is it safe? (5 replies) |
| Is Squirrel Hill expensive? (26 replies) |
| Anyone from Johnstown pa (12 replies) |
| Murtha OK with Moving Gitmo Prisoners to PA (6 replies) |

Median year apartment built: 1962
Household type by relationship:
Households: 1,298- Male householders: 39 (12 living alone), Female householders: 51 (21 living alone)
38 spouses (38 opposite-sex spouses), 0 unmarried partners, (0 opposite-sex unmarried partners), 31 children (31 natural, 0 adopted, 0 stepchildren), 0 grandchildren, 1 brothers or sisters, 1 parents, 0 foster children, 0 other relatives, 32 non-relatives
- In group quarters: 1,100
Size of family households: 23 2-persons, 11 3-persons, 4 4-persons, 1 5-persons, 1 7-or-more-persons.
Size of nonfamily households: 33 1-person, 7 2-persons, 4 3-persons, 2 4-persons.
15 married couples with children.
0 single-parent households (0 men, 0 women).
90.5% of residents of Loretto speak English at home.
0.9% of residents speak Spanish at home (100% speak English very well).
6.8% of residents speak other Indo-European language at home (49% speak English very well, 51% speak English well).
0.2% of residents speak other language at home (100% speak English very well).
Foreign born population: 105 (8.1%)
(24.8% of them are naturalized citizens)
| Here: | 7.3 |
| State: | 6.8 |
| Here: | 4.2 |
| State: | 4.3 |

- Bedrooms in owner-occupied houses and condos in Loretto, Pennsylvania
- 0no bedroom
- 31 bedroom
- 62 bedrooms
- 363 bedrooms
- 194 bedrooms
- 35+ bedrooms

- Bedrooms in renter-occupied apartments in Loretto, Pennsylvania
- 1no bedroom
- 81 bedroom
- 82 bedrooms
- 23 bedrooms
- 64 bedrooms
- 05+ bedrooms

- Cars and other vehicles available in Loretto in owner-occupied houses/condos
- 11no vehicle
- 181 vehicle
- 202 vehicles
- 143 vehicles
- 24 vehicles
- 25+ vehicles

- Cars and other vehicles available in Loretto in renter-occupied apartments
- 1no vehicle
- 71 vehicle
- 112 vehicles
- 23 vehicles
- 44 vehicles
- 05+ vehicles

- Rooms in owner-occupied houses in Loretto, Pennsylvania
- 01 room
- 02 rooms
- 33 rooms
- 24 rooms
- 35 rooms
- 176 rooms
- 157 rooms
- 158 rooms
- 129+ rooms

- Rooms in renter-occupied apartments in Loretto, Pennsylvania
- 11 room
- 12 rooms
- 33 rooms
- 104 rooms
- 25 rooms
- 26 rooms
- 47 rooms
- 08 rooms
- 29+ rooms


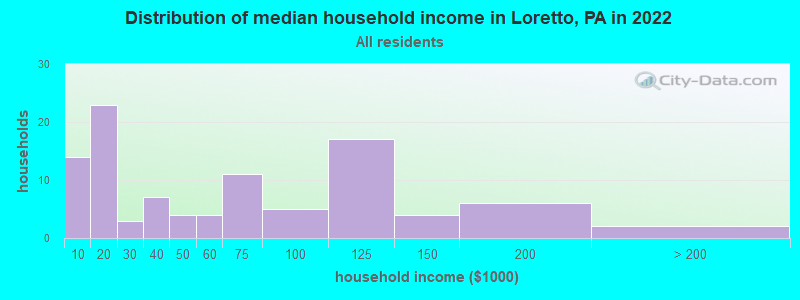
Loretto, PA household income distribution

- 14Less than $10,000
- 23$10,000 to $19,999
- 3$20,000 to $29,999
- 7$30,000 to $39,999
- 4$40,000 to $49,999
- 4$50,000 to $59,999
- 11$60,000 to $74,999
- 5$75,000 to $99,999
- 17$100,000 to $124,999
- 4$125,000 to $149,999
- 6$150,000 to $199,999
- 2$200,000 or more
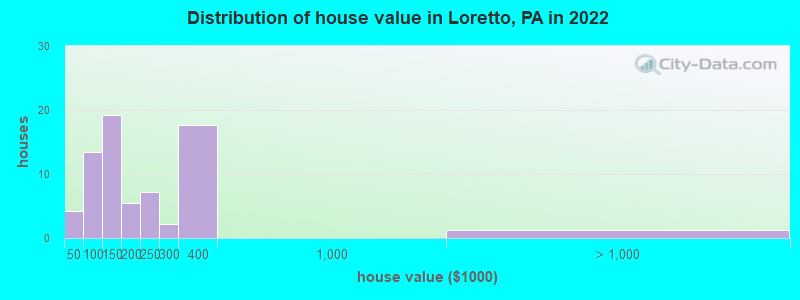
Home value of owner - occupied houses in 2022 in Loretto, PA
-
- 2$15,000 to $19,999
- 1$40,000 to $49,999
- 2$60,000 to $69,999
- 2$70,000 to $79,999
- 4$80,000 to $89,999
- 2$90,000 to $99,999
- 15$100,000 to $124,999
- 3$125,000 to $149,999
- 1$150,000 to $174,999
- 4$175,000 to $199,999
- 7$200,000 to $249,999
- 2$250,000 to $299,999
- 17$300,000 to $399,999
- 1$2,000,000 or more
Rent paid by renters in 2022 in Loretto, PA
-
- 1$250 to $299
- 2$500 to $549
- 3$550 to $599
- 0$900 to $999
- 3$1,000 to $1,249
- 6$1,250 to $1,499
- 4$2,000 to $2,499
- 4No cash rent


Percentage of workers working in this county: 77.9%
Number of people working at home: 4 (1.9% of all workers)
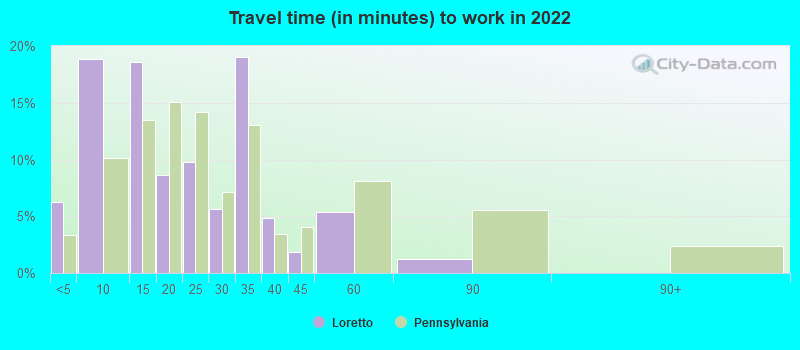
Travel time to work (commute)
- Less than 5 minutes: 47
- 5 to 9 minutes: 60
- 10 to 14 minutes: 52
- 15 to 19 minutes: 6
- 20 to 24 minutes: 5
- 25 to 29 minutes: 1
- 30 to 34 minutes: 9
- 35 to 39 minutes: 3
- 40 to 44 minutes: 0
- 45 to 59 minutes: 0
- 60 to 89 minutes: 2
- 90 or more minutes: 9
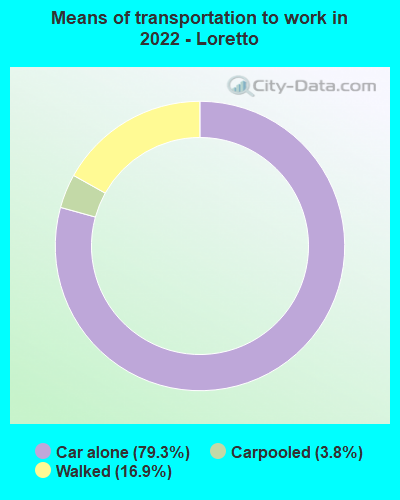
Means of transportation to work:
- Drove a car alone: 565 (76.4%)
- Carpooled: 27 (3.6%)
- Walked: 121 (16.4%)
- Worked at home: 3 (0.4%)

- Unemployment by race in 2022
- Unemployment rate for White non-Hispanic residents
- 6.1%Males
- 2.6%Females
- Unemployment rate for Black residents
- 61.6%Males

- Year of entry for the foreign-born population in Loretto, Pennsylvania
- 692010 or later
- 182000 to 2009
- 91990 to 1999
- 01980 to 1989
- 01970 to 1979
- 0Before 1970

First ancestries reported:
- German: 219 (39.8%)
- Italian: 69 (12.5%)
- Irish: 62 (11.3%)
- Polish: 34 (6.2%)
- African: 24 (4.4%)
- Scotch-Irish: 18 (3.3%)
- English: 17 (3.1%)
- American: 13 (2.4%)
- Russian: 12 (2.2%)
- Canadian: 4 (0.7%)
- Croatian: 2 (0.4%)
- European: 2 (0.4%)
- Hungarian: 2 (0.4%)
- Dutch: 1 (0.2%)
- Slovak: 1 (0.2%)
- Trinidadian and Tobagonian: 1 (0.2%)
Most common places of birth for foreign-born residents (%):
| Loretto: | 54.0% (47) |
| Pennsylvania: | 0.5% (4,424) |
| Loretto: | 16.1% (14) |
| Pennsylvania: | 1.6% (15,272) |
| Loretto: | 9.2% (8) |
| Pennsylvania: | 1.3% (12,172) |
| Loretto: | 6.9% (6) |
| Pennsylvania: | 1.8% (17,032) |
| Loretto: | 3.4% (3) |
| Pennsylvania: | 0.3% (2,635) |
| Loretto: | 3.4% (3) |
| Pennsylvania: | 7.2% (67,704) |
| Loretto: | 2.3% (2) |
| Pennsylvania: | 9.2% (86,544) |
Place of birth for U.S.-born residents:
- This state: 929
- Other state: 290
- Northeast: 81
- Midwest: 58
- South: 113
- West: 34
68.2% of Loretto residents lived in the same house 1 years ago.
Out of people who lived in different houses, 15.7% lived in this county.
Out of people who lived in different counties, 77.5% lived in Pennsylvania.
| Loretto: | 68.2% |
| State average: | 89.3% |
Education attainment for males 25 years and older:
- No schooling: 0
- Nursery to 4th grade: 0
- 5th and 6th grade: 0
- 7th and 8th grade: 0
- 9th grade: 0
- 10th grade: 0
- 11th grade: 0
- 12th grade, no diploma: 0
- High school graduate (or equivalency): 17
- Less than 1 year of college: 1
- Some college more than 1 year, no degree: 11
- Associate degree: 1
- Bachelor's degree: 44
- Master's degree: 16
- Professional school degree: 3
- Doctorate degree: 6

Education attainment for females 25 years and older:
- No schooling: 0
- Nursery to 4th grade: 0
- 5th and 6th grade: 0
- 7th and 8th grade: 0
- 9th grade: 0
- 10th grade: 0
- 11th grade: 0
- 12th grade, no diploma: 0
- High school graduate (or equivalency): 33
- Less than 1 year of college: 2
- Some college more than 1 year, no degree: 0
- Associate degree: 8
- Bachelor's degree: 14
- Master's degree: 5
- Professional school degree: 2
- Doctorate degree: 2


Housing units in structures:
- One, detached: 73
- Two: 10
- 3 or 4: 37
- 5 to 9: 32
- 10 to 19: 4
Housing units lacking complete kitchen facilities in 2022: 3.7%
House/condo owner moved in on average 33 years ago
Renter moved in on average 3 years ago

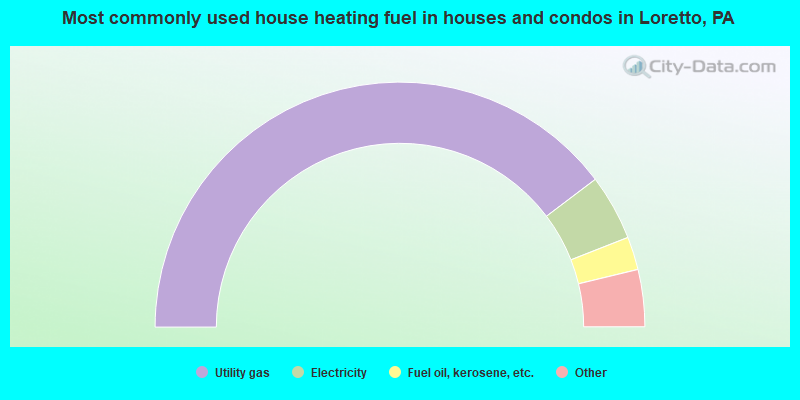
- 82.1%Utility gas
- 9.0%Electricity
- 4.5%Fuel oil, kerosene, etc.
- 3.0%Bottled, tank, or LP gas
- 1.5%Other fuel
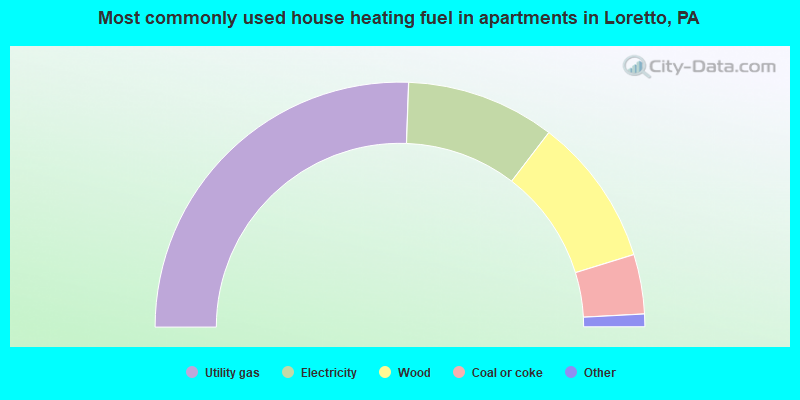
- 52.0%Utility gas
- 20.0%Electricity
- 20.0%Wood
- 8.0%Coal or coke
Private vs. public school enrollment:
| Here: | 60.0% |
| Pennsylvania: | 15.7% |
| Here: | 100.0% |
| Pennsylvania: | 13.4% |
| Here: | 78.7% |
| Pennsylvania: | 39.8% |


