Lorton, VA (Virginia) Houses and Residents
Estimated median house or condo value in 2022: $576,488 (it was $137,500 in 2000 )
Lorton:
$576,488Virginia:
$365,700
Lower value quartile - upper value quartile: $440,357 - $718,782Mean price in 2022: Detached houses: $755,660 Here:
$755,660State:
$472,865
Townhouses or other attached units: $517,041 Here:
$517,041State:
$457,437
In 5-or-more-unit structures: $322,446 Here:
$322,446State:
$382,551
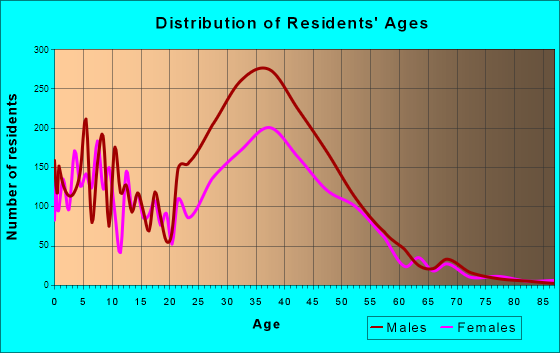
Total population: 18,610 (Urban population: 17,543, Rural population: 217 (all nonfarm) )
Houses: 7,252 (6,817 occupied: 4,252 owner occupied, 2,603 renter occupied )
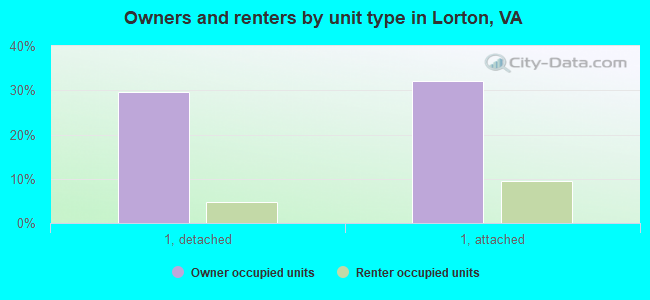
% of renters here:
38%State:
33%
Housing density: 586 houses/condos per square mile
Median price asked for vacant for-sale houses and condos in 2022: $990,944.
Median contract rent in 2022: over $2,000 (lower quartile is $1,774, upper quartile is over $2,000)
Median rent asked for vacant for-rent units in 2022: $2,773
Median gross rent in Lorton, VA in 2022: over $2,000
Housing units in Lorton with a mortgage: 3,532 (229 second mortgage, 0 home equity loan, 149 both second mortgage and home equity loan )Houses without a mortgage: 0
Median household income for houses/condos with a mortgage: $151,079
Median household income for apartments without a mortgage: $190,905
Median monthly housing costs: $2,411
Data:
Median house or condo value ($)
Median house or condo value ($ change since 2000)
Median house or condo value ($) - White
Median house or condo value ($) - Black or African American
Median house or condo value ($) - Asian
Median house or condo value ($) - Hispanic or Latino
Median house or condo value ($) - American Indian and Alaska Native
Median house or condo value ($) - Multirace
Median house or condo value ($) - Other Race
Median price asked for mobile homes ($)
Household density (households per square mile)
Mean house or condo value by units in structure - 1, detached ($)
Mean house or condo value by units in structure - 1, attached ($)
Mean house or condo value by units in structure - 2 ($)
Mean house or condo value by units in structure by units in structure - 3 or 4 ($)
Mean house or condo value by units in structure - 5 or more ($)
Mean house or condo value by units in structure - Boat, RV, van, etc. ($)
Mean house or condo value by units in structure - Mobile home ($)
Median contract rent ($)
Median contract rent - Lower quartile ($)
Median contract rent - Upper quartile ($)
Median gross rent ($)
Urban houses (%)
Rural houses (%)
Houses occupied (%)
Houses occupied (% change since 2000)
Houses owner occupied (%)
Houses owner occupied (% change since 2000)
Houses renter occupied (%)
Houses renter occupied (% change since 2000)
Vacant housing units - For rent (%)
Vacant housing units - For rent (% change since 2000)
Vacant housing units - For sale only (%)
Vacant housing units - For sale only (% change since 2000)
Vacant housing units - Rented or sold, not occupied (%)
Vacant housing units - Rented or sold, not occupied (% change since 2000)
Vacant housing units - For seasonal, recreational, or occasional use (%)
Vacant housing units - For seasonal, recreational, or occasional use (% change since 2000)
Vacant housing units - For migrant workers (%)
Vacant housing units - For migrant workers (% change since 2000)
Vacant housing units - Other vacant (%)
Vacant housing units - Other vacant (% change since 2000)
Median monthly housing costs ($)
Median household income for houses/condos with a mortgage ($)
Median household income for houses/condos without a mortgage ($)
Median household income ($)
Median household income ($) - White
Median household income ($) - Black or African American
Median household income ($) - Asian
Median household income ($) - Hispanic or Latino
Median household income ($) - American Indian and Alaska Native
Median household income ($) - Multirace
Median household income ($) - Other Race
Mortgage status - with mortgage (%)
Mortgage status - with second mortgage (%)
Mortgage status - with home equity loan (%)
Mortgage status - with both second mortgage and home equity loan (%)
Mortgage status - without a mortgage (%)
Median year house/condo built
Median year apartment built
Household type by relationship - Male householder living alone (%)
Household type by relationship - Male householder not living alone (%)
Household type by relationship - Female householder living alone (%)
Household type by relationship - Female householder not living alone (%)
Household type by relationship - Opposite-Sex spouse (%)
Household type by relationship - Same-Sex spouse (%)
Household type by relationship - Opposite-Sex unmarried partner (%)
Household type by relationship - Same-Sex unmarried partner (%)
Household type by relationship - In group quarters (%)
Size of family households - 2-person household (%)
Size of family households - 3-person household (%)
Size of family households - 4-person household (%)
Size of family households - 5-person household (%)
Size of family households - 6-person household (%)
Size of family households - 7-or-more-person household (%)
Size of nonfamily households - 1-person household (%)
Size of nonfamily households - 2-person household (%)
Size of nonfamily households - 3-person household (%)
Size of nonfamily households - 4-person household (%)
Size of nonfamily households - 5-person household (%)
Size of nonfamily households - 6-person household (%)
Size of nonfamily households - 7-or-moreperson household (%)
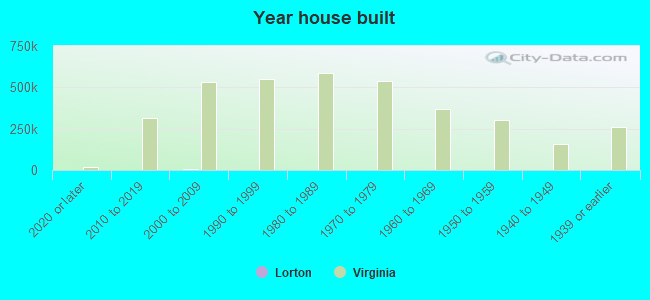
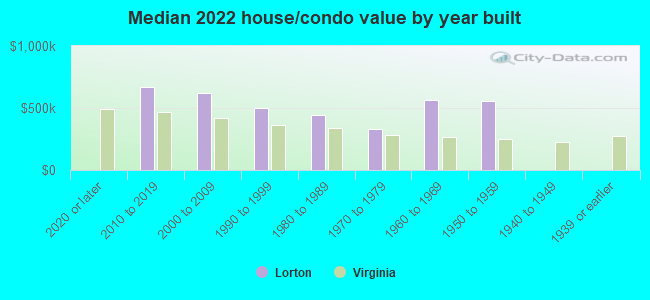
Year house built - Built 2010 or later (%)
Year house built - Built 2000 to 2009 (%)
Year house built - Built 1990 to 1999 (%)
Year house built - Built 1980 to 1989 (%)
Year house built - Built 1970 to 1979 (%)
Year house built - Built 1960 to 1969 (%)
Year house built - Built 1950 to 1959 (%)
Year house built - Built 1940 to 1949 (%)
Year house built - Built 1939 or earlier (%)
Median number of rooms in houses and condos
Median number of rooms in apartments
Median number of bedrooms in owner occupied houses
Mean number of bedrooms in owner occupied houses
Median number of bedrooms in renter occupied houses
Mean number of bedrooms in renter occupied houses
Median number of vehichles in owner occupied houses
Mean number of vehichles in owner occupied houses
Median number of vehichles in renter occupied houses
Mean number of vehichles in renter occupied houses
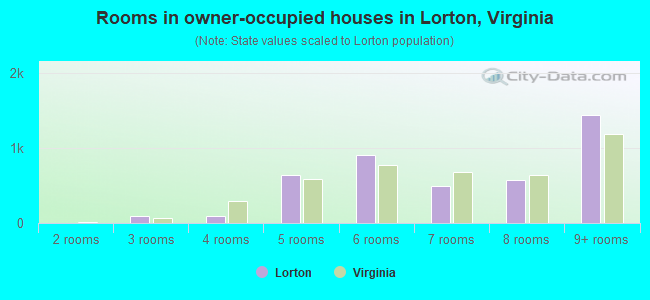
Rooms in owner-occupied houses - 1 room (%)
Rooms in owner-occupied houses - 2 rooms (%)
Rooms in owner-occupied houses - 3 rooms (%)
Rooms in owner-occupied houses - 4 rooms (%)
Rooms in owner-occupied houses - 5 rooms (%)
Rooms in owner-occupied houses - 6 rooms (%)
Rooms in owner-occupied houses - 7 rooms (%)
Rooms in owner-occupied houses - 8 rooms (%)
Rooms in owner-occupied houses - 9+ rooms (%)
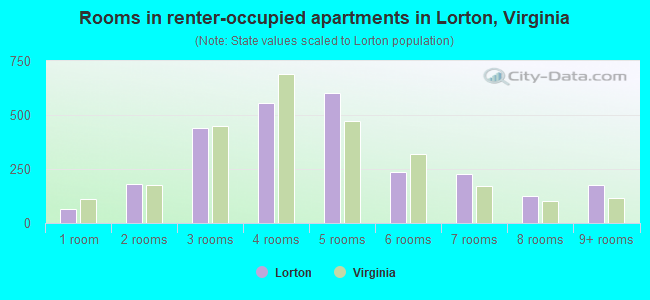
Rooms in renter-occupied houses - 1 room (%)
Rooms in renter-occupied houses - 2 rooms (%)
Rooms in renter-occupied houses - 3 rooms (%)
Rooms in renter-occupied houses - 4 rooms (%)
Rooms in renter-occupied houses - 5 rooms (%)
Rooms in renter-occupied houses - 6 rooms (%)
Rooms in renter-occupied houses - 7 rooms (%)
Rooms in renter-occupied houses - 8 rooms (%)
Rooms in renter-occupied houses - 9+ rooms (%)
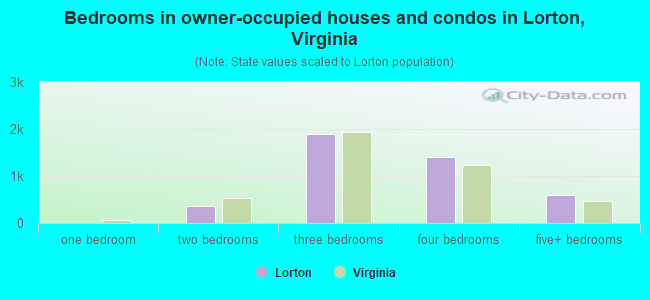
Bedrooms in owner-occupied houses - no bedrooms (%)
Bedrooms in owner-occupied houses - 1 bedroom (%)
Bedrooms in owner-occupied houses - 2 bedrooms (%)
Bedrooms in owner-occupied houses - 3 bedrooms (%)
Bedrooms in owner-occupied houses - 4 bedrooms (%)
Bedrooms in owner-occupied houses - 5+ bedrooms (%)
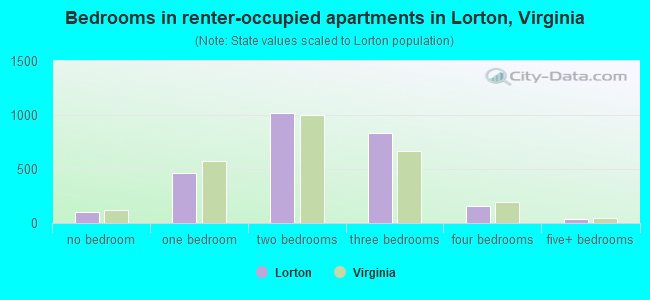
Bedrooms in renter-occupied houses - no bedrooms (%)
Bedrooms in renter-occupied houses - 1 bedroom (%)
Bedrooms in renter-occupied houses - 2 bedrooms (%)
Bedrooms in renter-occupied houses - 3 bedrooms (%)
Bedrooms in renter-occupied houses - 4 bedrooms (%)
Bedrooms in renter-occupied houses - 5+ bedrooms (%)
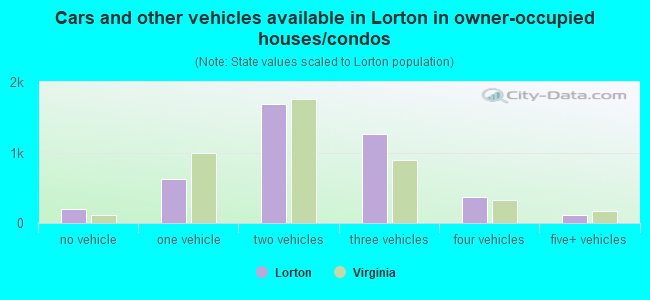
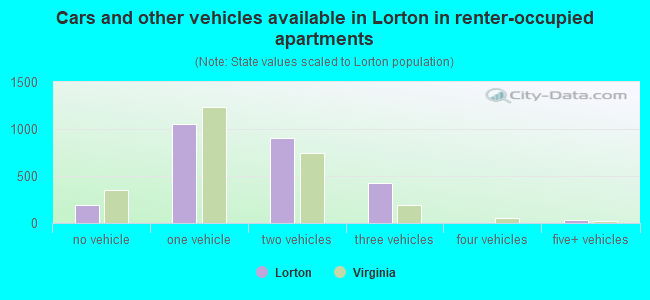
Vehicles available in owner-occupied houses - no vehicle available (%)
Vehicles available in owner-occupied houses - 1 vehicle available(%)
Vehicles available in owner-occupied houses - 2 Vehicles available (%)
Vehicles available in owner-occupied houses - 3 Vehicles available (%)
Vehicles available in owner-occupied houses - 4 Vehicles available (%)
Vehicles available in owner-occupied houses - 5+ Vehicles available (%)
Vehicles available in renter-occupied houses - no vehicle available (%)
Vehicles available in renter-occupied houses - 1 vehicle available (%)
Vehicles available in renter-occupied houses - 2 Vehicles available (%)
Vehicles available in renter-occupied houses - 3 Vehicles available (%)
Vehicles available in renter-occupied houses - 4 Vehicles available (%)
Vehicles available in renter-occupied houses - 5+ Vehicles available (%)
Housing units in structures - 1, detached (%)
Housing units in structures - 1, attached (%)
Housing units in structures - 2 (%)
Housing units in structures - 3 or 4 (%)
Housing units in structures - 5 to 9 (%)
Housing units in structures - 10 to 19 (%)
Housing units in structures - 20 to 49 (%)
Housing units in structures - 50 or more (%)
Housing units in structures - Mobile home (%)
Housing units in structures - Boat, RV, van, etc. (%)
Housing units in structures - Owners - 1, detached (%)
Housing units in structures - Owners - 1, attached (%)
Housing units in structures - Owners - 2 (%)
Housing units in structures - Owners - 3 or 4 (%)
Housing units in structures - Owners - 5 to 9 (%)
Housing units in structures - Owners - 10 to 19 (%)
Housing units in structures - Owners - 20 to 49 (%)
Housing units in structures - Owners - 50 or more (%)
Housing units in structures - Owners - Mobile home (%)
Housing units in structures - Owners - Boat, RV, van, etc. (%)
Housing units in structures - Renters - 1, detached (%)
Housing units in structures - Renters - 1, attached (%)
Housing units in structures - Renters - 2 (%)
Housing units in structures - Renters - 3 or 4 (%)
Housing units in structures - Renters - 5 to 9 (%)
Housing units in structures - Renters - 10 to 19 (%)
Housing units in structures - Renters - 20 to 49 (%)
Housing units in structures - Renters - 50 or more (%)
Housing units in structures - Renters - Mobile home (%)
Housing units in structures - Renters - Boat, RV, van, etc. (%)
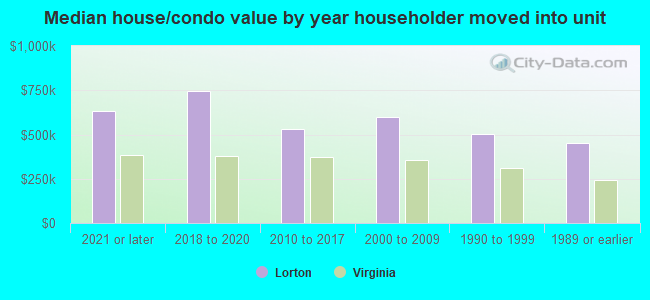
House/condo owner moved in on average (years ago)
Renter moved in on average (years ago)
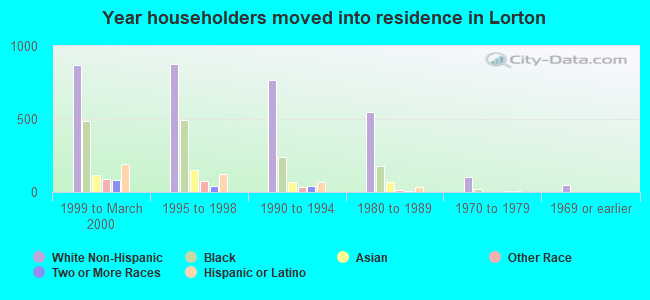
Year householder moved into unit - Moved in 1999 to March 2000 (%)
Year householder moved into unit - Moved in 1999 to March 2000 (%) - White
Year householder moved into unit - Moved in 1999 to March 2000 (%) - Black or African American
Year householder moved into unit - Moved in 1999 to March 2000 (%) - Asian
Year householder moved into unit - Moved in 1999 to March 2000 (%) - Hispanic or Latino
Year householder moved into unit - Moved in 1999 to March 2000 (%) - American Indian and Alaska Native
Year householder moved into unit - Moved in 1999 to March 2000 (%) - Multirace
Year householder moved into unit - Moved in 1999 to March 2000 (%) - Other Race
Year householder moved into unit - Moved in 1995 to 1998 (%)
Year householder moved into unit - Moved in 1995 to 1998 (%) - White
Year householder moved into unit - Moved in 1995 to 1998 (%) - Black or African American
Year householder moved into unit - Moved in 1995 to 1998 (%) - Asian
Year householder moved into unit - Moved in 1995 to 1998 (%) - Hispanic or Latino
Year householder moved into unit - Moved in 1995 to 1998 (%) - American Indian and Alaska Native
Year householder moved into unit - Moved in 1995 to 1998 (%) - Multirace
Year householder moved into unit - Moved in 1995 to 1998 (%) - Other Race
Year householder moved into unit - Moved in 1990 to 1994 (%)
Year householder moved into unit - Moved in 1990 to 1994 (%) - White
Year householder moved into unit - Moved in 1990 to 1994 (%) - Black or African American
Year householder moved into unit - Moved in 1990 to 1994 (%) - Asian
Year householder moved into unit - Moved in 1990 to 1994 (%) - Hispanic or Latino
Year householder moved into unit - Moved in 1990 to 1994 (%) - American Indian and Alaska Native
Year householder moved into unit - Moved in 1990 to 1994 (%) - Multirace
Year householder moved into unit - Moved in 1990 to 1994 (%) - Other Race
Year householder moved into unit - Moved in 1980 to 1989 (%)
Year householder moved into unit - Moved in 1980 to 1989 (%) - White
Year householder moved into unit - Moved in 1980 to 1989 (%) - Black or African American
Year householder moved into unit - Moved in 1980 to 1989 (%) - Asian
Year householder moved into unit - Moved in 1980 to 1989 (%) - Hispanic or Latino
Year householder moved into unit - Moved in 1980 to 1989 (%) - American Indian and Alaska Native
Year householder moved into unit - Moved in 1980 to 1989 (%) - Multirace
Year householder moved into unit - Moved in 1980 to 1989 (%) - Other Race
Year householder moved into unit - Moved in 1970 to 1979 (%)
Year householder moved into unit - Moved in 1970 to 1979 (%) - White
Year householder moved into unit - Moved in 1970 to 1979 (%) - Black or African American
Year householder moved into unit - Moved in 1970 to 1979 (%) - Asian
Year householder moved into unit - Moved in 1970 to 1979 (%) - Hispanic or Latino
Year householder moved into unit - Moved in 1970 to 1979 (%) - American Indian and Alaska Native
Year householder moved into unit - Moved in 1970 to 1979 (%) - Multirace
Year householder moved into unit - Moved in 1970 to 1979 (%) - Other Race
Year householder moved into unit - Moved in 1969 or earlier (%)
Year householder moved into unit - Moved in 1969 or earlier (%) - White
Year householder moved into unit - Moved in 1969 or earlier (%) - Black or African American
Year householder moved into unit - Moved in 1969 or earlier (%) - Asian
Year householder moved into unit - Moved in 1969 or earlier (%) - Hispanic or Latino
Year householder moved into unit - Moved in 1969 or earlier (%) - American Indian and Alaska Native
Year householder moved into unit - Moved in 1969 or earlier (%) - Multirace
Year householder moved into unit - Moved in 1969 or earlier (%) - Other Race
Housing units lacking complete plumbing facilities (%)
Housing units lacking complete kitchen facilities (%)
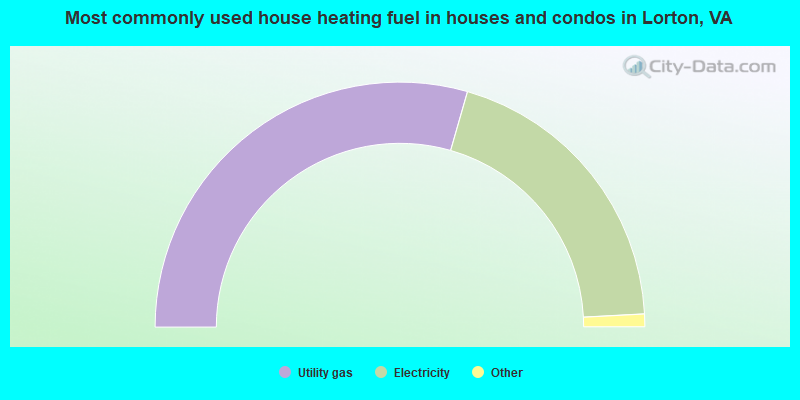
House heating fuel used in houses and condos - Utility gas (%)
House heating fuel used in houses and condos - Bottled, tank, or LP gas (%)
House heating fuel used in houses and condos - Electricity (%)
House heating fuel used in houses and condos - Fuel oil, kerosene, etc. (%)
House heating fuel used in houses and condos - Coal or coke (%)
House heating fuel used in houses and condos - Wood (%)
House heating fuel used in houses and condos - Solar energy (%)
House heating fuel used in houses and condos - Other fuel (%)
House heating fuel used in houses and condos - No fuel used (%)
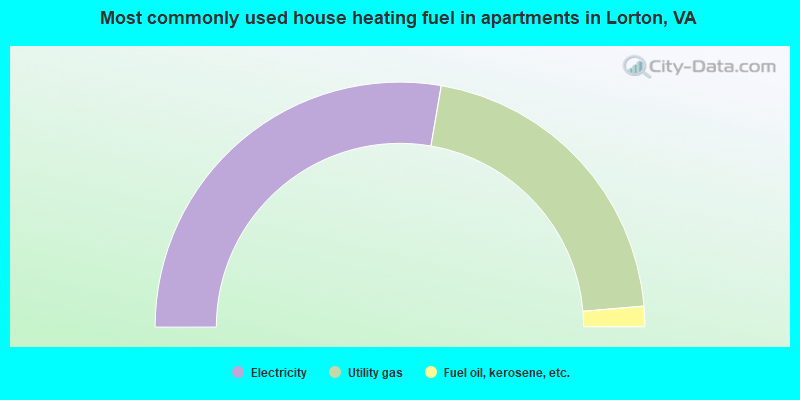
House heating fuel used in apartments - Utility gas (%)
House heating fuel used in apartments - Bottled, tank, or LP gas (%)
House heating fuel used in apartments - Electricity (%)
House heating fuel used in apartments - Fuel oil, kerosene, etc. (%)
House heating fuel used in apartments - Coal or coke (%)
House heating fuel used in apartments - Wood (%)
House heating fuel used in apartments - Solar energy (%)
House heating fuel used in apartments - Other fuel (%)
House heating fuel used in apartments - No fuel used (%)
Latest news about housing in Lorton, VA collected exclusively by city-data.com from local newspapers, TV, and radio stations
Median year house/condo built: 2002Median year apartment built: 1995Household type by relationship:
Households: 21,913
Male householders: 3,804 (415 living alone ), Female householders: 2,926 (825 living alone )4,307 spouses (4,307 opposite-sex spouses ), 165 unmarried partners , (140 opposite-sex unmarried partners ), 7,757 children (7,486 natural , 98 adopted , 171 stepchildren ), 227 grandchildren , 534 brothers or sisters , 940 parents , 0 foster children , 658 other relatives , 511 non-relatives In group quarters: 78
Size of family households: 1,379 2-persons , 1,355 3-persons , 1,060 4-persons , 830 5-persons , 363 6-persons , 263 7-or-more-persons .
Size of nonfamily households: 1,280 1-person , 256 2-persons .
4,619 married couples with children. single-parent households (386 men , 557 women ).
56.1% of residents of Lorton speak English at home. of residents speak Spanish at home (71% speak English very well , 19% speak English well , 5% speak English not well , 4% don't speak English at all ).of residents speak other Indo-European language at home (55% speak English very well , 41% speak English well , 4% speak English not well ).of residents speak Asian or Pacific Island language at home (60% speak English very well , 18% speak English well , 19% speak English not well , 3% don't speak English at all ).of residents speak other language at home (78% speak English very well , 16% speak English well , 3% speak English not well , 3% don't speak English at all ).
Foreign born population: 7,488 (34.2%)of them are naturalized citizens )
Median number of rooms in houses and condos:
Median number of rooms in apartments
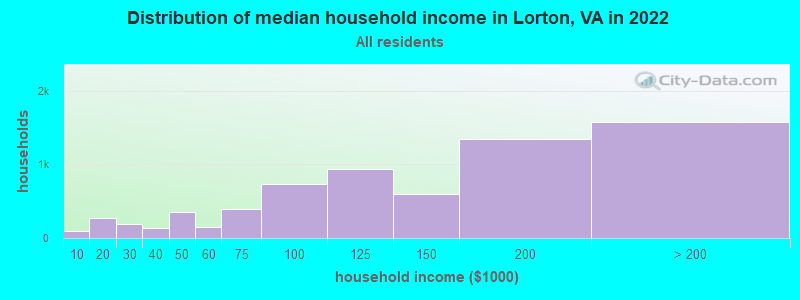
Lorton, VA household income distribution 100 Less than $10,000271 $10,000 to $19,999193 $20,000 to $29,999132 $30,000 to $39,999360 $40,000 to $49,999143 $50,000 to $59,999394 $60,000 to $74,999735 $75,000 to $99,999944 $100,000 to $124,999597 $125,000 to $149,9991,352 $150,000 to $199,9991,578 $200,000 or more
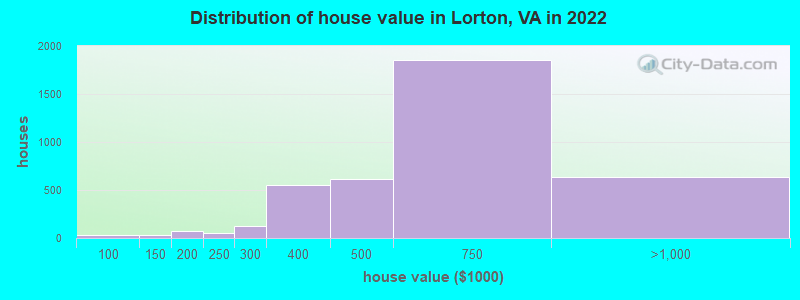
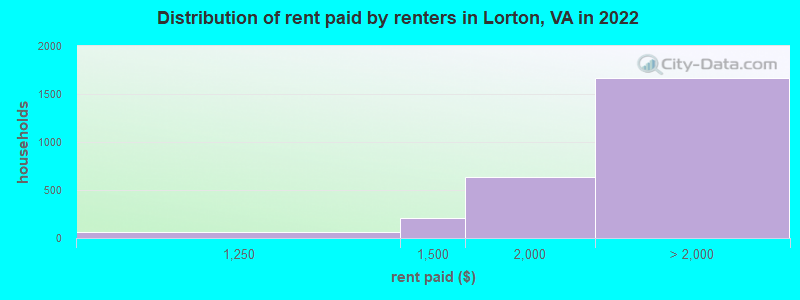
Home value of owner - occupied houses in 2022 in Lorton, VA 13 Less than $10,00036 $80,000 to $89,99912 $100,000 to $124,99914 $125,000 to $149,99972 $175,000 to $199,99947 $200,000 to $249,999119 $250,000 to $299,999555 $300,000 to $399,999616 $400,000 to $499,9991,859 $500,000 to $749,999623 $750,000 to $999,99914 $1,000,000 to $1,499,999Rent paid by renters in 2022 in Lorton, VA 13 $500 to $5497 $650 to $69963 $1,000 to $1,249204 $1,250 to $1,499637 $1,500 to $1,999729 $2,000 to $2,499280 $2,500 to $2,999290 $3,000 to $3,499255 $3,500 or more109 No cash rent
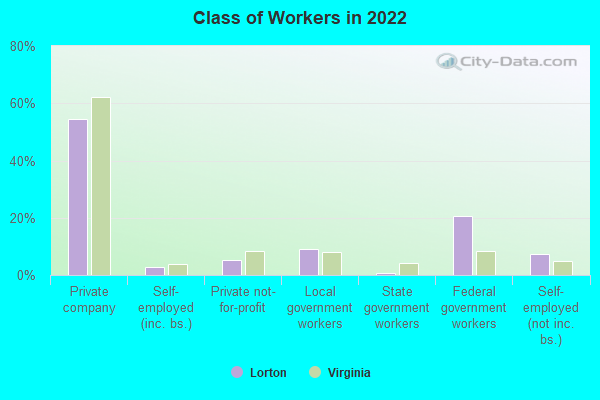
Percentage of workers working in this county: 72.8%Number of people working at home: 2,631 (23.6% of all workers )
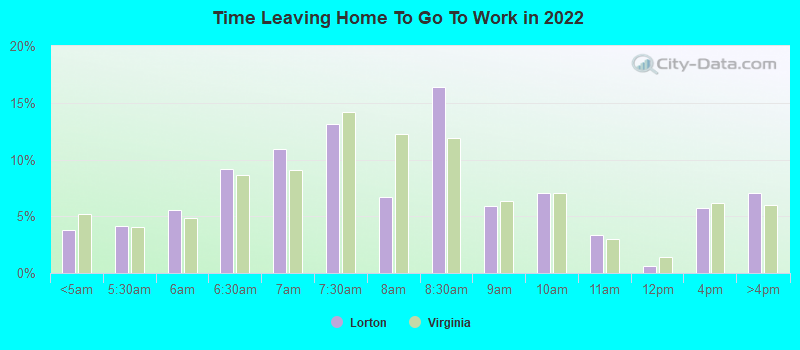
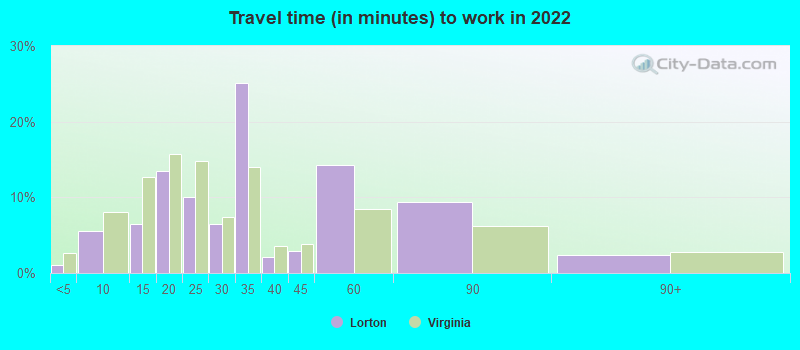
Travel time to work (commute)
Less than 5 minutes: 05 to 9 minutes: 53010 to 14 minutes: 71515 to 19 minutes: 1,31120 to 24 minutes: 91625 to 29 minutes: 49330 to 34 minutes: 1,72135 to 39 minutes: 26840 to 44 minutes: 27745 to 59 minutes: 85260 to 89 minutes: 93190 or more minutes: 154
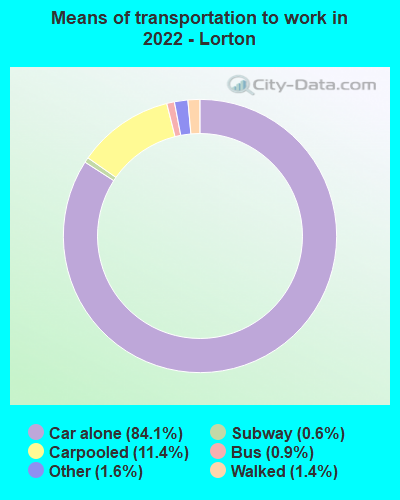
Means of transportation to work:
Drove a car alone: 5,652 (60.7%)Carpooled: 785 (8.4%)Bus : 40 (0.4%)Long-distance train or commuter rail : 23 (0.2%)Light rail, streetcar or trolley : 6 (0.1%)Taxi: 143 (1.5%)Walked: 110 (1.2%)Worked at home: 2,631 (28.3%)
Unemployment by race in 2022
Unemployment rate for White non-Hispanic residents 6.6% Males9.6% FemalesUnemployment rate for Black residents 2.4% Males1.5% FemalesUnemployment rate for other race residents 3.1% Males5.2% FemalesUnemployment rate for two or more race residents 9.3% Males7.3% FemalesUnemployment rate for Hispanic or Latino residents 6.1% Males2.1% Females
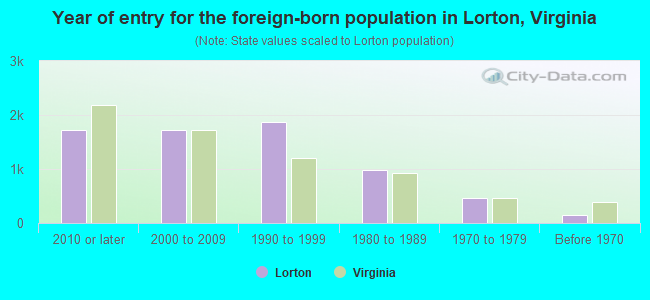
Year of entry for the foreign-born population in Lorton, Virginia
1,727 2010 or later 1,716 2000 to 2009 1,864 1990 to 1999 974 1980 to 1989 459 1970 to 1979 152 Before 1970
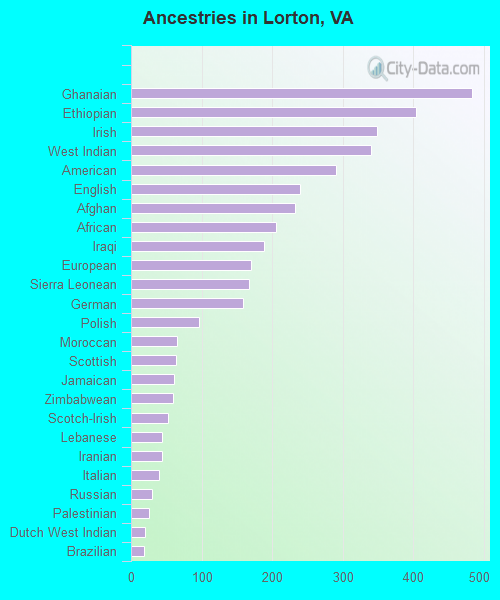
First ancestries reported:
Ghanaian: 483 (3.7%)
Ethiopian: 404 (3.1%)
Irish: 348 (2.6%)
West Indian: 340 (2.6%)
American: 291 (2.2%)
English: 240 (1.8%)
Afghan: 233 (1.8%)
African: 205 (1.5%)
Iraqi: 189 (1.4%)
European: 170 (1.3%)
Sierra Leonean: 167 (1.3%)
German: 158 (1.2%)
Polish: 96 (0.7%)
Moroccan: 65 (0.5%)
Scottish: 64 (0.5%)
Jamaican: 61 (0.5%)
Zimbabwean: 60 (0.5%)
Scotch-Irish: 53 (0.4%)
Lebanese: 44 (0.3%)
Iranian: 44 (0.3%)
Italian: 39 (0.3%)
Russian: 30 (0.2%)
Palestinian: 26 (0.2%)
Dutch West Indian: 20 (0.2%)
Brazilian: 18 (0.1%)
British: 16 (0.1%)
Eastern European: 15 (0.1%)
Norwegian: 9 (0.07%)
Slovak: 9 (0.07%)
Welsh: 9 (0.07%)
Pennsylvania German: 5 (0.04%)
Canadian: 4 (0.03%)
French: 2 (0.02%) Most common places of birth for foreign-born residents (%): Honduras Lorton:
11.2% (835)Virginia:
3.0% (32,892)
Ghana Lorton:
9.6% (720)Virginia:
1.6% (17,346)
Vietnam Lorton:
8.1% (610)Virginia:
4.2% (45,750)
Philippines Lorton:
7.9% (592)Virginia:
4.8% (52,629)
Ethiopia Lorton:
7.3% (549)Virginia:
2.9% (32,082)
India Lorton:
5.5% (415)Virginia:
9.0% (97,830)
Bangladesh Lorton:
5.5% (410)Virginia:
1.1% (12,049)
El Salvador Lorton:
4.9% (368)Virginia:
9.9% (107,534)
United Kingdom, excluding England and Scotland Lorton:
3.9% (294)Virginia:
0.8% (8,513)
China, excluding Hong Kong and Taiwan Lorton:
3.9% (289)Virginia:
3.9% (42,989)
Korea Lorton:
3.7% (278)Virginia:
4.9% (52,857)
Sierra Leone Lorton:
3.0% (226)Virginia:
0.6% (6,458)
Saudi Arabia Lorton:
2.9% (215)Virginia:
0.3% (3,713)
Peru Lorton:
2.4% (176)Virginia:
2.4% (26,366)
Iraq Lorton:
2.3% (170)Virginia:
0.9% (9,351)
Bolivia Lorton:
2.2% (161)Virginia:
2.4% (25,722)
Afghanistan Lorton:
2.1% (155)Virginia:
1.8% (19,426)
Africa, n.e.c. Lorton:
1.6% (122)Virginia:
0.3% (3,275)
Place of birth for U.S.-born residents:
This state: 6,705Other state: 6,968Northeast: 1,331Midwest: 1,463South: 3,454West: 641 84.7% of Lorton residents lived in the same house 1 years ago.
Out of people who lived in different houses, 32.9% lived in this county.
Out of people who lived in different counties, 21.4% lived in Virginia.
Lorton:
84.7%State average:
86.6%
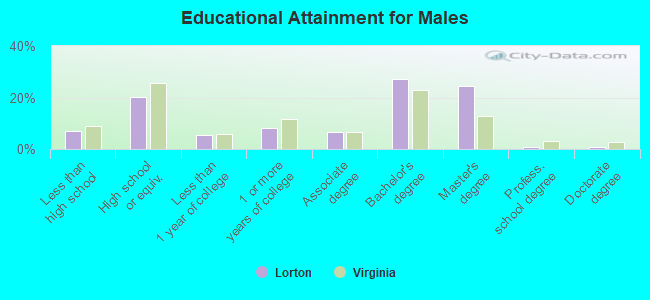
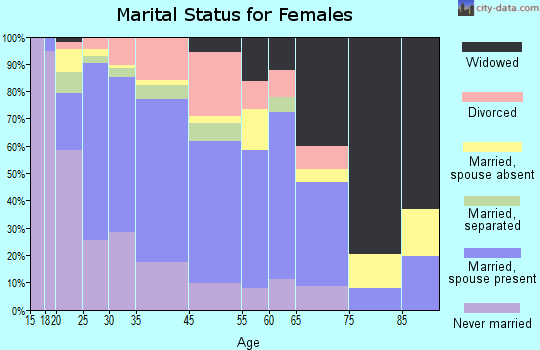
Education attainment for males 25 years and older:
No schooling: 108Nursery to 4th grade: 05th and 6th grade: 407th and 8th grade: 39th grade: 5710th grade: 6511th grade: 2012th grade, no diploma: 143High school graduate (or equivalency): 1,257Less than 1 year of college: 335Some college more than 1 year, no degree: 508Associate degree: 410Bachelor's degree: 1,694Master's degree: 1,520Professional school degree: 54Doctorate degree: 47
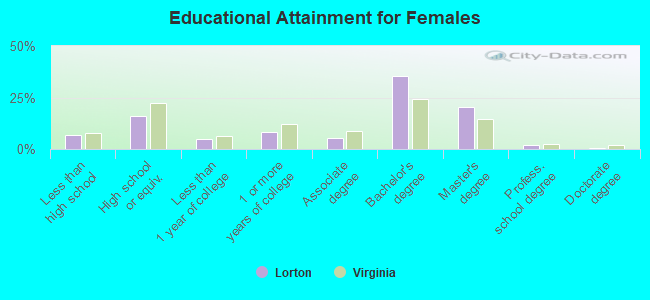
Education attainment for females 25 years and older:
No schooling: 305Nursery to 4th grade: 325th and 6th grade: 07th and 8th grade: 199th grade: 5710th grade: 1211th grade: 012th grade, no diploma: 86High school graduate (or equivalency): 1,185Less than 1 year of college: 353Some college more than 1 year, no degree: 612Associate degree: 408Bachelor's degree: 2,586Master's degree: 1,500Professional school degree: 139Doctorate degree: 31
Housing units in structures:
One, detached: 2,504One, attached: 2,7503 or 4: 665 to 9: 32710 to 19: 80520 to 49: 26850 or more: 530Housing units lacking complete plumbing facilities in 2022: 0.2%Housing units lacking complete kitchen facilities in 2022: 0.7%House/condo owner moved in on average 9 years ago
Renter moved in on average 3 years ago
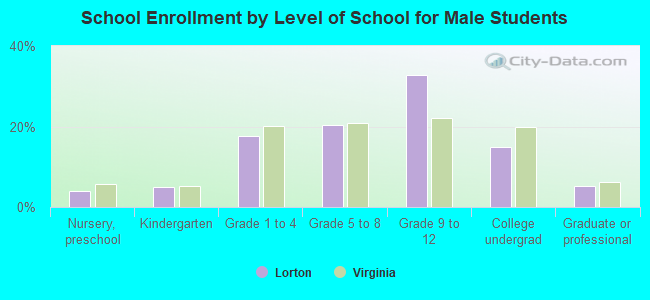
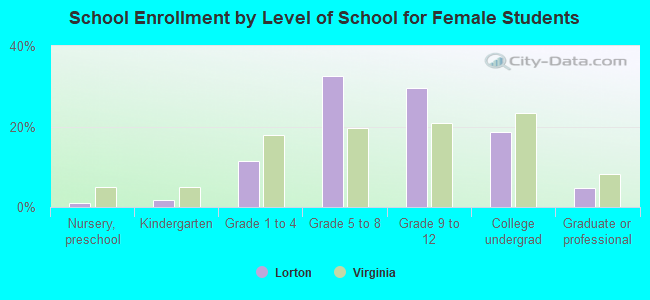
Private vs. public school enrollment:
Students in private schools in grades 1 to 8 (elementary and middle school): 203 Students in private schools in grades 9 to 12 (high school): 15 Students in private undergraduate colleges: 325