Jump to a detailed profile or search site with Google Custom Search

Los Altos, CA (California) Houses and Residents

Estimated median house or condo value in 2022: $2,241,040 (it was $973,500 in 2000)
Los Altos:

$2,241,040
California:

$715,900
Lower value quartile - upper value quartile: $2,079,454 - Over $2,000,001

Mean price in 2022:

Detached houses: $3,712,662
Here:

$3,712,662
State:

$988,808

Townhouses or other attached units: $2,535,483
Here:

$2,535,483
State:

$838,546

In 3-to-4-unit structures: $2,893,788
Here:

$2,893,788
State:

$824,253

In 5-or-more-unit structures: $1,941,627
Here:

$1,941,627
State:

$730,996

Mobile homes: $162,528
Here:

$162,528
State:

$184,506

Total population: 30,288 (Urban population: 27,585, Rural population: 0)

Houses: 11,833 (11,025 occupied: 8,960 owner occupied, 2,028 renter occupied)

% of renters here:

18%
State:

44%

Housing density: 1,863 houses/condos per square mile

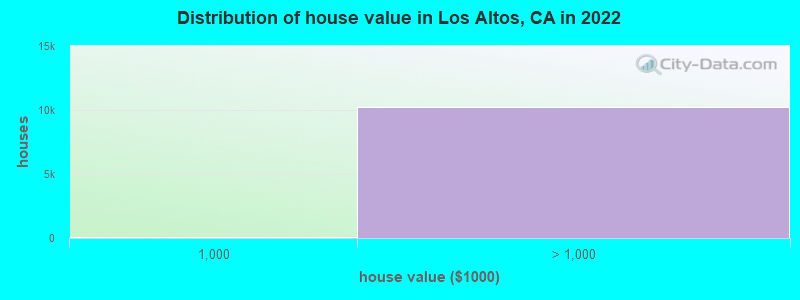
Median price asked for vacant for-sale houses and condos in 2022: $3,401,506.

Median contract rent in 2022: over $2,000


Median rent asked for vacant for-rent units in 2022: $5,739


Median gross rent in Los Altos, CA in 2022: over $2,000

Housing units in Los Altos with a mortgage: 5,368 (862 second mortgage, 63 home equity loan, 724 both second mortgage and home equity loan)
Houses without a mortgage: 60

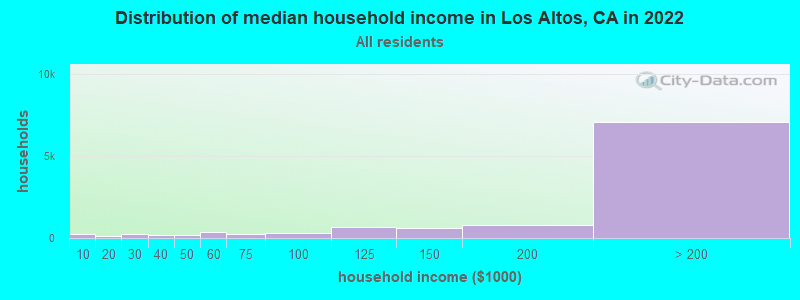
Median household income for houses/condos with a mortgage: $253,538

Median household income for apartments without a mortgage: $229,190

Median monthly housing costs: $3,833

Compare current foreclosures near Los Altos, CA:

Check out more offers near Los Altos, CA.
Powered by Foreclosure.com

Settings
X
Data:
Loading data...
Based on 2000-2022 data
Loading data...

123
Hide US histogram

Los Altos, California Age and Sex of Residents
Median year house/condo built: 1961

Median year apartment built: 1975

Household type by relationship:

Households: 30,387
  • Male householders: 6,554 (715 living alone), Female householders: 4,072 (1,052 living alone)
  • 7,956 spouses (7,913 opposite-sex spouses), 213 unmarried partners, (196 opposite-sex unmarried partners), 9,702 children (9,500 natural, 154 adopted, 47 stepchildren), 290 grandchildren, 42 brothers or sisters, 537 parents, 0 foster children, 270 other relatives, 435 non-relatives
  • In group quarters: 311

Size of family households: 3,621 2-persons, 1,914 3-persons, 2,406 4-persons, 695 5-persons, 84 6-persons, 50 7-or-more-persons.

Size of nonfamily households: 1,946 1-person, 208 2-persons, 33 3-persons, 22 6-persons.

6,347 married couples with children.
440 single-parent households (181 men, 259 women).

64.5% of residents of Los Altos speak English at home.
2.6% of residents speak Spanish at home (76% speak English very well, 20% speak English well, 3% speak English not well, 1% don't speak English at all).
13.5% of residents speak other Indo-European language at home (88% speak English very well, 9% speak English well, 2% speak English not well, 1% don't speak English at all).
18.0% of residents speak Asian or Pacific Island language at home (76% speak English very well, 18% speak English well, 4% speak English not well, 2% don't speak English at all).
1.6% of residents speak other language at home (91% speak English very well, 8% speak English well, 1% speak English not well).

Foreign born population: 10,446 (34.4%)
(67.4% of them are naturalized citizens)

Median number of rooms in houses and condos:
Here:

7.2
State:

6.0

Median number of rooms in apartments
Here:

4.2
State:

3.9

Owner-occupied Renter-occupied
Bedrooms in owner-occupied houses and condos in Los Altos, California
  • Bedrooms in owner-occupied houses and condos in Los Altos, California
  • 0no bedroom
  • 1011 bedroom
  • 6652 bedrooms
  • 2,8463 bedrooms
  • 3,9684 bedrooms
  • 1,3815+ bedrooms
Bedrooms in renter-occupied apartments in Los Altos, California
  • Bedrooms in renter-occupied apartments in Los Altos, California
  • 122no bedroom
  • 4321 bedroom
  • 6532 bedrooms
  • 5033 bedrooms
  • 2764 bedrooms
  • 435+ bedrooms
Owner-occupied Renter-occupied
Cars and other vehicles available in Los Altos in owner-occupied houses/condos
  • Cars and other vehicles available in Los Altos in owner-occupied houses/condos
  • 100no vehicle
  • 1,3211 vehicle
  • 4,4352 vehicles
  • 2,2593 vehicles
  • 6964 vehicles
  • 1485+ vehicles
Cars and other vehicles available in Los Altos in renter-occupied apartments
  • Cars and other vehicles available in Los Altos in renter-occupied apartments
  • 105no vehicle
  • 8921 vehicle
  • 7142 vehicles
  • 2013 vehicles
  • 894 vehicles
  • 285+ vehicles
Owner-occupied Renter-occupied
Rooms in owner-occupied houses in Los Altos, California
  • Rooms in owner-occupied houses in Los Altos, California
  • 01 room
  • 202 rooms
  • 1163 rooms
  • 3134 rooms
  • 1,0085 rooms
  • 1,5026 rooms
  • 2,0507 rooms
  • 1,6808 rooms
  • 2,2719+ rooms
Rooms in renter-occupied apartments in Los Altos, California
  • Rooms in renter-occupied apartments in Los Altos, California
  • 1221 room
  • 1652 rooms
  • 3593 rooms
  • 4784 rooms
  • 2855 rooms
  • 2576 rooms
  • 1707 rooms
  • 988 rooms
  • 959+ rooms
Year house built
Median 2022 house/condo value by year built
Median house/condo value by year householder moved into unit
Breakdown of mean house values by ages of householders
Owners and renters by unit type in Los Altos, CA
  • Los Altos, CA household income distribution

  • Distribution of median household income in Los Altos, CA in 2022
  • 271Less than $10,000
  • 152$10,000 to $19,999
  • 249$20,000 to $29,999
  • 188$30,000 to $39,999
  • 178$40,000 to $49,999
  • 336$50,000 to $59,999
  • 243$60,000 to $74,999
  • 290$75,000 to $99,999
  • 686$100,000 to $124,999
  • 580$125,000 to $149,999
  • 786$150,000 to $199,999
  • 7,062$200,000 or more
  • Home value of owner - occupied houses in 2022 in Los Altos, CA

  • Distribution of house value in Los Altos, CA in 2022
  • 72Less than $10,000
  • 4$35,000 to $39,999
  • 15$150,000 to $174,999
  • 15$250,000 to $299,999
  • 22$300,000 to $399,999
  • 33$400,000 to $499,999
  • 74$500,000 to $749,999
  • 93$750,000 to $999,999
  • 318$1,000,000 to $1,499,999
  • 495$1,500,000 to $1,999,999
  • 9,392$2,000,000 or more
  • Rent paid by renters in 2022 in Los Altos, CA

  • Distribution of rent paid by renters in Los Altos, CA in 2022
  • 67$200 to $249
  • 10$800 to $899
  • 57$1,000 to $1,249
  • 220$1,500 to $1,999
  • 78$2,000 to $2,499
  • 168$2,500 to $2,999
  • 229$3,000 to $3,499
  • 1,043$3,500 or more
  • 104No cash rent
Time Leaving Home To Go To Work in 2022

Percentage of workers working in this county: 87.5%
Number of people working at home: 5,656 (42.1% of all workers)

Travel time (in minutes) to work in 2022

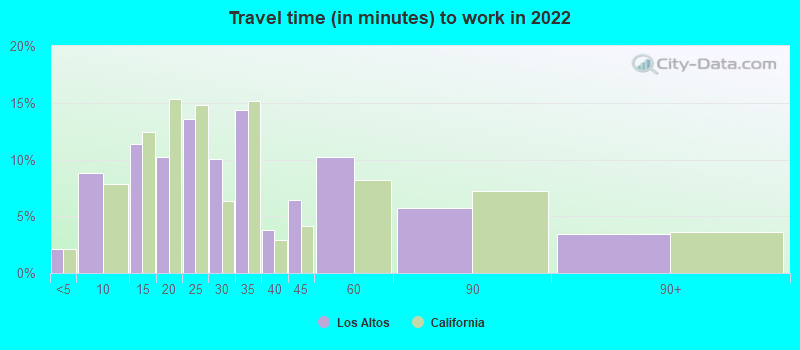
Travel time to work (commute)

  • Less than 5 minutes: 145
  • 5 to 9 minutes: 821
  • 10 to 14 minutes: 1,073
  • 15 to 19 minutes: 1,556
  • 20 to 24 minutes: 2,059
  • 25 to 29 minutes: 948
  • 30 to 34 minutes: 1,098
  • 35 to 39 minutes: 268
  • 40 to 44 minutes: 171
  • 45 to 59 minutes: 344
  • 60 to 89 minutes: 123
  • 90 or more minutes: 76
Means of transportation to work in 2022 - Los Altos

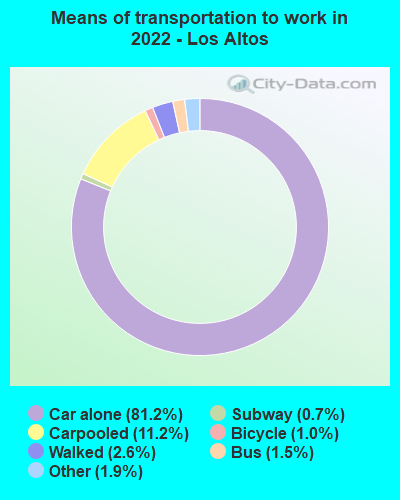
Means of transportation to work:

  • Drove a car alone: 7,991 (53.9%)
  • Carpooled: 1,136 (7.7%)
  • Bus: 104 (0.7%)
  • Long-distance train or commuter rail: 50 (0.3%)
  • Taxi: 206 (1.4%)
  • Bicycle: 109 (0.7%)
  • Walked: 256 (1.7%)
  • Worked at home: 5,656 (38.2%)
Class of Workers in 2022
  • Unemployment by race in 2022
  • Unemployment rate for White non-Hispanic residents
  • 3.4%Males
  • 4.7%Females
  • Unemployment rate for Asian residents
  • 1.0%Males
  • 3.7%Females
  • Unemployment rate for two or more race residents
  • 19.1%Males
  • Unemployment rate for Hispanic or Latino residents
  • 8.2%Males
  • 4.3%Females
Year of entry for the foreign-born population in Los Altos, California
  • Year of entry for the foreign-born population in Los Altos, California
  • 2,7222010 or later
  • 1,9452000 to 2009
  • 2,0011990 to 1999
  • 1,1531980 to 1989
  • 1,2421970 to 1979
  • 1,369Before 1970
Ancestries in Los Altos, CA

First ancestries reported:

  • English: 833 (4.5%)
  • European: 796 (4.3%)
  • German: 643 (3.5%)
  • Italian: 618 (3.4%)
  • Russian: 608 (3.3%)
  • American: 551 (3.0%)
  • Irish: 486 (2.7%)
  • French: 358 (2.0%)
  • Iranian: 330 (1.8%)
  • Polish: 279 (1.5%)
  • Scottish: 178 (1.0%)
  • Swedish: 140 (0.8%)
  • Dutch: 113 (0.6%)
  • Eastern European: 105 (0.6%)
  • Greek: 101 (0.6%)
  • Ukrainian: 94 (0.5%)
  • Northern European: 87 (0.5%)
  • Palestinian: 84 (0.5%)
  • Canadian: 78 (0.4%)
  • Norwegian: 67 (0.4%)
  • Swiss: 64 (0.3%)
  • Israeli: 58 (0.3%)
  • Turkish: 48 (0.3%)
  • Egyptian: 43 (0.2%)
  • Basque: 41 (0.2%)
  • Armenian: 39 (0.2%)
  • Brazilian: 38 (0.2%)
  • Portuguese: 30 (0.2%)
  • Latvian: 30 (0.2%)
  • Croatian: 29 (0.2%)
  • Austrian: 29 (0.2%)
  • Scandinavian: 28 (0.2%)
  • Romanian: 24 (0.1%)
  • British: 22 (0.1%)
  • Finnish: 19 (0.1%)
  • Scotch-Irish: 17 (0.09%)
  • Serbian: 17 (0.09%)
  • French Canadian: 17 (0.09%)
  • Danish: 12 (0.07%)
  • Lithuanian: 11 (0.06%)
  • Icelander: 11 (0.06%)
  • Slovak: 9 (0.05%)
  • Yugoslavian: 9 (0.05%)
  • Australian: 8 (0.04%)
  • Slavic: 8 (0.04%)
  • Czech: 7 (0.04%)
  • Lebanese: 7 (0.04%)
  • Belgian: 6 (0.03%)
  • Slovene: 5 (0.03%)
  • Nigerian: 4 (0.02%)
  • Hungarian: 3 (0.02%)
  • Jamaican: 1 (0.01%)

Most common places of birth for foreign-born residents (%):

India
Los Altos:

20.3% (2,117)
California:

5.2% (539,184)

China, excluding Hong Kong and Taiwan
Los Altos:

13.4% (1,395)
California:

6.6% (684,672)

Taiwan
Los Altos:

8.6% (901)
California:

1.7% (176,274)

Hong Kong
Los Altos:

5.7% (597)
California:

1.0% (105,215)

Korea
Los Altos:

5.6% (588)
California:

3.0% (315,248)

France
Los Altos:

4.5% (471)
California:

0.4% (40,224)

Canada
Los Altos:

4.5% (469)
California:

1.2% (127,477)

Russia
Los Altos:

4.4% (455)
California:

0.7% (71,932)

Iran
Los Altos:

2.9% (304)
California:

2.0% (206,004)

Israel
Los Altos:

2.5% (262)
California:

0.3% (33,029)

Japan
Los Altos:

2.3% (242)
California:

1.0% (103,575)

Germany
Los Altos:

2.2% (227)
California:

0.7% (73,304)

United Kingdom, excluding England and Scotland
Los Altos:

1.6% (169)
California:

0.6% (60,582)

Place of birth for U.S.-born residents:

  • This state: 12,433
  • Other state: 6,993
  • Northeast: 2,505
  • Midwest: 2,021
  • South: 1,205
  • West: 1,281

88.7% of Los Altos residents lived in the same house 1 years ago.
   Out of people who lived in different houses, 39.4% lived in this county.
   Out of people who lived in different counties, 51.5% lived in California.


Los Altos:

88.7%
State average:

88.9%

Education attainment for males 25 years and older:

  • No schooling: 5
  • Nursery to 4th grade: 0
  • 5th and 6th grade: 11
  • 7th and 8th grade: 0
  • 9th grade: 24
  • 10th grade: 39
  • 11th grade: 0
  • 12th grade, no diploma: 8
  • High school graduate (or equivalency): 250
  • Less than 1 year of college: 91
  • Some college more than 1 year, no degree: 415
  • Associate degree: 133
  • Bachelor's degree: 3,024
  • Master's degree: 3,831
  • Professional school degree: 1,237
  • Doctorate degree: 1,600
Educational Attainment for Males

Education attainment for females 25 years and older:

  • No schooling: 62
  • Nursery to 4th grade: 22
  • 5th and 6th grade: 0
  • 7th and 8th grade: 10
  • 9th grade: 9
  • 10th grade: 0
  • 11th grade: 0
  • 12th grade, no diploma: 48
  • High school graduate (or equivalency): 397
  • Less than 1 year of college: 199
  • Some college more than 1 year, no degree: 667
  • Associate degree: 339
  • Bachelor's degree: 3,701
  • Master's degree: 3,873
  • Professional school degree: 936
  • Doctorate degree: 795
Educational Attainment for Females
Los Altos marital status for males
Los Altos marital status for females

Housing units in structures:

  • One, detached: 9,618
  • One, attached: 669
  • Two: 44
  • 3 or 4: 160
  • 5 to 9: 211
  • 10 to 19: 218
  • 20 to 49: 407
  • 50 or more: 503
Housing units lacking complete plumbing facilities in 2022: 0.3%

Housing units lacking complete kitchen facilities in 2022: 0.8%

House/condo owner moved in on average 17 years ago

Renter moved in on average 2 years ago

Year householders moved into residence in Los Altos
Houses and condos Apartments
Most commonly used house heating fuel in houses and condos in Los Altos, CA
  • 81.9%Utility gas
  • 16.1%Electricity
  • 1.2%Solar energy
  • 0.7%Bottled, tank, or LP gas
Most commonly used house heating fuel in apartments in Los Altos, CA
  • 64.7%Utility gas
  • 34.4%Electricity
  • 0.5%Fuel oil, kerosene, etc.
  • 0.4%No fuel used

Private vs. public school enrollment:

Students in private schools in grades 1 to 8 (elementary and middle school): 839
Here:

24.1%
California:

10.5%

Students in private schools in grades 9 to 12 (high school): 442
Here:

21.4%
California:

8.5%

Students in private undergraduate colleges: 259
Here:

17.4%
California:

15.9%
School Enrollment by Level of School for Male Students
School Enrollment by Level of School for Female Students
Age and Sex of Sensory-Disabled Noninstitutionalized Residents
Age and Sex of Physically-Disabled Noninstitutionalized Residents
Age and Sex of Mentally-Disabled Noninstitutionalized Residents
Age and Sex of Self-Care Disabled Noninstitutionalized Residents
Age and Sex of Go-Outside-Home Disabled Noninstitutionalized Residents
Age and Sex of Noninstitutionalized Residents with Employment Disability