Jump to a detailed profile or search site with Google Custom Search

Los Gatos, CA (California) Houses and Residents

Estimated median house or condo value in 2022: $2,241,040 (it was $748,300 in 2000)
Los Gatos:

$2,241,040
California:

$715,900
Lower value quartile - upper value quartile: $1,561,877 - Over $2,000,001

Mean price in 2022:

Detached houses: $2,953,997
Here:

$2,953,997
State:

$988,808

Townhouses or other attached units: $1,364,807
Here:

$1,364,807
State:

$838,546

In 2-unit structures: $1,633,245
Here:

$1,633,245
State:

$1,138,100

In 3-to-4-unit structures: $1,045,686
Here:

$1,045,686
State:

$824,253

In 5-or-more-unit structures: $689,428
Here:

$689,428
State:

$730,996

Mobile homes: $214,265
Here:

$214,265
State:

$184,506

Total population: 30,735 (Urban population: 28,477, Rural population: 206 (all nonfarm))

Houses: 13,939 (13,018 occupied: 8,338 owner occupied, 4,637 renter occupied)

% of renters here:

36%
State:

44%

Housing density: 1,301 houses/condos per square mile

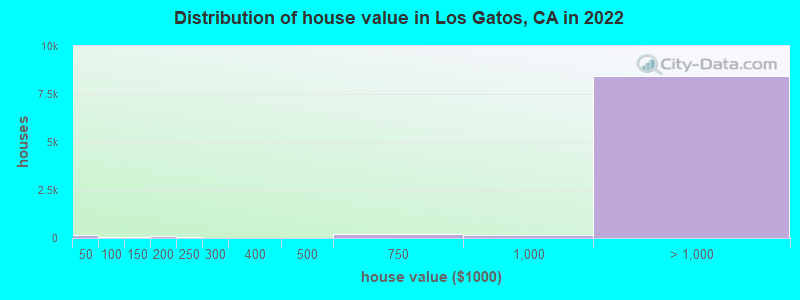
Median price asked for vacant for-sale houses and condos in 2022: $3,295,467.

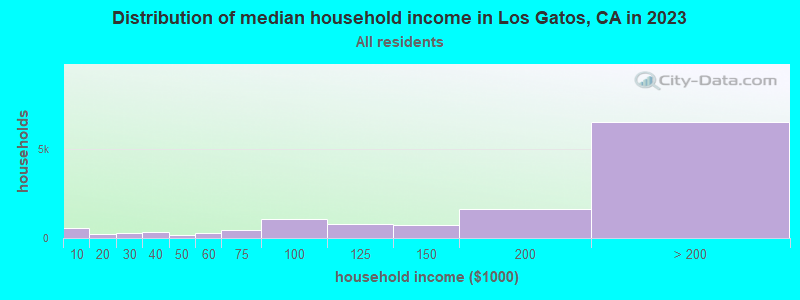
Median contract rent in 2022: over $2,000 (lower quartile is over $2,000, upper quartile is over $2,000)


Median rent asked for vacant for-rent units in 2022: $4,536


Median gross rent in Los Gatos, CA in 2022: over $2,000

Housing units in Los Gatos with a mortgage: 5,385 (716 second mortgage, 21 home equity loan, 645 both second mortgage and home equity loan)
Houses without a mortgage: 73

Median household income for houses/condos with a mortgage: $253,538

Median household income for apartments without a mortgage: $162,409

Median monthly housing costs: $3,300

Compare current foreclosures near Los Gatos, CA:

Check out more offers near Los Gatos, CA.
Powered by Foreclosure.com

Settings
X
Data:
Loading data...
Based on 2000-2022 data
Loading data...

123
Hide US histogram

Los Gatos, California Age and Sex of Residents
Median year house/condo built: 1970

Median year apartment built: 1973

Household type by relationship:

Households: 32,300
  • Male householders: 6,758 (1,282 living alone), Female householders: 5,789 (1,827 living alone)
  • 7,731 spouses (7,682 opposite-sex spouses), 570 unmarried partners, (564 opposite-sex unmarried partners), 9,365 children (9,051 natural, 106 adopted, 207 stepchildren), 290 grandchildren, 137 brothers or sisters, 301 parents, 0 foster children, 328 other relatives, 633 non-relatives
  • In group quarters: 393

Size of family households: 3,996 2-persons, 2,234 3-persons, 2,042 4-persons, 595 5-persons, 127 6-persons, 39 7-or-more-persons.

Size of nonfamily households: 3,424 1-person, 522 2-persons, 42 3-persons, 37 4-persons, 12 5-persons.

5,809 married couples with children.
958 single-parent households (461 men, 497 women).

69.3% of residents of Los Gatos speak English at home.
4.8% of residents speak Spanish at home (74% speak English very well, 22% speak English well, 4% speak English not well).
13.3% of residents speak other Indo-European language at home (82% speak English very well, 12% speak English well, 7% speak English not well).
11.2% of residents speak Asian or Pacific Island language at home (65% speak English very well, 24% speak English well, 8% speak English not well, 3% don't speak English at all).
1.5% of residents speak other language at home (95% speak English very well, 5% speak English well).

Foreign born population: 8,333 (25.8%)
(62.3% of them are naturalized citizens)

Median number of rooms in houses and condos:
Here:

6.6
State:

6.0

Median number of rooms in apartments
Here:

4.0
State:

3.9

Owner-occupied Renter-occupied
Bedrooms in owner-occupied houses and condos in Los Gatos, California
  • Bedrooms in owner-occupied houses and condos in Los Gatos, California
  • 60no bedroom
  • 1221 bedroom
  • 7512 bedrooms
  • 3,6763 bedrooms
  • 2,9504 bedrooms
  • 7805+ bedrooms
Bedrooms in renter-occupied apartments in Los Gatos, California
  • Bedrooms in renter-occupied apartments in Los Gatos, California
  • 544no bedroom
  • 1,0191 bedroom
  • 1,7952 bedrooms
  • 1,0423 bedrooms
  • 1844 bedrooms
  • 555+ bedrooms
Owner-occupied Renter-occupied
Cars and other vehicles available in Los Gatos in owner-occupied houses/condos
  • Cars and other vehicles available in Los Gatos in owner-occupied houses/condos
  • 131no vehicle
  • 1,6481 vehicle
  • 3,9692 vehicles
  • 1,7793 vehicles
  • 4894 vehicles
  • 3235+ vehicles
Cars and other vehicles available in Los Gatos in renter-occupied apartments
  • Cars and other vehicles available in Los Gatos in renter-occupied apartments
  • 379no vehicle
  • 1,9191 vehicle
  • 1,8132 vehicles
  • 4463 vehicles
  • 614 vehicles
  • 205+ vehicles
Owner-occupied Renter-occupied
Rooms in owner-occupied houses in Los Gatos, California
  • Rooms in owner-occupied houses in Los Gatos, California
  • 481 room
  • 112 rooms
  • 2483 rooms
  • 5504 rooms
  • 1,2145 rooms
  • 1,9416 rooms
  • 1,0857 rooms
  • 1,2778 rooms
  • 1,9639+ rooms
Rooms in renter-occupied apartments in Los Gatos, California
  • Rooms in renter-occupied apartments in Los Gatos, California
  • 4961 room
  • 2742 rooms
  • 8023 rooms
  • 1,2484 rooms
  • 9975 rooms
  • 3926 rooms
  • 2177 rooms
  • 1368 rooms
  • 769+ rooms
Year house built
Median 2022 house/condo value by year built
Median house/condo value by year householder moved into unit
Breakdown of mean house values by ages of householders
Owners and renters by unit type in Los Gatos, CA
  • Los Gatos, CA household income distribution

  • Distribution of median household income in Los Gatos, CA in 2022
  • 587Less than $10,000
  • 362$10,000 to $19,999
  • 390$20,000 to $29,999
  • 248$30,000 to $39,999
  • 191$40,000 to $49,999
  • 200$50,000 to $59,999
  • 655$60,000 to $74,999
  • 812$75,000 to $99,999
  • 832$100,000 to $124,999
  • 758$125,000 to $149,999
  • 1,539$150,000 to $199,999
  • 6,432$200,000 or more
  • Home value of owner - occupied houses in 2022 in Los Gatos, CA

  • Distribution of house value in Los Gatos, CA in 2022
  • 84Less than $10,000
  • 7$10,000 to $14,999
  • 14$15,000 to $19,999
  • 21$20,000 to $24,999
  • 18$25,000 to $29,999
  • 17$70,000 to $79,999
  • 23$80,000 to $89,999
  • 29$100,000 to $124,999
  • 63$150,000 to $174,999
  • 43$175,000 to $199,999
  • 43$200,000 to $249,999
  • 8$250,000 to $299,999
  • 10$300,000 to $399,999
  • 6$400,000 to $499,999
  • 202$500,000 to $749,999
  • 177$750,000 to $999,999
  • 1,076$1,000,000 to $1,499,999
  • 1,601$1,500,000 to $1,999,999
  • 5,752$2,000,000 or more
  • Rent paid by renters in 2022 in Los Gatos, CA

  • Distribution of rent paid by renters in Los Gatos, CA in 2022
  • 43Less than $100
  • 33$100 to $149
  • 6$250 to $299
  • 9$400 to $449
  • 18$450 to $499
  • 12$500 to $549
  • 19$600 to $649
  • 12$650 to $699
  • 61$700 to $749
  • 11$750 to $799
  • 86$800 to $899
  • 8$900 to $999
  • 150$1,000 to $1,249
  • 79$1,250 to $1,499
  • 509$1,500 to $1,999
  • 827$2,000 to $2,499
  • 1,000$2,500 to $2,999
  • 594$3,000 to $3,499
  • 1,062$3,500 or more
  • 119No cash rent
Time Leaving Home To Go To Work in 2022

Percentage of workers working in this county: 90.6%
Number of people working at home: 5,144 (34.1% of all workers)

Travel time (in minutes) to work in 2022

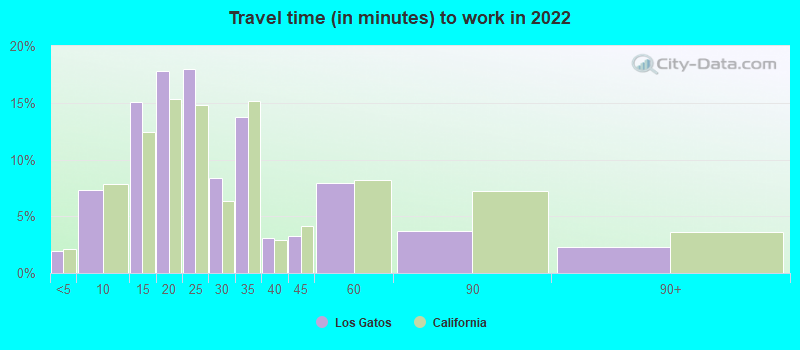
Travel time to work (commute)

  • Less than 5 minutes: 228
  • 5 to 9 minutes: 666
  • 10 to 14 minutes: 1,221
  • 15 to 19 minutes: 1,292
  • 20 to 24 minutes: 1,653
  • 25 to 29 minutes: 1,062
  • 30 to 34 minutes: 1,689
  • 35 to 39 minutes: 371
  • 40 to 44 minutes: 444
  • 45 to 59 minutes: 982
  • 60 to 89 minutes: 498
  • 90 or more minutes: 103
Means of transportation to work in 2022 - Los Gatos

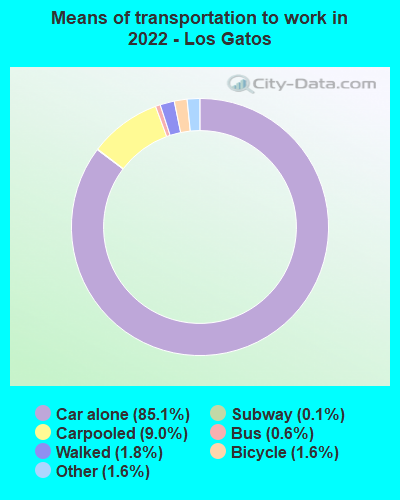
Means of transportation to work:

  • Drove a car alone: 14,824 (66.0%)
  • Carpooled: 1,622 (7.2%)
  • Bus: 69 (0.3%)
  • Long-distance train or commuter rail: 13 (0.1%)
  • Light rail, streetcar or trolley: 9 (0.0%)
  • Taxi: 318 (1.4%)
  • Bicycle: 318 (1.4%)
  • Walked: 326 (1.5%)
  • Worked at home: 5,144 (22.9%)
Class of Workers in 2022
  • Unemployment by race in 2022
  • Unemployment rate for White non-Hispanic residents
  • 4.6%Males
  • 5.5%Females
  • Unemployment rate for Asian residents
  • 1.9%Males
  • 4.5%Females
  • Unemployment rate for other race residents
  • 3.7%Females
  • Unemployment rate for two or more race residents
  • 1.3%Females
  • Unemployment rate for Hispanic or Latino residents
  • 2.4%Males
  • 5.0%Females
Year of entry for the foreign-born population in Los Gatos, California
  • Year of entry for the foreign-born population in Los Gatos, California
  • 2,6202010 or later
  • 2,4272000 to 2009
  • 1,3851990 to 1999
  • 9371980 to 1989
  • 8101970 to 1979
  • 1,014Before 1970
Ancestries in Los Gatos, CA

First ancestries reported:

  • European: 1,199 (6.8%)
  • English: 996 (5.7%)
  • Irish: 930 (5.3%)
  • German: 864 (4.9%)
  • Iranian: 840 (4.8%)
  • Italian: 672 (3.8%)
  • American: 563 (3.2%)
  • Russian: 405 (2.3%)
  • Greek: 383 (2.2%)
  • Ukrainian: 378 (2.1%)
  • Turkish: 252 (1.4%)
  • Polish: 250 (1.4%)
  • Scottish: 198 (1.1%)
  • Swedish: 183 (1.0%)
  • French: 163 (0.9%)
  • Eastern European: 159 (0.9%)
  • Hungarian: 154 (0.9%)
  • Northern European: 122 (0.7%)
  • Portuguese: 119 (0.7%)
  • Ethiopian: 115 (0.7%)
  • Armenian: 111 (0.6%)
  • Dutch: 108 (0.6%)
  • British: 93 (0.5%)
  • Danish: 67 (0.4%)
  • Canadian: 66 (0.4%)
  • Norwegian: 60 (0.3%)
  • Bulgarian: 59 (0.3%)
  • Croatian: 58 (0.3%)
  • Scotch-Irish: 56 (0.3%)
  • Israeli: 43 (0.2%)
  • Scandinavian: 38 (0.2%)
  • Welsh: 37 (0.2%)
  • Australian: 36 (0.2%)
  • Yugoslavian: 35 (0.2%)
  • Palestinian: 33 (0.2%)
  • Swiss: 33 (0.2%)
  • Czech: 31 (0.2%)
  • Lebanese: 28 (0.2%)
  • Lithuanian: 26 (0.1%)
  • French Canadian: 24 (0.1%)
  • African: 23 (0.1%)
  • Jordanian: 22 (0.1%)
  • Assyrian: 18 (0.1%)
  • Austrian: 18 (0.1%)
  • Brazilian: 16 (0.09%)
  • Celtic: 15 (0.09%)
  • Romanian: 15 (0.09%)
  • Iraqi: 14 (0.08%)
  • Serbian: 8 (0.05%)
  • Arab: 7 (0.04%)
  • Finnish: 7 (0.04%)
  • Belgian: 3 (0.02%)

Most common places of birth for foreign-born residents (%):

China, excluding Hong Kong and Taiwan
Los Gatos:

13.8% (1,146)
California:

6.6% (684,672)

India
Los Gatos:

10.9% (907)
California:

5.2% (539,184)

Iran
Los Gatos:

9.5% (790)
California:

2.0% (206,004)

Ukraine
Los Gatos:

5.7% (477)
California:

0.6% (60,761)

Japan
Los Gatos:

5.1% (422)
California:

1.0% (103,575)

Mexico
Los Gatos:

3.7% (311)
California:

37.2% (3,881,193)

Taiwan
Los Gatos:

3.7% (309)
California:

1.7% (176,274)

Russia
Los Gatos:

3.5% (292)
California:

0.7% (71,932)

Canada
Los Gatos:

3.2% (267)
California:

1.2% (127,477)

Hong Kong
Los Gatos:

3.2% (265)
California:

1.0% (105,215)

United Kingdom, excluding England and Scotland
Los Gatos:

2.3% (195)
California:

0.6% (60,582)

Greece
Los Gatos:

2.2% (183)
California:

0.1% (10,538)

Vietnam
Los Gatos:

2.1% (178)
California:

4.9% (512,335)

Germany
Los Gatos:

2.1% (171)
California:

0.7% (73,304)

Korea
Los Gatos:

2.0% (164)
California:

3.0% (315,248)

Sweden
Los Gatos:

1.9% (155)
California:

0.1% (12,221)

Place of birth for U.S.-born residents:

  • This state: 14,869
  • Other state: 8,208
  • Northeast: 2,972
  • Midwest: 2,022
  • South: 1,523
  • West: 1,764

85.2% of Los Gatos residents lived in the same house 1 years ago.
   Out of people who lived in different houses, 39.5% lived in this county.
   Out of people who lived in different counties, 51.8% lived in California.


Los Gatos:

85.2%
State average:

88.9%

Education attainment for males 25 years and older:

  • No schooling: 80
  • Nursery to 4th grade: 16
  • 5th and 6th grade: 0
  • 7th and 8th grade: 91
  • 9th grade: 0
  • 10th grade: 33
  • 11th grade: 16
  • 12th grade, no diploma: 24
  • High school graduate (or equivalency): 590
  • Less than 1 year of college: 258
  • Some college more than 1 year, no degree: 693
  • Associate degree: 410
  • Bachelor's degree: 4,296
  • Master's degree: 3,198
  • Professional school degree: 750
  • Doctorate degree: 941
Educational Attainment for Males

Education attainment for females 25 years and older:

  • No schooling: 10
  • Nursery to 4th grade: 27
  • 5th and 6th grade: 44
  • 7th and 8th grade: 111
  • 9th grade: 14
  • 10th grade: 25
  • 11th grade: 6
  • 12th grade, no diploma: 41
  • High school graduate (or equivalency): 773
  • Less than 1 year of college: 332
  • Some college more than 1 year, no degree: 1,217
  • Associate degree: 781
  • Bachelor's degree: 4,906
  • Master's degree: 2,980
  • Professional school degree: 588
  • Doctorate degree: 354
Educational Attainment for Females
Los Gatos marital status for males
Los Gatos marital status for females

Housing units in structures:

  • One, detached: 7,880
  • One, attached: 1,864
  • Two: 685
  • 3 or 4: 545
  • 5 to 9: 816
  • 10 to 19: 366
  • 20 to 49: 855
  • 50 or more: 871
  • Mobile homes: 52

Median worth of mobile homes: $234,774

Housing units lacking complete plumbing facilities in 2022: 1.0%

Housing units lacking complete kitchen facilities in 2022: 1.8%

House/condo owner moved in on average 14 years ago

Renter moved in on average 4 years ago

Year householders moved into residence in Los Gatos
Houses and condos Apartments
Most commonly used house heating fuel in houses and condos in Los Gatos, CA
  • 81.8%Utility gas
  • 14.9%Electricity
  • 1.9%Bottled, tank, or LP gas
  • 1.3%Solar energy
  • 0.1%Wood
Most commonly used house heating fuel in apartments in Los Gatos, CA
  • 56.8%Utility gas
  • 41.3%Electricity
  • 1.3%Bottled, tank, or LP gas
  • 0.4%No fuel used
  • 0.2%Other fuel

Private vs. public school enrollment:

Students in private schools in grades 1 to 8 (elementary and middle school): 530
Here:

15.8%
California:

10.5%

Students in private schools in grades 9 to 12 (high school): 486
Here:

23.1%
California:

8.5%

Students in private undergraduate colleges: 255
Here:

17.6%
California:

15.9%
School Enrollment by Level of School for Male Students
School Enrollment by Level of School for Female Students
Age and Sex of Sensory-Disabled Noninstitutionalized Residents
Age and Sex of Physically-Disabled Noninstitutionalized Residents
Age and Sex of Mentally-Disabled Noninstitutionalized Residents
Age and Sex of Self-Care Disabled Noninstitutionalized Residents
Age and Sex of Go-Outside-Home Disabled Noninstitutionalized Residents
Age and Sex of Noninstitutionalized Residents with Employment Disability