Los Lunas, NM (New Mexico) Houses and Residents
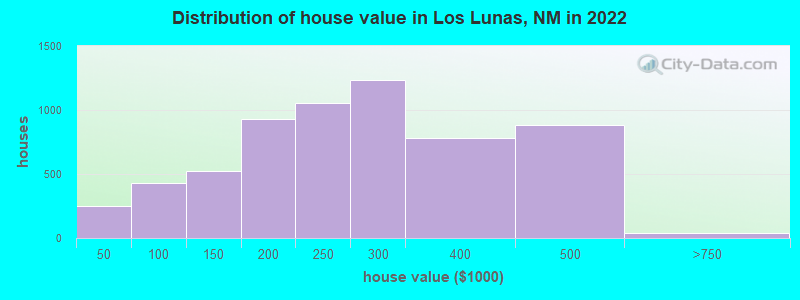
Estimated median house or condo value in 2022: $239,117 (it was $96,200 in 2000 )
Los Lunas:
$239,117New Mexico:
$243,100
Lower value quartile - upper value quartile: $155,578 - $308,434Mean price in 2022: Detached houses: $240,543 Here:
$240,543State:
$322,045
Townhouses or other attached units: $152,283 Here:
$152,283State:
$284,053
Mobile homes: $99,165 Here:
$99,165State:
$117,675
Total population: 15,206 (Urban population: 9,563 (all inside urban clusters), Rural population: 546 (all nonfarm) )
Houses: 7,023 (6,426 occupied: 5,477 owner occupied, 1,513 renter occupied )
% of renters here:
22%State:
29%
Housing density: 699 houses/condos per square mile
Median price asked for vacant for-sale houses and condos in 2022: $268,739.
Median contract rent in 2022: $911 (lower quartile is $552, upper quartile is $1,099)
Median rent asked for vacant for-rent units in 2022: $2,238
Median gross rent in Los Lunas, NM in 2022: $1,023
Housing units in Los Lunas with a mortgage: 4,239 (177 second mortgage, 0 home equity loan, 46 both second mortgage and home equity loan )Houses without a mortgage: 115
Median household income for houses/condos with a mortgage: $73,930
Median household income for apartments without a mortgage: $49,553
Median monthly housing costs: $1,126
Data:
Median house or condo value ($)
Median house or condo value ($ change since 2000)
Median house or condo value ($) - White
Median house or condo value ($) - Black or African American
Median house or condo value ($) - Asian
Median house or condo value ($) - Hispanic or Latino
Median house or condo value ($) - American Indian and Alaska Native
Median house or condo value ($) - Multirace
Median house or condo value ($) - Other Race
Median price asked for mobile homes ($)
Household density (households per square mile)
Mean house or condo value by units in structure - 1, detached ($)
Mean house or condo value by units in structure - 1, attached ($)
Mean house or condo value by units in structure - 2 ($)
Mean house or condo value by units in structure by units in structure - 3 or 4 ($)
Mean house or condo value by units in structure - 5 or more ($)
Mean house or condo value by units in structure - Boat, RV, van, etc. ($)
Mean house or condo value by units in structure - Mobile home ($)
Median contract rent ($)
Median contract rent - Lower quartile ($)
Median contract rent - Upper quartile ($)
Median gross rent ($)
Urban houses (%)
Rural houses (%)
Houses occupied (%)
Houses occupied (% change since 2000)
Houses owner occupied (%)
Houses owner occupied (% change since 2000)
Houses renter occupied (%)
Houses renter occupied (% change since 2000)
Vacant housing units - For rent (%)
Vacant housing units - For rent (% change since 2000)
Vacant housing units - For sale only (%)
Vacant housing units - For sale only (% change since 2000)
Vacant housing units - Rented or sold, not occupied (%)
Vacant housing units - Rented or sold, not occupied (% change since 2000)
Vacant housing units - For seasonal, recreational, or occasional use (%)
Vacant housing units - For seasonal, recreational, or occasional use (% change since 2000)
Vacant housing units - For migrant workers (%)
Vacant housing units - For migrant workers (% change since 2000)
Vacant housing units - Other vacant (%)
Vacant housing units - Other vacant (% change since 2000)
Median monthly housing costs ($)
Median household income for houses/condos with a mortgage ($)
Median household income for houses/condos without a mortgage ($)
Median household income ($)
Median household income ($) - White
Median household income ($) - Black or African American
Median household income ($) - Asian
Median household income ($) - Hispanic or Latino
Median household income ($) - American Indian and Alaska Native
Median household income ($) - Multirace
Median household income ($) - Other Race
Mortgage status - with mortgage (%)
Mortgage status - with second mortgage (%)
Mortgage status - with home equity loan (%)
Mortgage status - with both second mortgage and home equity loan (%)
Mortgage status - without a mortgage (%)
Median year house/condo built
Median year apartment built
Household type by relationship - Male householder living alone (%)
Household type by relationship - Male householder not living alone (%)
Household type by relationship - Female householder living alone (%)
Household type by relationship - Female householder not living alone (%)
Household type by relationship - Opposite-Sex spouse (%)
Household type by relationship - Same-Sex spouse (%)
Household type by relationship - Opposite-Sex unmarried partner (%)
Household type by relationship - Same-Sex unmarried partner (%)
Household type by relationship - In group quarters (%)
Size of family households - 2-person household (%)
Size of family households - 3-person household (%)
Size of family households - 4-person household (%)
Size of family households - 5-person household (%)
Size of family households - 6-person household (%)
Size of family households - 7-or-more-person household (%)
Size of nonfamily households - 1-person household (%)
Size of nonfamily households - 2-person household (%)
Size of nonfamily households - 3-person household (%)
Size of nonfamily households - 4-person household (%)
Size of nonfamily households - 5-person household (%)
Size of nonfamily households - 6-person household (%)
Size of nonfamily households - 7-or-moreperson household (%)
Year house built - Built 2010 or later (%)
Year house built - Built 2000 to 2009 (%)
Year house built - Built 1990 to 1999 (%)
Year house built - Built 1980 to 1989 (%)
Year house built - Built 1970 to 1979 (%)
Year house built - Built 1960 to 1969 (%)
Year house built - Built 1950 to 1959 (%)
Year house built - Built 1940 to 1949 (%)
Year house built - Built 1939 or earlier (%)
Median number of rooms in houses and condos
Median number of rooms in apartments
Median number of bedrooms in owner occupied houses
Mean number of bedrooms in owner occupied houses
Median number of bedrooms in renter occupied houses
Mean number of bedrooms in renter occupied houses
Median number of vehichles in owner occupied houses
Mean number of vehichles in owner occupied houses
Median number of vehichles in renter occupied houses
Mean number of vehichles in renter occupied houses
Rooms in owner-occupied houses - 1 room (%)
Rooms in owner-occupied houses - 2 rooms (%)
Rooms in owner-occupied houses - 3 rooms (%)
Rooms in owner-occupied houses - 4 rooms (%)
Rooms in owner-occupied houses - 5 rooms (%)
Rooms in owner-occupied houses - 6 rooms (%)
Rooms in owner-occupied houses - 7 rooms (%)
Rooms in owner-occupied houses - 8 rooms (%)
Rooms in owner-occupied houses - 9+ rooms (%)
Rooms in renter-occupied houses - 1 room (%)
Rooms in renter-occupied houses - 2 rooms (%)
Rooms in renter-occupied houses - 3 rooms (%)
Rooms in renter-occupied houses - 4 rooms (%)
Rooms in renter-occupied houses - 5 rooms (%)
Rooms in renter-occupied houses - 6 rooms (%)
Rooms in renter-occupied houses - 7 rooms (%)
Rooms in renter-occupied houses - 8 rooms (%)
Rooms in renter-occupied houses - 9+ rooms (%)
Bedrooms in owner-occupied houses - no bedrooms (%)
Bedrooms in owner-occupied houses - 1 bedroom (%)
Bedrooms in owner-occupied houses - 2 bedrooms (%)
Bedrooms in owner-occupied houses - 3 bedrooms (%)
Bedrooms in owner-occupied houses - 4 bedrooms (%)
Bedrooms in owner-occupied houses - 5+ bedrooms (%)
Bedrooms in renter-occupied houses - no bedrooms (%)
Bedrooms in renter-occupied houses - 1 bedroom (%)
Bedrooms in renter-occupied houses - 2 bedrooms (%)
Bedrooms in renter-occupied houses - 3 bedrooms (%)
Bedrooms in renter-occupied houses - 4 bedrooms (%)
Bedrooms in renter-occupied houses - 5+ bedrooms (%)
Vehicles available in owner-occupied houses - no vehicle available (%)
Vehicles available in owner-occupied houses - 1 vehicle available(%)
Vehicles available in owner-occupied houses - 2 Vehicles available (%)
Vehicles available in owner-occupied houses - 3 Vehicles available (%)
Vehicles available in owner-occupied houses - 4 Vehicles available (%)
Vehicles available in owner-occupied houses - 5+ Vehicles available (%)
Vehicles available in renter-occupied houses - no vehicle available (%)
Vehicles available in renter-occupied houses - 1 vehicle available (%)
Vehicles available in renter-occupied houses - 2 Vehicles available (%)
Vehicles available in renter-occupied houses - 3 Vehicles available (%)
Vehicles available in renter-occupied houses - 4 Vehicles available (%)
Vehicles available in renter-occupied houses - 5+ Vehicles available (%)
Housing units in structures - 1, detached (%)
Housing units in structures - 1, attached (%)
Housing units in structures - 2 (%)
Housing units in structures - 3 or 4 (%)
Housing units in structures - 5 to 9 (%)
Housing units in structures - 10 to 19 (%)
Housing units in structures - 20 to 49 (%)
Housing units in structures - 50 or more (%)
Housing units in structures - Mobile home (%)
Housing units in structures - Boat, RV, van, etc. (%)
Housing units in structures - Owners - 1, detached (%)
Housing units in structures - Owners - 1, attached (%)
Housing units in structures - Owners - 2 (%)
Housing units in structures - Owners - 3 or 4 (%)
Housing units in structures - Owners - 5 to 9 (%)
Housing units in structures - Owners - 10 to 19 (%)
Housing units in structures - Owners - 20 to 49 (%)
Housing units in structures - Owners - 50 or more (%)
Housing units in structures - Owners - Mobile home (%)
Housing units in structures - Owners - Boat, RV, van, etc. (%)
Housing units in structures - Renters - 1, detached (%)
Housing units in structures - Renters - 1, attached (%)
Housing units in structures - Renters - 2 (%)
Housing units in structures - Renters - 3 or 4 (%)
Housing units in structures - Renters - 5 to 9 (%)
Housing units in structures - Renters - 10 to 19 (%)
Housing units in structures - Renters - 20 to 49 (%)
Housing units in structures - Renters - 50 or more (%)
Housing units in structures - Renters - Mobile home (%)
Housing units in structures - Renters - Boat, RV, van, etc. (%)
House/condo owner moved in on average (years ago)
Renter moved in on average (years ago)
Year householder moved into unit - Moved in 1999 to March 2000 (%)
Year householder moved into unit - Moved in 1999 to March 2000 (%) - White
Year householder moved into unit - Moved in 1999 to March 2000 (%) - Black or African American
Year householder moved into unit - Moved in 1999 to March 2000 (%) - Asian
Year householder moved into unit - Moved in 1999 to March 2000 (%) - Hispanic or Latino
Year householder moved into unit - Moved in 1999 to March 2000 (%) - American Indian and Alaska Native
Year householder moved into unit - Moved in 1999 to March 2000 (%) - Multirace
Year householder moved into unit - Moved in 1999 to March 2000 (%) - Other Race
Year householder moved into unit - Moved in 1995 to 1998 (%)
Year householder moved into unit - Moved in 1995 to 1998 (%) - White
Year householder moved into unit - Moved in 1995 to 1998 (%) - Black or African American
Year householder moved into unit - Moved in 1995 to 1998 (%) - Asian
Year householder moved into unit - Moved in 1995 to 1998 (%) - Hispanic or Latino
Year householder moved into unit - Moved in 1995 to 1998 (%) - American Indian and Alaska Native
Year householder moved into unit - Moved in 1995 to 1998 (%) - Multirace
Year householder moved into unit - Moved in 1995 to 1998 (%) - Other Race
Year householder moved into unit - Moved in 1990 to 1994 (%)
Year householder moved into unit - Moved in 1990 to 1994 (%) - White
Year householder moved into unit - Moved in 1990 to 1994 (%) - Black or African American
Year householder moved into unit - Moved in 1990 to 1994 (%) - Asian
Year householder moved into unit - Moved in 1990 to 1994 (%) - Hispanic or Latino
Year householder moved into unit - Moved in 1990 to 1994 (%) - American Indian and Alaska Native
Year householder moved into unit - Moved in 1990 to 1994 (%) - Multirace
Year householder moved into unit - Moved in 1990 to 1994 (%) - Other Race
Year householder moved into unit - Moved in 1980 to 1989 (%)
Year householder moved into unit - Moved in 1980 to 1989 (%) - White
Year householder moved into unit - Moved in 1980 to 1989 (%) - Black or African American
Year householder moved into unit - Moved in 1980 to 1989 (%) - Asian
Year householder moved into unit - Moved in 1980 to 1989 (%) - Hispanic or Latino
Year householder moved into unit - Moved in 1980 to 1989 (%) - American Indian and Alaska Native
Year householder moved into unit - Moved in 1980 to 1989 (%) - Multirace
Year householder moved into unit - Moved in 1980 to 1989 (%) - Other Race
Year householder moved into unit - Moved in 1970 to 1979 (%)
Year householder moved into unit - Moved in 1970 to 1979 (%) - White
Year householder moved into unit - Moved in 1970 to 1979 (%) - Black or African American
Year householder moved into unit - Moved in 1970 to 1979 (%) - Asian
Year householder moved into unit - Moved in 1970 to 1979 (%) - Hispanic or Latino
Year householder moved into unit - Moved in 1970 to 1979 (%) - American Indian and Alaska Native
Year householder moved into unit - Moved in 1970 to 1979 (%) - Multirace
Year householder moved into unit - Moved in 1970 to 1979 (%) - Other Race
Year householder moved into unit - Moved in 1969 or earlier (%)
Year householder moved into unit - Moved in 1969 or earlier (%) - White
Year householder moved into unit - Moved in 1969 or earlier (%) - Black or African American
Year householder moved into unit - Moved in 1969 or earlier (%) - Asian
Year householder moved into unit - Moved in 1969 or earlier (%) - Hispanic or Latino
Year householder moved into unit - Moved in 1969 or earlier (%) - American Indian and Alaska Native
Year householder moved into unit - Moved in 1969 or earlier (%) - Multirace
Year householder moved into unit - Moved in 1969 or earlier (%) - Other Race
Housing units lacking complete plumbing facilities (%)
Housing units lacking complete kitchen facilities (%)
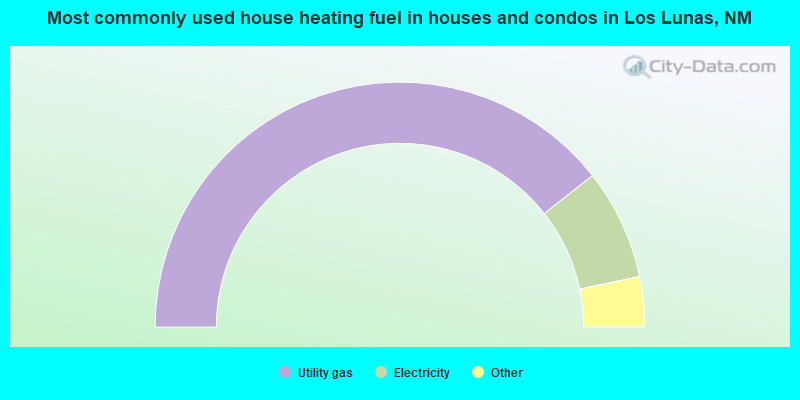
House heating fuel used in houses and condos - Utility gas (%)
House heating fuel used in houses and condos - Bottled, tank, or LP gas (%)
House heating fuel used in houses and condos - Electricity (%)
House heating fuel used in houses and condos - Fuel oil, kerosene, etc. (%)
House heating fuel used in houses and condos - Coal or coke (%)
House heating fuel used in houses and condos - Wood (%)
House heating fuel used in houses and condos - Solar energy (%)
House heating fuel used in houses and condos - Other fuel (%)
House heating fuel used in houses and condos - No fuel used (%)
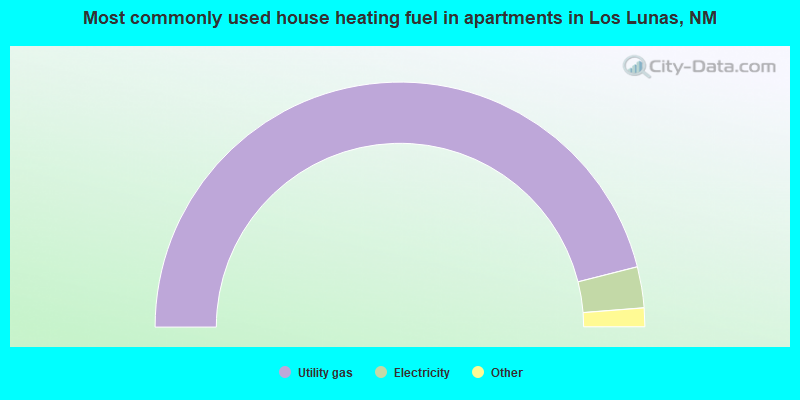
House heating fuel used in apartments - Utility gas (%)
House heating fuel used in apartments - Bottled, tank, or LP gas (%)
House heating fuel used in apartments - Electricity (%)
House heating fuel used in apartments - Fuel oil, kerosene, etc. (%)
House heating fuel used in apartments - Coal or coke (%)
House heating fuel used in apartments - Wood (%)
House heating fuel used in apartments - Solar energy (%)
House heating fuel used in apartments - Other fuel (%)
House heating fuel used in apartments - No fuel used (%)
Median year house/condo built: 1998Median year apartment built: 1983Household type by relationship:
Households: 17,786
Male householders: 3,080 (874 living alone ), Female householders: 3,356 (1,347 living alone )2,768 spouses (2,733 opposite-sex spouses ), 433 unmarried partners , (433 opposite-sex unmarried partners ), 5,771 children (5,113 natural , 133 adopted , 524 stepchildren ), 668 grandchildren , 286 brothers or sisters , 229 parents , 0 foster children , 340 other relatives , 632 non-relatives In group quarters: 219
Size of family households: 2,066 2-persons , 693 3-persons , 1,070 4-persons , 525 5-persons , 142 6-persons , 57 7-or-more-persons .
Size of nonfamily households: 2,316 1-person , 226 2-persons .
2,053 married couples with children. single-parent households (394 men , 1,550 women ).
79.2% of residents of Los Lunas speak English at home. of residents speak Spanish at home (75% speak English very well , 17% speak English well , 7% speak English not well ).of residents speak other Indo-European language at home (33% speak English very well , 57% speak English well , 10% speak English not well ).of residents speak Asian or Pacific Island language at home (60% speak English very well , 1% speak English well , 10% speak English not well , 29% don't speak English at all ).of residents speak other language at home (61% speak English very well , 39% speak English well ).
Foreign born population: 1,012 (5.7%)of them are naturalized citizens )
Median number of rooms in houses and condos:
Median number of rooms in apartments
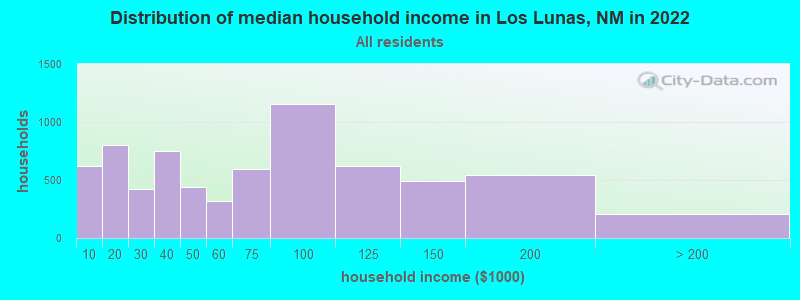
Los Lunas, NM household income distribution 619 Less than $10,000801 $10,000 to $19,999420 $20,000 to $29,999752 $30,000 to $39,999441 $40,000 to $49,999315 $50,000 to $59,999593 $60,000 to $74,9991,152 $75,000 to $99,999625 $100,000 to $124,999491 $125,000 to $149,999542 $150,000 to $199,999203 $200,000 or more
Home value of owner - occupied houses in 2022 in Los Lunas, NM 84 Less than $10,00020 $10,000 to $14,99914 $15,000 to $19,99940 $20,000 to $24,99913 $30,000 to $34,99917 $35,000 to $39,99958 $40,000 to $49,99922 $50,000 to $59,99991 $60,000 to $69,99918 $70,000 to $79,999143 $80,000 to $89,99993 $90,000 to $99,999357 $100,000 to $124,999165 $125,000 to $149,999579 $150,000 to $174,999352 $175,000 to $199,9991,053 $200,000 to $249,9991,236 $250,000 to $299,999784 $300,000 to $399,999882 $400,000 to $499,99931 $500,000 to $749,9998 $750,000 to $999,999Rent paid by renters in 2022 in Los Lunas, NM 25 Less than $10096 $150 to $19945 $200 to $2497 $400 to $44958 $450 to $49962 $550 to $599133 $600 to $64912 $650 to $69923 $700 to $74953 $750 to $79940 $800 to $89992 $900 to $999235 $1,000 to $1,249173 $1,250 to $1,49947 $1,500 to $1,999136 No cash rent
Percentage of workers working in this county: 53.3%Number of people working at home: 422 (6.2% of all workers )
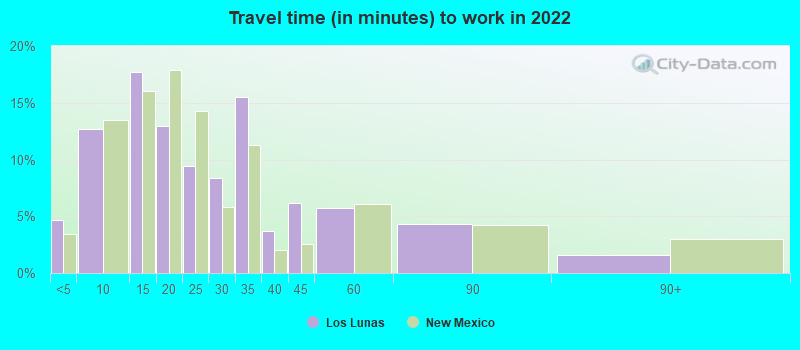
Travel time to work (commute)
Less than 5 minutes: 2695 to 9 minutes: 96310 to 14 minutes: 1,29115 to 19 minutes: 42620 to 24 minutes: 51925 to 29 minutes: 28330 to 34 minutes: 1,54135 to 39 minutes: 51940 to 44 minutes: 80345 to 59 minutes: 45660 to 89 minutes: 14290 or more minutes: 308
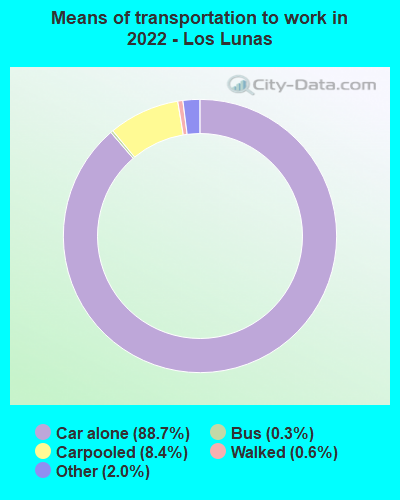
Means of transportation to work:
Drove a car alone: 8,281 (82.4%)Carpooled: 847 (8.4%)Bus : 27 (0.3%)Taxi: 204 (2.0%)Walked: 67 (0.7%)Worked at home: 422 (4.2%)
Unemployment by race in 2022
Unemployment rate for White non-Hispanic residents 1.6% Males1.3% FemalesUnemployment rate for American Indian and Alaska Native residents 57.5% MalesUnemployment rate for other race residents 8.0% MalesUnemployment rate for two or more race residents 1.6% Males4.1% FemalesUnemployment rate for Hispanic or Latino residents 4.7% Males2.9% Females
Year of entry for the foreign-born population in Los Lunas, New Mexico
473 2010 or later 183 2000 to 2009 47 1990 to 1999 49 1980 to 1989 81 1970 to 1979 44 Before 1970
First ancestries reported:
English: 349 (3.7%)
American: 307 (3.3%)
Irish: 254 (2.7%)
German: 251 (2.7%)
African: 148 (1.6%)
Scotch-Irish: 123 (1.3%)
Italian: 114 (1.2%)
Polish: 100 (1.1%)
European: 84 (0.9%)
Scottish: 71 (0.8%)
French Canadian: 55 (0.6%)
Afghan: 48 (0.5%)
Norwegian: 42 (0.5%)
Iranian: 32 (0.3%)
Greek: 21 (0.2%)
Celtic: 20 (0.2%)
Eastern European: 19 (0.2%)
Swedish: 18 (0.2%)
Welsh: 16 (0.2%)
Dutch: 11 (0.1%)
French: 8 (0.09%)
Canadian: 6 (0.06%)
Austrian: 5 (0.05%) Most common places of birth for foreign-born residents (%): Mexico Los Lunas:
50.2% (413)New Mexico:
66.5% (129,316)
Africa, n.e.c. Los Lunas:
16.9% (139)New Mexico:
0.1% (252)
Afghanistan Los Lunas:
6.7% (55)New Mexico:
0.2% (387)
Australia Los Lunas:
5.0% (41)New Mexico:
0.2% (360)
Iran Los Lunas:
3.9% (32)New Mexico:
0.5% (970)
Philippines Los Lunas:
3.8% (31)New Mexico:
3.2% (6,181)
Venezuela Los Lunas:
3.6% (30)New Mexico:
0.3% (561)
China, excluding Hong Kong and Taiwan Los Lunas:
2.7% (22)New Mexico:
1.6% (3,140)
Place of birth for U.S.-born residents:
This state: 11,767Other state: 4,573Northeast: 391Midwest: 989South: 1,469West: 1,731 90.3% of Los Lunas residents lived in the same house 1 years ago.
Out of people who lived in different houses, 14.8% lived in this county.
Out of people who lived in different counties, 55.0% lived in New Mexico.
Los Lunas:
90.3%State average:
88.2%
Education attainment for males 25 years and older:
No schooling: 172Nursery to 4th grade: 05th and 6th grade: 537th and 8th grade: 339th grade: 2210th grade: 3311th grade: 26412th grade, no diploma: 148High school graduate (or equivalency): 1,440Less than 1 year of college: 431Some college more than 1 year, no degree: 901Associate degree: 636Bachelor's degree: 750Master's degree: 306Professional school degree: 395Doctorate degree: 97
Education attainment for females 25 years and older:
No schooling: 93Nursery to 4th grade: 05th and 6th grade: 87th and 8th grade: 139th grade: 4210th grade: 4411th grade: 3012th grade, no diploma: 264High school graduate (or equivalency): 1,651Less than 1 year of college: 616Some college more than 1 year, no degree: 739Associate degree: 886Bachelor's degree: 1,063Master's degree: 489Professional school degree: 34Doctorate degree: 38
Housing units in structures:
One, detached: 5,280One, attached: 215Two: 463 or 4: 1065 to 9: 1910 to 19: 16320 to 49: 10650 or more: 42Mobile homes: 1,021Median worth of mobile homes: $91,030
Housing units lacking complete plumbing facilities in 2022: 1.4%Housing units lacking complete kitchen facilities in 2022: 0.4%House/condo owner moved in on average 8 years ago
Renter moved in on average 2 years ago
Private vs. public school enrollment:
Students in private schools in grades 1 to 8 (elementary and middle school): 406 Here:
18.6%New Mexico:
10.2%
Students in private schools in grades 9 to 12 (high school): 219 Here:
19.4%New Mexico:
10.0%
Students in private undergraduate colleges: 68 Here:
9.3%New Mexico:
12.3%