Housing density: 999 houses/condos per square mile
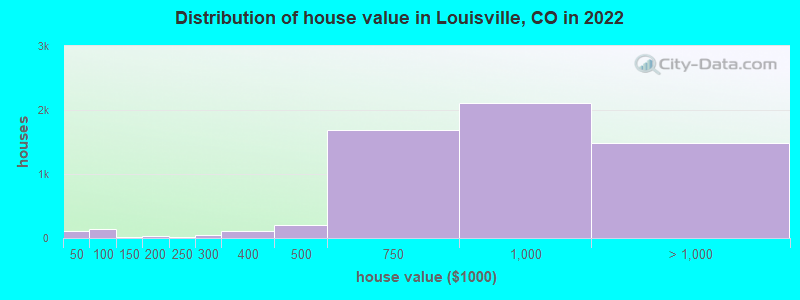
Median price asked for vacant for-sale houses and condos in 2022 in this county: $1,069,117.
Median contract rent in 2022: $1,836 (lower quartile is $1,512, upper quartile is over $2,000)
Median rent asked for vacant for-rent units in 2022: $3,421
Median gross rent in Louisville, CO in 2022: $1,947
Housing units in Louisville with a mortgage: 4,061 (517 second mortgage, 6 home equity loan, 522 both second mortgage and home equity loan) Houses without a mortgage: 146
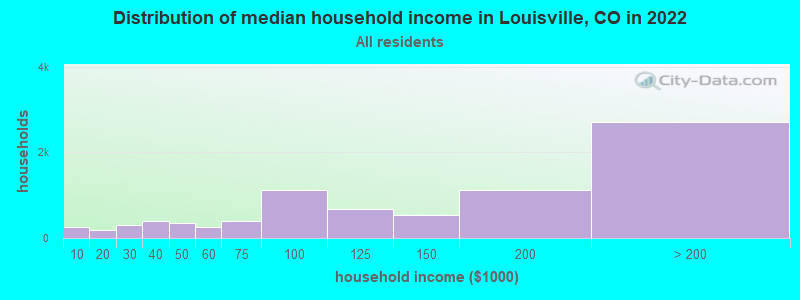
Median household income for houses/condos with a mortgage: $204,889
Median household income for apartments without a mortgage: $90,458
3,877 married couples with children.
929 single-parent households (385 men, 544 women).
90.5% of residents of Louisville speak English at home.
3.6% of residents speak Spanish at home (83% speak English very well, 9% speak English well, 8% speak English not well).
3.8% of residents speak other Indo-European language at home (94% speak English very well, 1% speak English well, 4% speak English not well).
1.9% of residents speak Asian or Pacific Island language at home (47% speak English very well, 47% speak English well, 6% speak English not well).
0.1% of residents speak other language at home (100% speak English very well).
Foreign born population: 1,539 (7.4%)
(70.7% of them are naturalized citizens)
Percentage of workers working in this county: 83.9% Number of people working at home: 4,499 (39.7% of all workers)
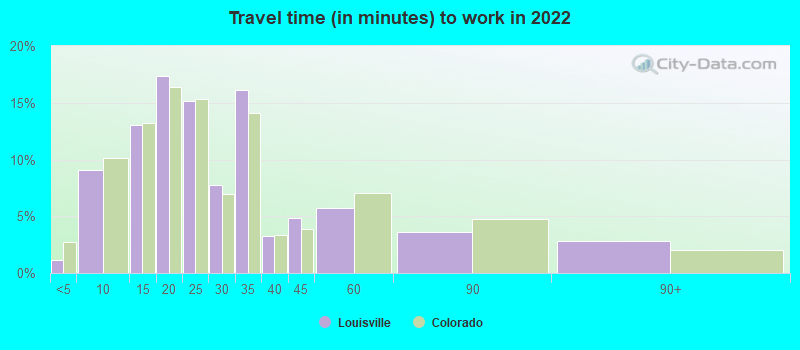
Travel time to work (commute)
Less than 5 minutes: 122
5 to 9 minutes: 807
10 to 14 minutes: 1,287
15 to 19 minutes: 1,204
20 to 24 minutes: 1,397
25 to 29 minutes: 391
30 to 34 minutes: 797
35 to 39 minutes: 170
40 to 44 minutes: 203
45 to 59 minutes: 327
60 to 89 minutes: 281
90 or more minutes: 114
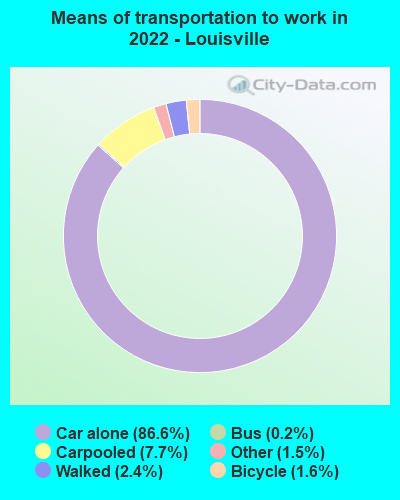
Means of transportation to work:
Drove a car alone: 13,461 (65.1%)
Carpooled: 1,362 (6.6%)
Bus: 36 (0.2%)
Taxi: 347 (1.7%)
Bicycle: 292 (1.4%)
Walked: 415 (2.0%)
Worked at home: 4,499 (21.8%)
Unemployment by race in 2022
Unemployment rate for White non-Hispanic residents
1.7%Males
2.9%Females
Unemployment rate for other race residents
27.9%Females
Unemployment rate for two or more race residents
1.1%Females
Unemployment rate for Hispanic or Latino residents
1.3%Females
Year of entry for the foreign-born population in Louisville, Colorado
3962010 or later
2072000 to 2009
4931990 to 1999
2201980 to 1989
2181970 to 1979
181Before 1970
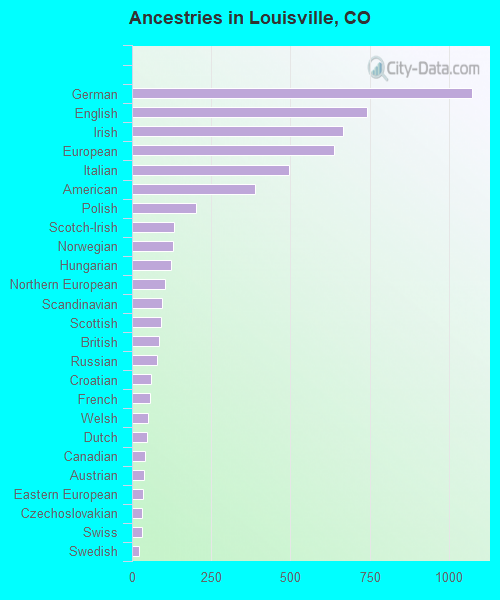
First ancestries reported:
German: 1,073 (14.4%)
English: 741 (9.9%)
Irish: 665 (8.9%)
European: 639 (8.6%)
Italian: 495 (6.6%)
American: 388 (5.2%)
Polish: 202 (2.7%)
Scotch-Irish: 131 (1.8%)
Norwegian: 130 (1.7%)
Hungarian: 123 (1.7%)
Northern European: 103 (1.4%)
Scandinavian: 94 (1.3%)
Scottish: 90 (1.2%)
British: 86 (1.2%)
Russian: 79 (1.1%)
Croatian: 60 (0.8%)
French: 56 (0.8%)
Welsh: 51 (0.7%)
Dutch: 47 (0.6%)
Canadian: 41 (0.6%)
Austrian: 39 (0.5%)
Eastern European: 35 (0.5%)
Czechoslovakian: 30 (0.4%)
Swiss: 30 (0.4%)
Swedish: 23 (0.3%)
Greek: 22 (0.3%)
Danish: 20 (0.3%)
Lithuanian: 18 (0.2%)
Czech: 18 (0.2%)
Slovak: 16 (0.2%)
South African: 13 (0.2%)
Romanian: 12 (0.2%)
Ukrainian: 12 (0.2%)
Finnish: 9 (0.1%)
Pennsylvania German: 9 (0.1%)
Basque: 8 (0.1%)
Brazilian: 7 (0.09%)
Iranian: 7 (0.09%)
Macedonian: 1 (0.01%)
Most common places of birth for foreign-born residents (%):
Mexico
Louisville:
7.9% (126)
Colorado:
38.3% (209,491)
Canada
Louisville:
7.2% (115)
Colorado:
2.7% (15,026)
India
Louisville:
7.1% (114)
Colorado:
4.0% (21,689)
Korea
Louisville:
5.7% (91)
Colorado:
2.9% (15,981)
Australia
Louisville:
5.6% (90)
Colorado:
0.6% (3,144)
China, excluding Hong Kong and Taiwan
Louisville:
5.6% (89)
Colorado:
3.3% (17,998)
Germany
Louisville:
5.3% (84)
Colorado:
2.5% (13,706)
Brazil
Louisville:
4.7% (75)
Colorado:
1.0% (5,365)
Japan
Louisville:
4.3% (68)
Colorado:
0.7% (4,075)
Poland
Louisville:
3.9% (63)
Colorado:
0.9% (4,772)
Vietnam
Louisville:
3.8% (61)
Colorado:
3.0% (16,616)
Austria
Louisville:
3.8% (60)
Colorado:
0.2% (823)
Argentina
Louisville:
2.9% (46)
Colorado:
0.6% (3,016)
Peru
Louisville:
2.8% (45)
Colorado:
0.9% (4,810)
Russia
Louisville:
2.4% (39)
Colorado:
1.4% (7,860)
England
Louisville:
2.2% (35)
Colorado:
1.2% (6,672)
Czechoslovakia (includes Czech Republic and Slovakia)
Louisville:
2.1% (33)
Colorado:
0.3% (1,849)
Cambodia
Louisville:
1.9% (30)
Colorado:
0.4% (1,936)
Other South America
Louisville:
1.8% (29)
Colorado:
0.1% (488)
Switzerland
Louisville:
1.6% (25)
Colorado:
0.2% (1,359)
Place of birth for U.S.-born residents:
This state: 7,062
Other state: 11,703
Northeast: 2,698
Midwest: 4,019
South: 2,214
West: 2,746
88.0% of Louisville residents lived in the same house 1 years ago. Out of people who lived in different houses, 26.5% lived in this county. Out of people who lived in different counties, 41.7% lived in Colorado.
Louisville:
88.0%
State average:
83.6%
Education attainment for males 25 years and older:
No schooling: 24
Nursery to 4th grade: 0
5th and 6th grade: 0
7th and 8th grade: 8
9th grade: 0
10th grade: 0
11th grade: 9
12th grade, no diploma: 50
High school graduate (or equivalency): 620
Less than 1 year of college: 338
Some college more than 1 year, no degree: 973
Associate degree: 287
Bachelor's degree: 2,471
Master's degree: 1,197
Professional school degree: 498
Doctorate degree: 573
Education attainment for females 25 years and older:
No schooling: 55
Nursery to 4th grade: 0
5th and 6th grade: 0
7th and 8th grade: 4
9th grade: 4
10th grade: 0
11th grade: 3
12th grade, no diploma: 50
High school graduate (or equivalency): 1,009
Less than 1 year of college: 323
Some college more than 1 year, no degree: 842
Associate degree: 416
Bachelor's degree: 2,424
Master's degree: 1,681
Professional school degree: 204
Doctorate degree: 341
Housing units in structures:
One, detached: 5,667
One, attached: 655
Two: 174
3 or 4: 61
5 to 9: 256
10 to 19: 482
20 to 49: 532
50 or more: 520
Mobile homes: 144
Boats, RVs, vans, etc.: 12
Housing units lacking complete plumbing facilities in 2022: 0.7%
Housing units lacking complete kitchen facilities in 2022: 2.4%