Housing density: 1,369 houses/condos per square mile
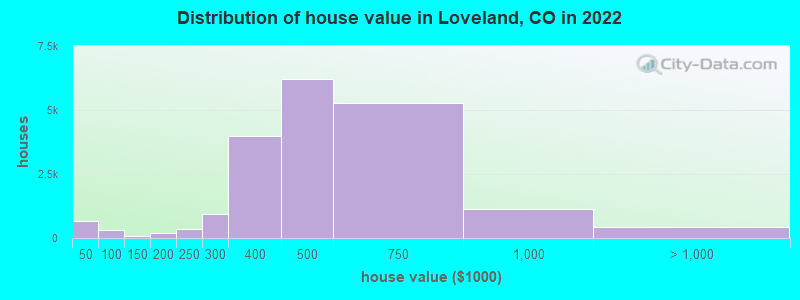
Median price asked for vacant for-sale houses and condos in 2022: $751,876.
Median contract rent in 2022: $1,476 (lower quartile is $1,158, upper quartile is $1,848)
Median rent asked for vacant for-rent units in 2022: $1,156
Median gross rent in Loveland, CO in 2022: $1,643
Housing units in Loveland with a mortgage: 14,567 (995 second mortgage, 0 home equity loan, 676 both second mortgage and home equity loan) Houses without a mortgage: 301
Median household income for houses/condos with a mortgage: $96,543
Median household income for apartments without a mortgage: $64,284
9,007 married couples with children.
3,675 single-parent households (753 men, 2,922 women).
93.5% of residents of Loveland speak English at home.
5.1% of residents speak Spanish at home (69% speak English very well, 14% speak English well, 15% speak English not well, 2% don't speak English at all).
1.2% of residents speak other Indo-European language at home (63% speak English very well, 20% speak English well, 17% speak English not well).
0.5% of residents speak Asian or Pacific Island language at home (53% speak English very well, 15% speak English well, 29% speak English not well, 3% don't speak English at all).
0.1% of residents speak other language at home (82% speak English very well, 18% speak English not well).
Foreign born population: 3,158 (4.1%)
(42.9% of them are naturalized citizens)
Percentage of workers working in this county: 80.0% Number of people working at home: 6,694 (17.1% of all workers)
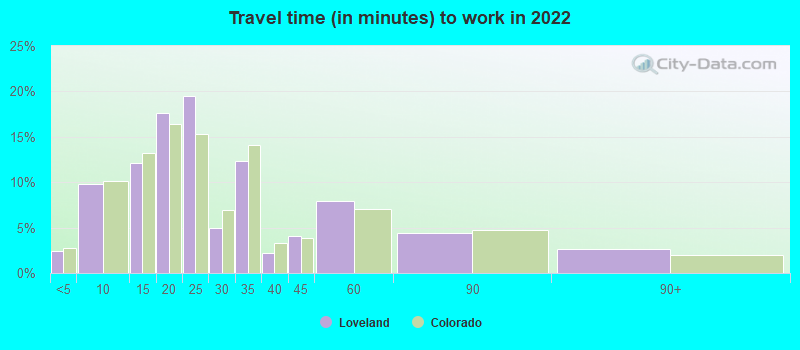
Travel time to work (commute)
Less than 5 minutes: 622
5 to 9 minutes: 3,330
10 to 14 minutes: 4,133
15 to 19 minutes: 4,448
20 to 24 minutes: 6,151
25 to 29 minutes: 2,965
30 to 34 minutes: 4,876
35 to 39 minutes: 1,069
40 to 44 minutes: 1,389
45 to 59 minutes: 3,355
60 to 89 minutes: 1,216
90 or more minutes: 1,113
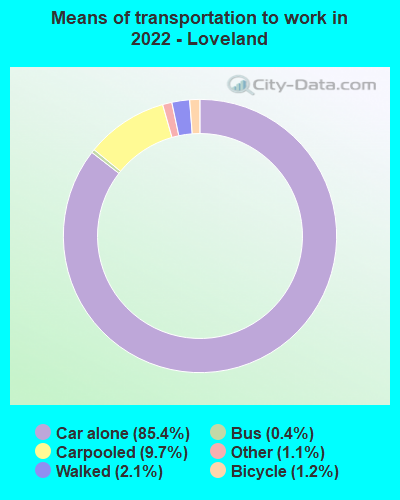
Means of transportation to work:
Drove a car alone: 29,296 (70.3%)
Carpooled: 3,926 (9.4%)
Bus: 82 (0.2%)
Long-distance train or commuter rail: 2 (0.0%)
Ferryboat: 35 (0.1%)
Taxi: 403 (1.0%)
Bicycle: 515 (1.2%)
Walked: 669 (1.6%)
Worked at home: 6,694 (16.1%)
Unemployment by race in 2022
Unemployment rate for White non-Hispanic residents
3.1%Males
6.9%Females
Unemployment rate for American Indian and Alaska Native residents
7.4%Males
Unemployment rate for other race residents
0.9%Males
6.4%Females
Unemployment rate for two or more race residents
3.8%Males
3.2%Females
Unemployment rate for Hispanic or Latino residents
1.7%Males
6.7%Females
Year of entry for the foreign-born population in Loveland, Colorado
4622010 or later
8962000 to 2009
5821990 to 1999
2391980 to 1989
2431970 to 1979
331Before 1970
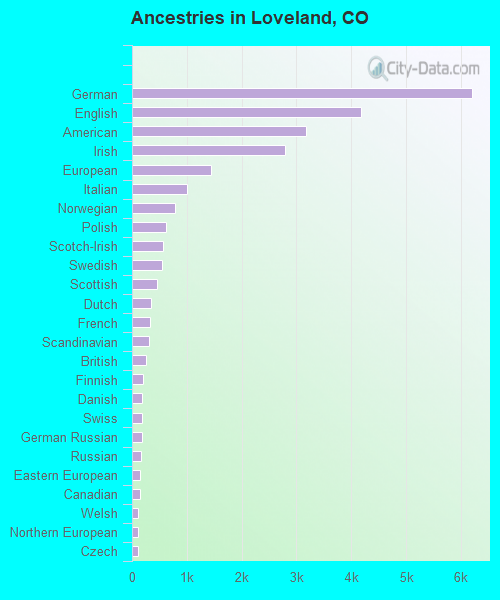
First ancestries reported:
German: 6,203 (18.2%)
English: 4,175 (12.2%)
American: 3,166 (9.3%)
Irish: 2,797 (8.2%)
European: 1,446 (4.2%)
Italian: 1,010 (3.0%)
Norwegian: 777 (2.3%)
Polish: 624 (1.8%)
Scotch-Irish: 564 (1.7%)
Swedish: 544 (1.6%)
Scottish: 459 (1.3%)
Dutch: 342 (1.0%)
French: 332 (1.0%)
Scandinavian: 313 (0.9%)
British: 256 (0.8%)
Finnish: 196 (0.6%)
Danish: 189 (0.6%)
Swiss: 176 (0.5%)
German Russian: 174 (0.5%)
Russian: 164 (0.5%)
Eastern European: 147 (0.4%)
Canadian: 146 (0.4%)
Welsh: 113 (0.3%)
Northern European: 110 (0.3%)
Czech: 103 (0.3%)
Greek: 99 (0.3%)
French Canadian: 91 (0.3%)
Ukrainian: 83 (0.2%)
Hungarian: 82 (0.2%)
Austrian: 43 (0.1%)
Croatian: 38 (0.1%)
Syrian: 35 (0.1%)
Romanian: 33 (0.10%)
Slovak: 29 (0.09%)
Belgian: 27 (0.08%)
Czechoslovakian: 22 (0.06%)
Iranian: 21 (0.06%)
New Zealander: 20 (0.06%)
Jordanian: 18 (0.05%)
Yugoslavian: 15 (0.04%)
Australian: 12 (0.04%)
Armenian: 12 (0.04%)
Ethiopian: 12 (0.04%)
Guyanese: 9 (0.03%)
Cajun: 8 (0.02%)
Arab: 6 (0.02%)
Slovene: 6 (0.02%)
Turkish: 6 (0.02%)
Most common places of birth for foreign-born residents (%):
Mexico
Loveland:
30.6% (878)
Colorado:
38.3% (209,491)
Ecuador
Loveland:
6.9% (198)
Colorado:
0.3% (1,778)
China, excluding Hong Kong and Taiwan
Loveland:
6.2% (179)
Colorado:
3.3% (17,998)
Vietnam
Loveland:
4.4% (127)
Colorado:
3.0% (16,616)
Canada
Loveland:
4.4% (126)
Colorado:
2.7% (15,026)
Germany
Loveland:
3.4% (97)
Colorado:
2.5% (13,706)
Hungary
Loveland:
3.2% (92)
Colorado:
0.2% (1,186)
Colombia
Loveland:
2.9% (84)
Colorado:
1.1% (5,971)
Philippines
Loveland:
2.9% (82)
Colorado:
2.3% (12,342)
France
Loveland:
2.3% (66)
Colorado:
0.5% (2,620)
Russia
Loveland:
2.3% (65)
Colorado:
1.4% (7,860)
Belarus
Loveland:
2.0% (58)
Colorado:
0.2% (1,349)
Denmark
Loveland:
1.9% (56)
Colorado:
0.1% (775)
South Africa
Loveland:
1.6% (46)
Colorado:
0.5% (2,472)
El Salvador
Loveland:
1.5% (44)
Colorado:
2.2% (12,150)
Other Australian and New Zealand Subregion
Loveland:
1.5% (44)
Colorado:
0.2% (1,244)
Place of birth for U.S.-born residents:
This state: 35,612
Other state: 38,932
Northeast: 2,800
Midwest: 18,292
South: 6,869
West: 10,971
84.8% of Loveland residents lived in the same house 1 years ago. Out of people who lived in different houses, 35.9% lived in this county. Out of people who lived in different counties, 51.1% lived in Colorado.
Loveland:
84.8%
State average:
83.6%
Education attainment for males 25 years and older:
No schooling: 129
Nursery to 4th grade: 0
5th and 6th grade: 0
7th and 8th grade: 308
9th grade: 355
10th grade: 108
11th grade: 333
12th grade, no diploma: 538
High school graduate (or equivalency): 7,447
Less than 1 year of college: 1,512
Some college more than 1 year, no degree: 3,713
Associate degree: 2,399
Bachelor's degree: 8,489
Master's degree: 2,579
Professional school degree: 362
Doctorate degree: 284
Education attainment for females 25 years and older:
No schooling: 0
Nursery to 4th grade: 229
5th and 6th grade: 129
7th and 8th grade: 130
9th grade: 0
10th grade: 190
11th grade: 181
12th grade, no diploma: 250
High school graduate (or equivalency): 5,469
Less than 1 year of college: 2,253
Some college more than 1 year, no degree: 3,944
Associate degree: 3,361
Bachelor's degree: 6,494
Master's degree: 2,979
Professional school degree: 175
Doctorate degree: 308
Housing units in structures:
One, detached: 20,622
One, attached: 3,872
Two: 437
3 or 4: 675
5 to 9: 2,238
10 to 19: 2,116
20 to 49: 1,390
50 or more: 1,427
Mobile homes: 857
Median worth of mobile homes: $41,300
Housing units lacking complete plumbing facilities in 2022: 0.2%
Housing units lacking complete kitchen facilities in 2022: 1.7%