Lovington, IL (Illinois) Houses and Residents
| Lovington: | $87,444 |
| Illinois: | $251,600 |
Mean price in 2022:
Detached houses: $82,284
Here: $82,284 State: $310,164 Mobile homes: $54,822
Here: $54,822 State: $78,855
Total population: 1,109 (Urban population: 0, Rural population: 1,257 (all nonfarm))
Houses: 557 (525 occupied: 379 owner occupied, 152 renter occupied)
| % of renters here: | 29% |
| State: | 33% |
Housing density: 692 houses/condos per square mile
Median price asked for vacant for-sale houses and condos in 2022 in this county: $730,824.
Median contract rent in 2022: $469 (lower quartile is $379, upper quartile is $538)
Median rent asked for vacant for-rent units in 2022: $529
Median gross rent in Lovington, IL in 2022: $678
Housing units in Lovington with a mortgage: 198 (3 second mortgage, 0 home equity loan, 4 both second mortgage and home equity loan)
Houses without a mortgage: 3
Median household income for houses/condos with a mortgage: $52,217
Median household income for apartments without a mortgage: $64,175
Median monthly housing costs: $672
Compare current foreclosures near Lovington, IL:
| Photo | Address | Area | Beds / Baths | Price | Details |
|---|---|---|---|---|---|

|
#1
E 5th St
Hammond, IL 61929
|
- sq. feet
|
1 baths 4 beds |
$14,900
|
show details |

|
#2
S Richmond Rd
Decatur, IL 62521
|
- sq. feet
|
1 baths 3 beds |
$45,800
|
show details |

|
#3
N Glendale Ave
Decatur, IL 62521
|
1,543 sq. feet
|
1 baths 2 beds |
show details | |

|
#4
Chickadee Ct W
Bethany, IL 61914
|
- sq. feet
|
2 baths 4 beds |
show details | |

|
#5
W Wilson St
Bement, IL 61813
|
- sq. feet
|
2 baths 3 beds |
show details | |

|
#6
N Fork Rd
Decatur, IL 62521
|
- sq. feet
|
- baths - beds |
show details | |

|
#7
S 34th Pl
Decatur, IL 62521
|
- sq. feet
|
- baths - beds |
show details | |

|
#8
Evergreen Ct Apt 325
Decatur, IL 62521
|
- sq. feet
|
- baths - beds |
show details | |

|
#9
N Piatt St
Bement, IL 61813
|
- sq. feet
|
- baths - beds |
show details | |

|
#10
Nolan Ct
Mt Zion, IL 62549
|
- sq. feet
|
- baths - beds |
show details |
| Photo | Address | Area | Beds / Baths | Price | Details |
|---|---|---|---|---|---|

|
#11
S Market St
Sullivan, IL 61951
|
- sq. feet
|
- baths - beds |
show details | |

|
#12
N 35th St
Decatur, IL 62521
|
- sq. feet
|
- baths - beds |
show details | |

|
#13
E Park Ln
Decatur, IL 62521
|
- sq. feet
|
- baths - beds |
show details | |

|
#14
S Country Club Rd Apt 126
Decatur, IL 62521
|
- sq. feet
|
- baths - beds |
show details | |

|
#15
E Melwood Ct
Decatur, IL 62521
|
- sq. feet
|
- baths - beds |
show details | |

|
#16
E Lakewood Ave
Decatur, IL 62526
|
- sq. feet
|
- baths - beds |
show details | |

|
#17
E Division St
Findlay, IL 62534
|
- sq. feet
|
- baths - beds |
show details | |

|
#18
Sunset Dr
Mt Zion, IL 62549
|
- sq. feet
|
- baths - beds |
show details | |

|
#19
E Grand Ave
Decatur, IL 62526
|
- sq. feet
|
- baths - beds |
show details | |

|
#20
Linda Ct
Mt Zion, IL 62549
|
- sq. feet
|
- baths - beds |
show details |
| Photo | Address | Area | Beds / Baths | Price | Details |
|---|---|---|---|---|---|

|
#21
E Maynard St
Decatur, IL 62521
|
- sq. feet
|
- baths - beds |
show details | |

|
#22
N Country Club Rd
Decatur, IL 62521
|
- sq. feet
|
- baths - beds |
show details | |

|
#23
Haynes Dr
Decatur, IL 62521
|
- sq. feet
|
- baths - beds |
show details | |

|
#24
E Corman St
Decatur, IL 62521
|
- sq. feet
|
- baths - beds |
show details | |

|
#25
Southern Dr
Decatur, IL 62521
|
- sq. feet
|
- baths - beds |
show details | |

|
#26
Greenlake Dr
Decatur, IL 62521
|
- sq. feet
|
- baths - beds |
show details | |

|
#27
Sheridan Dr
Decatur, IL 62521
|
- sq. feet
|
- baths - beds |
show details | |

|
#28
Circle Dr
Decatur, IL 62521
|
- sq. feet
|
- baths - beds |
show details | |

|
#29
N Lake Shore Dr
Decatur, IL 62526
|
- sq. feet
|
- baths - beds |
show details | |

|
#30
S Wheatland Rd
Decatur, IL 62521
|
- sq. feet
|
- baths - beds |
show details |
| Photo | Address | Area | Beds / Baths | Price | Details |
|---|---|---|---|---|---|

|
#31
E Glenwood Ave
Decatur, IL 62526
|
- sq. feet
|
- baths - beds |
show details | |

|
#32
E Lakewood Ave
Decatur, IL 62526
|
- sq. feet
|
- baths - beds |
show details | |

|
#33
E Minnie St
Decatur, IL 62521
|
- sq. feet
|
- baths - beds |
show details | |

|
#34
E Eugene Dr
Decatur, IL 62521
|
- sq. feet
|
- baths - beds |
show details | |

|
#35
E Hickory St
Decatur, IL 62526
|
- sq. feet
|
- baths - beds |
show details | |

|
#36
E Greenhill Rd
Decatur, IL 62521
|
- sq. feet
|
- baths - beds |
show details | |

|
#37
S Baltimore Ave
Decatur, IL 62521
|
- sq. feet
|
- baths - beds |
show details | |

|
#38
S Albany St
Decatur, IL 62521
|
- sq. feet
|
- baths - beds |
show details | |

|
#39
Mill St
Mt Zion, IL 62549
|
- sq. feet
|
- baths - beds |
show details | |

|
#40
Prairie St
Arthur, IL 61911
|
- sq. feet
|
- baths - beds |
show details |
| Photo | Address | Area | Beds / Baths | Price | Details |
|---|---|---|---|---|---|

|
#41
S Hamilton St
Sullivan, IL 61951
|
- sq. feet
|
- baths - beds |
show details | |

|
#42
Country Club Rd
Sullivan, IL 61951
|
- sq. feet
|
- baths - beds |
show details | |

|
#43
Country Club Rd
Sullivan, IL 61951
|
- sq. feet
|
- baths - beds |
show details | |

|
#44
W Forest Ave
Atwood, IL 61913
|
- sq. feet
|
- baths - beds |
show details | |

|
#45
N Juniper Dr
Atwood, IL 61913
|
- sq. feet
|
- baths - beds |
show details | |

|
#46
E Us Route 36
Decatur, IL 62521
|
- sq. feet
|
- baths - beds |
show details | |

|
#47
S Henderson St
Mt Zion, IL 62549
|
- sq. feet
|
- baths - beds |
show details | |

|
#48
South Dr
Mt Zion, IL 62549
|
- sq. feet
|
- baths - beds |
show details | |

|
#49
W Roberts Dr
Mt Zion, IL 62549
|
- sq. feet
|
- baths - beds |
show details | |

|
Check over 1 million property listings on Foreclosure.com!
|
browse all offers | |||

Latest news about housing in Lovington, IL collected exclusively by city-data.com from local newspapers, TV, and radio stations


Median year apartment built: 1956
Household type by relationship:
Households: 1,077- Male householders: 271 (85 living alone), Female householders: 244 (72 living alone)
220 spouses (220 opposite-sex spouses), 54 unmarried partners, (47 opposite-sex unmarried partners), 240 children (230 natural, 9 adopted, 0 stepchildren), 1 grandchildren, 0 brothers or sisters, 1 parents, 8 foster children, 3 other relatives, 16 non-relatives
- In group quarters: 12
Size of family households: 187 2-persons, 56 3-persons, 26 4-persons, 27 5-persons, 18 7-or-more-persons.
Size of nonfamily households: 167 1-person, 47 2-persons, 3 3-persons.
141 married couples with children.
84 single-parent households (37 men, 47 women).
97.5% of residents of Lovington speak English at home.
1.5% of residents speak other Indo-European language at home (20% speak English very well, 80% speak English well).
| Here: | 6.4 |
| State: | 6.4 |
| Here: | 4.9 |
| State: | 4.1 |

- Bedrooms in owner-occupied houses and condos in Lovington, Illinois
- 0no bedroom
- 01 bedroom
- 852 bedrooms
- 2073 bedrooms
- 794 bedrooms
- 85+ bedrooms

- Bedrooms in renter-occupied apartments in Lovington, Illinois
- 0no bedroom
- 451 bedroom
- 542 bedrooms
- 403 bedrooms
- 144 bedrooms
- 05+ bedrooms

- Cars and other vehicles available in Lovington in owner-occupied houses/condos
- 2no vehicle
- 821 vehicle
- 1912 vehicles
- 563 vehicles
- 444 vehicles
- 45+ vehicles

- Cars and other vehicles available in Lovington in renter-occupied apartments
- 26no vehicle
- 771 vehicle
- 102 vehicles
- 163 vehicles
- 154 vehicles
- 75+ vehicles

- Rooms in owner-occupied houses in Lovington, Illinois
- 01 room
- 02 rooms
- 53 rooms
- 414 rooms
- 615 rooms
- 956 rooms
- 697 rooms
- 378 rooms
- 729+ rooms

- Rooms in renter-occupied apartments in Lovington, Illinois
- 01 room
- 42 rooms
- 183 rooms
- 424 rooms
- 245 rooms
- 436 rooms
- 177 rooms
- 08 rooms
- 49+ rooms


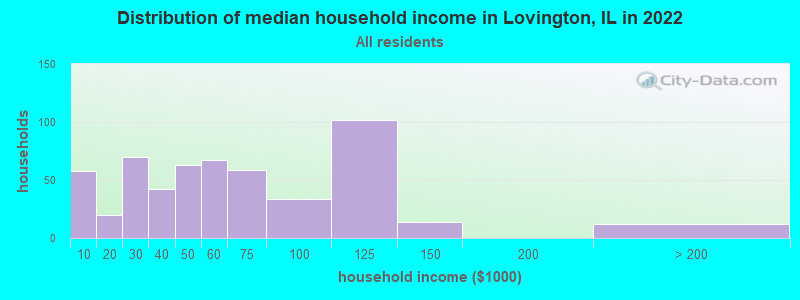
Lovington, IL household income distribution

- 58Less than $10,000
- 20$10,000 to $19,999
- 70$20,000 to $29,999
- 42$30,000 to $39,999
- 63$40,000 to $49,999
- 67$50,000 to $59,999
- 59$60,000 to $74,999
- 34$75,000 to $99,999
- 102$100,000 to $124,999
- 14$125,000 to $149,999
- 12$200,000 or more
Home value of owner - occupied houses in 2022 in Lovington, IL
-
- 8$10,000 to $14,999
- 22$15,000 to $19,999
- 2$20,000 to $24,999
- 6$35,000 to $39,999
- 14$40,000 to $49,999
- 27$50,000 to $59,999
- 58$60,000 to $69,999
- 34$70,000 to $79,999
- 59$80,000 to $89,999
- 66$90,000 to $99,999
- 33$100,000 to $124,999
- 3$125,000 to $149,999
- 15$150,000 to $174,999
- 1$175,000 to $199,999
- 3$250,000 to $299,999

Rent paid by renters in 2022 in Lovington, IL
-
- 4Less than $100
- 3$200 to $249
- 7$250 to $299
- 3$300 to $349
- 20$350 to $399
- 4$400 to $449
- 38$450 to $499
- 13$500 to $549
- 11$600 to $649
- 5$650 to $699
- 3$700 to $749
- 3$750 to $799
- 8$800 to $899
- 20No cash rent


Percentage of workers working in this county: 42.7%
Number of people working at home: 23 (4.7% of all workers)
Travel time to work (commute)
- Less than 5 minutes: 7
- 5 to 9 minutes: 61
- 10 to 14 minutes: 20
- 15 to 19 minutes: 99
- 20 to 24 minutes: 54
- 25 to 29 minutes: 9
- 30 to 34 minutes: 60
- 35 to 39 minutes: 39
- 40 to 44 minutes: 25
- 45 to 59 minutes: 27
- 60 to 89 minutes: 41
- 90 or more minutes: 7
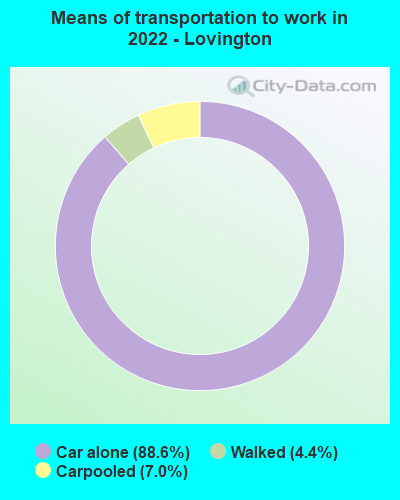
Means of transportation to work:
- Drove a car alone: 193 (80.4%)
- Carpooled: 13 (5.4%)
- Walked: 8 (3.3%)
- Worked at home: 18 (7.5%)

- Unemployment by race in 2022
- Unemployment rate for White non-Hispanic residents
- 8.2%Males
- 1.4%Females
- Unemployment rate for two or more race residents
- 100.0%Females

- Year of entry for the foreign-born population in Lovington, Illinois
- 01995 to March 2000
- 01990 to 1994
- 01985 to 1989
- 01980 to 1984
- 01975 to 1979
- 01970 to 1974
- 01965 to 1969
- 2Before 1965

First ancestries reported:
- American: 76 (24.1%)
- German: 69 (21.9%)
- Irish: 43 (13.6%)
- English: 29 (9.2%)
- European: 29 (9.2%)
- Italian: 18 (5.7%)
- French: 13 (4.1%)
- Swiss: 13 (4.1%)
- Scottish: 6 (1.9%)
- Polish: 1 (0.3%)
Most common places of birth for foreign-born residents (%):
| Lovington: | 100.0% (2) |
| Illinois: | 1.2% (19,098) |
Place of birth for U.S.-born residents:
- This state: 948
- Other state: 115
- Northeast: 15
- Midwest: 38
- South: 35
- West: 26
91.5% of Lovington residents lived in the same house 1 years ago.
Out of people who lived in different houses, 14.4% lived in this county.
Out of people who lived in different counties, 84.6% lived in Illinois.
| Lovington: | 91.5% |
| State average: | 88.3% |
Education attainment for males 25 years and older:
- No schooling: 5
- Nursery to 4th grade: 0
- 5th and 6th grade: 0
- 7th and 8th grade: 15
- 9th grade: 0
- 10th grade: 3
- 11th grade: 16
- 12th grade, no diploma: 9
- High school graduate (or equivalency): 248
- Less than 1 year of college: 19
- Some college more than 1 year, no degree: 9
- Associate degree: 15
- Bachelor's degree: 28
- Master's degree: 5
- Professional school degree: 0
- Doctorate degree: 3

Education attainment for females 25 years and older:
- No schooling: 0
- Nursery to 4th grade: 0
- 5th and 6th grade: 0
- 7th and 8th grade: 1
- 9th grade: 19
- 10th grade: 0
- 11th grade: 0
- 12th grade, no diploma: 0
- High school graduate (or equivalency): 162
- Less than 1 year of college: 27
- Some college more than 1 year, no degree: 61
- Associate degree: 106
- Bachelor's degree: 20
- Master's degree: 14
- Professional school degree: 0
- Doctorate degree: 0


Housing units in structures:
- One, detached: 492
- Two: 27
- 3 or 4: 17
- 5 to 9: 3
- Mobile homes: 18
Housing units lacking complete kitchen facilities in 2022: 1.6%
House/condo owner moved in on average 14 years ago
Renter moved in on average 3 years ago

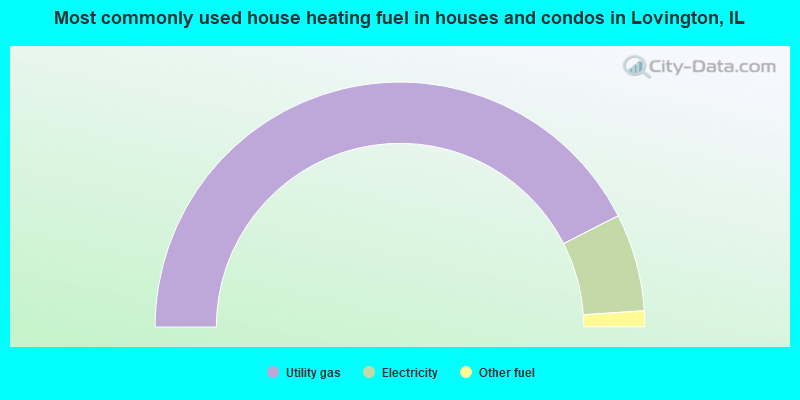
- 85.0%Utility gas
- 12.9%Electricity
- 2.1%Other fuel
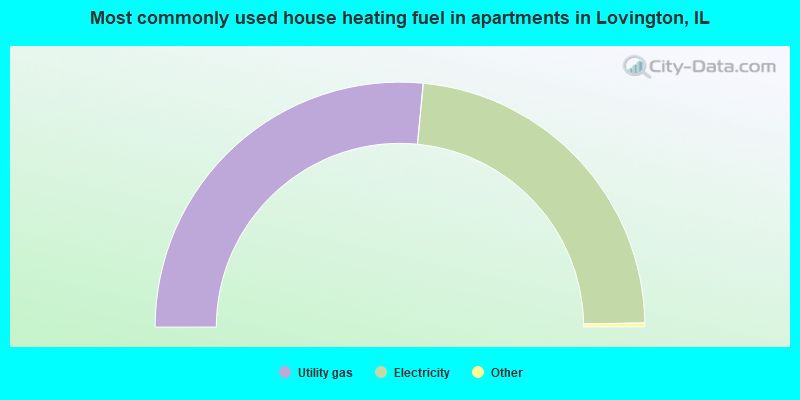
- 53.3%Utility gas
- 46.7%Electricity
Private vs. public school enrollment:
| Here: | 8.9% |
| Illinois: | 13.3% |
| Here: | 0.0% |
| Illinois: | 9.9% |
| Here: | 35.8% |
| Illinois: | 27.4% |


