Lowell, IN (Indiana) Houses and Residents
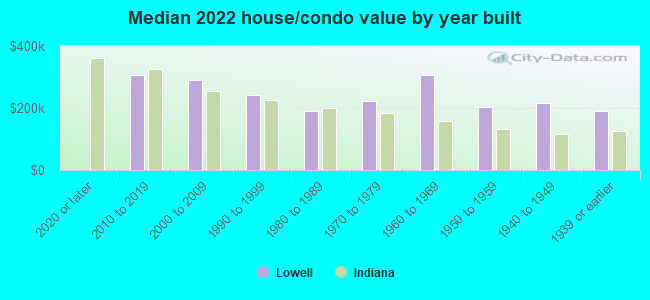
| Lowell: | $238,821 |
| Indiana: | $208,700 |
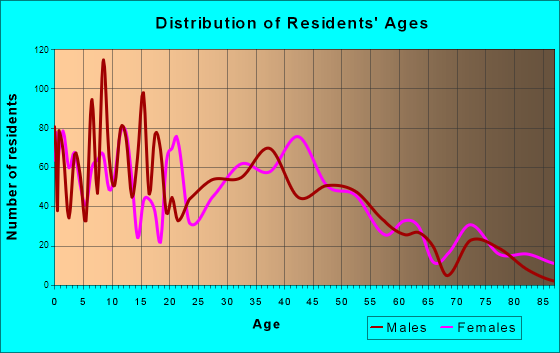
Total population: 9,402 (Urban population: 7,385 (all inside urban clusters), Rural population: 53 (all nonfarm))
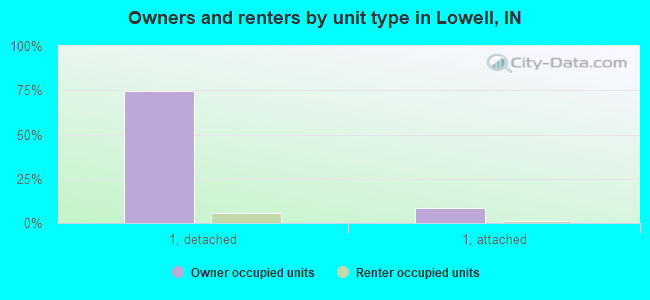
Houses: 4,013 (3,867 occupied: 3,203 owner occupied, 667 renter occupied)
| % of renters here: | 17% |
| State: | 29% |
Housing density: 983 houses/condos per square mile
Median price asked for vacant for-sale houses and condos in 2022: $780,796.
Median contract rent in 2022: $952 (lower quartile is $762, upper quartile is $1,213)
Median rent asked for vacant for-rent units in 2022: $733
Median gross rent in Lowell, IN in 2022: $1,265
Housing units in Lowell with a mortgage: 2,278 (214 second mortgage, 0 home equity loan, 209 both second mortgage and home equity loan)
Houses without a mortgage: 0
Median household income for houses/condos with a mortgage: $94,263
Median household income for apartments without a mortgage: $71,739
Median monthly housing costs: $1,201
Compare current foreclosures in Lowell, IN:
| Photo | Address | Area | Beds / Baths | Price | Details |
|---|---|---|---|---|---|

|
#1
N Liberty St
Lowell, IN 46356
|
2,548 sq. feet
|
1 baths 3 beds |
show details | |

|
#2
Burnham St
Lowell, IN 46356
|
2,096 sq. feet
|
1 baths 2 beds |
show details | |

|
#3
W Commercial Ave
Lowell, IN 46356
|
4,332 sq. feet
|
1 baths 4 beds |
show details | |

|
#4
Aspen Ct
Lowell, IN 46356
|
1,232 sq. feet
|
2 baths 3 beds |
show details | |

|
#5
Hoshaw St
Lowell, IN 46356
|
2,780 sq. feet
|
2 baths 3 beds |
show details | |

|
#6
Debra Ln
Lowell, IN 46356
|
2,148 sq. feet
|
1 baths 4 beds |
show details | |

|
#7
Seminole Dr
Lowell, IN 46356
|
2,146 sq. feet
|
2 baths 3 beds |
show details | |

|
#8
W 157th Pl
Lowell, IN 46356
|
2,304 sq. feet
|
2 baths 3 beds |
show details | |

|
#9
Dakota Dr
Lowell, IN 46356
|
1,344 sq. feet
|
2 baths 3 beds |
show details | |

|
#10
W Lakeview Dr
Lowell, IN 46356
|
1,856 sq. feet
|
1 baths 2 beds |
show details |
| Photo | Address | Area | Beds / Baths | Price | Details |
|---|---|---|---|---|---|

|
#11
Camelot Dr
Lowell, IN 46356
|
1,872 sq. feet
|
2 baths 3 beds |
show details | |

|
#12
Seminole Dr
Lowell, IN 46356
|
1,508 sq. feet
|
2 baths 3 beds |
show details | |

|
#13
Marion Dr
Lowell, IN 46356
|
2,148 sq. feet
|
1 baths 3 beds |
show details | |

|
#14
Tower Ct
Lowell, IN 46356
|
1,780 sq. feet
|
1 baths 3 beds |
show details | |

|
#15
Valley View Dr
Lowell, IN 46356
|
1,584 sq. feet
|
2 baths 3 beds |
show details | |

|
#16
Blackwood Dr
Lowell, IN 46356
|
1,968 sq. feet
|
1 baths 3 beds |
show details | |

|
#17
Cardinal Ln
Lowell, IN 46356
|
1,120 sq. feet
|
1 baths 3 beds |
show details | |

|
#18
Sequoia Ave
Lowell, IN 46356
|
1,632 sq. feet
|
1 baths 3 beds |
show details | |

|
#19
W 181st Ave
Lowell, IN 46356
|
1,512 sq. feet
|
1 baths 2 beds |
show details | |

|
#20
Meadow Ln
Lowell, IN 46356
|
1,056 sq. feet
|
1 baths 3 beds |
show details |
| Photo | Address | Area | Beds / Baths | Price | Details |
|---|---|---|---|---|---|

|
#21
Parkwood Dr
Lowell, IN 46356
|
2,392 sq. feet
|
1 baths 3 beds |
show details | |

|
#22
Southview Dr
Lowell, IN 46356
|
1,008 sq. feet
|
1 baths 3 beds |
show details | |

|
#23
Longwood Dr
Lowell, IN 46356
|
3,060 sq. feet
|
2 baths 3 beds |
show details | |

|
#24
Maple St
Lowell, IN 46356
|
1,504 sq. feet
|
1 baths 3 beds |
show details | |

|
#25
Arthur Ave
Lowell, IN 46356
|
1,552 sq. feet
|
1 baths 4 beds |
show details | |

|
#26
Oakwood Ln
Lowell, IN 46356
|
2,460 sq. feet
|
3 baths 3 beds |
show details | |

|
#27
W Main St # B
Lowell, IN 46356
|
820 sq. feet
|
2 baths 4 beds |
show details | |

|
#28
Elm St
Lowell, IN 46356
|
1,924 sq. feet
|
1 baths 3 beds |
show details | |

|
#29
Marion Dr
Lowell, IN 46356
|
1,920 sq. feet
|
1 baths 3 beds |
show details | |

|
#30
Hoshaw St
Lowell, IN 46356
|
4,368 sq. feet
|
2 baths 3 beds |
show details |
| Photo | Address | Area | Beds / Baths | Price | Details |
|---|---|---|---|---|---|

|
#31
Canary Ln
Lowell, IN 46356
|
1,232 sq. feet
|
1 baths 4 beds |
show details | |

|
#32
Burrwood Ct
Lowell, IN 46356
|
864 sq. feet
|
2 baths 4 beds |
show details | |

|
#33
Jansen Ct
Lowell, IN 46356
|
2,148 sq. feet
|
1 baths 3 beds |
show details | |

|
#34
W 205th Ave
Lowell, IN 46356
|
1,352 sq. feet
|
1 baths 3 beds |
show details | |

|
#35
Langen St
Lowell, IN 46356
|
- sq. feet
|
- baths - beds |
show details | |

|
#36
Creekside Dr Apt 105
Lowell, IN 46356
|
- sq. feet
|
- baths - beds |
show details | |

|
#37
Belshaw Rd
Lowell, IN 46356
|
- sq. feet
|
- baths - beds |
show details | |

|
#38
Valley View Dr
Lowell, IN 46356
|
- sq. feet
|
- baths - beds |
show details | |

|
#39
Mayflower Dr
Lowell, IN 46356
|
- sq. feet
|
- baths - beds |
show details | |

|
#40
N Burr St
Lowell, IN 46356
|
- sq. feet
|
- baths - beds |
show details |
| Photo | Address | Area | Beds / Baths | Price | Details |
|---|---|---|---|---|---|

|
#41
Crestline Dr # A
Lowell, IN 46356
|
- sq. feet
|
- baths - beds |
show details | |

|
#42
Creekside Dr, Unit Apt
Lowell, IN 46356
|
- sq. feet
|
- baths - beds |
show details | |

|
#43
Oakwood Ln
Lowell, IN 46356
|
- sq. feet
|
- baths - beds |
show details | |

|
#44
Cline St
Lowell, IN 46356
|
- sq. feet
|
- baths - beds |
show details | |

|
#45
W 221st Ave
Lowell, IN 46356
|
- sq. feet
|
- baths - beds |
show details | |

|
#46
Southview Dr
Lowell, IN 46356
|
- sq. feet
|
- baths - beds |
show details | |

|
#47
Cline St
Lowell, IN 46356
|
- sq. feet
|
- baths - beds |
show details | |

|
#48
Holtz Rd
Lowell, IN 46356
|
- sq. feet
|
- baths - beds |
show details | |

|
#49
W 171st Pl
Lowell, IN 46356
|
- sq. feet
|
- baths - beds |
show details | |

|
Check over 1 million property listings on Foreclosure.com!
|
browse all offers | |||

Latest news about housing in Lowell, IN collected exclusively by city-data.com from local newspapers, TV, and radio stations

 | Low Inventory of homes in the region (17 replies) |
| Downtown Crown Point shooting damages cars, homes (6 replies) |
| Apartments in Valparaiso Indiana (1 reply) |
| Why Isn’t Cedar Lake More Developed? (6 replies) |
| Home Builders- Newcastle Homes? (2 replies) |
| Chicago family looking for some land, space, and chickens in NWI (6 replies) |
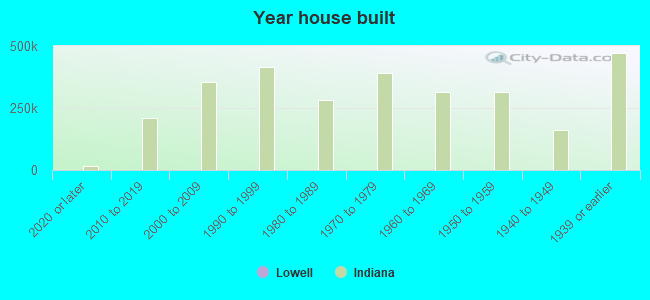
Median year apartment built: 1973
Household type by relationship:
Households: 10,766- Male householders: 1,756 (296 living alone), Female householders: 2,084 (640 living alone)
2,220 spouses (2,203 opposite-sex spouses), 93 unmarried partners, (93 opposite-sex unmarried partners), 3,530 children (3,138 natural, 10 adopted, 381 stepchildren), 552 grandchildren, 89 brothers or sisters, 95 parents, 0 foster children, 40 other relatives, 183 non-relatives
- In group quarters: 120
Size of family households: 1,063 2-persons, 710 3-persons, 598 4-persons, 303 5-persons, 129 6-persons.
Size of nonfamily households: 960 1-person, 76 2-persons, 11 4-persons.
2,272 married couples with children.
222 single-parent households (34 men, 188 women).
93.1% of residents of Lowell speak English at home.
4.6% of residents speak Spanish at home (86% speak English very well, 6% speak English well, 8% speak English not well).
1.4% of residents speak other Indo-European language at home (90% speak English very well, 10% speak English not well).
Foreign born population: 462 (4.3%)
(43.5% of them are naturalized citizens)
| Here: | 6.3 |
| State: | 6.6 |
| Here: | 4.8 |
| State: | 4.3 |
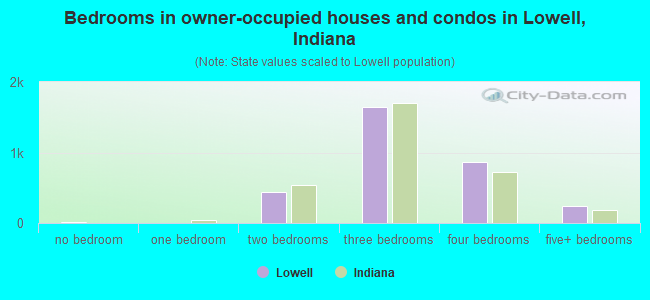
- Bedrooms in owner-occupied houses and condos in Lowell, Indiana
- 18no bedroom
- 01 bedroom
- 4392 bedrooms
- 1,6393 bedrooms
- 8724 bedrooms
- 2355+ bedrooms
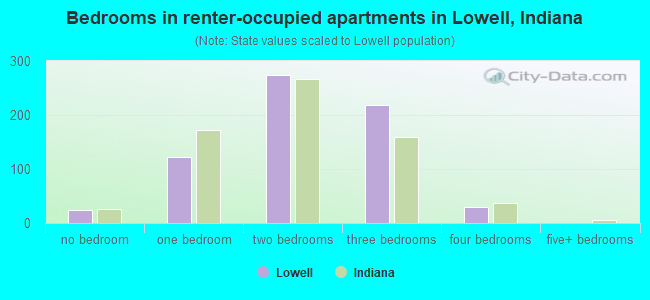
- Bedrooms in renter-occupied apartments in Lowell, Indiana
- 24no bedroom
- 1221 bedroom
- 2742 bedrooms
- 2183 bedrooms
- 294 bedrooms
- 05+ bedrooms
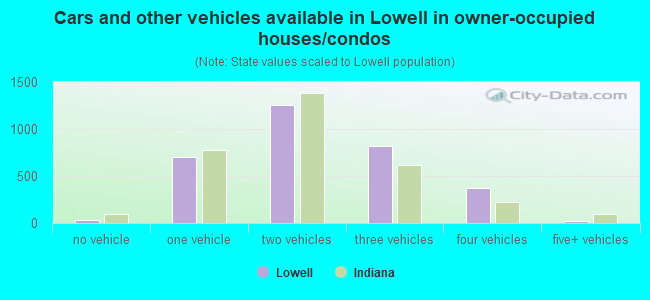
- Cars and other vehicles available in Lowell in owner-occupied houses/condos
- 36no vehicle
- 7041 vehicle
- 1,2522 vehicles
- 8203 vehicles
- 3694 vehicles
- 215+ vehicles
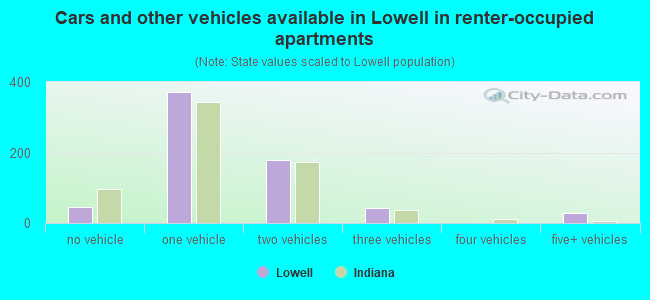
- Cars and other vehicles available in Lowell in renter-occupied apartments
- 45no vehicle
- 3731 vehicle
- 1782 vehicles
- 433 vehicles
- 04 vehicles
- 295+ vehicles
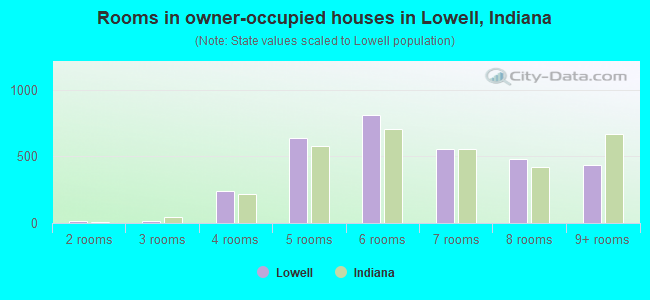
- Rooms in owner-occupied houses in Lowell, Indiana
- 01 room
- 182 rooms
- 143 rooms
- 2424 rooms
- 6425 rooms
- 8136 rooms
- 5607 rooms
- 4788 rooms
- 4379+ rooms
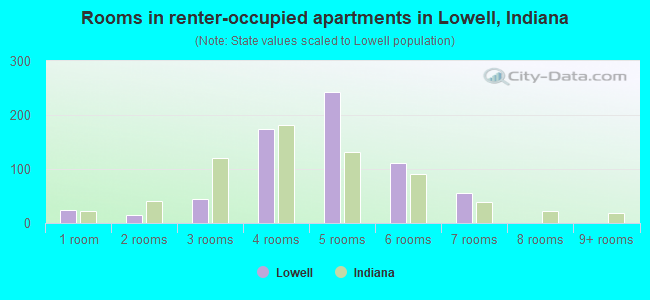
- Rooms in renter-occupied apartments in Lowell, Indiana
- 241 room
- 152 rooms
- 453 rooms
- 1744 rooms
- 2435 rooms
- 1126 rooms
- 557 rooms
- 08 rooms
- 09+ rooms
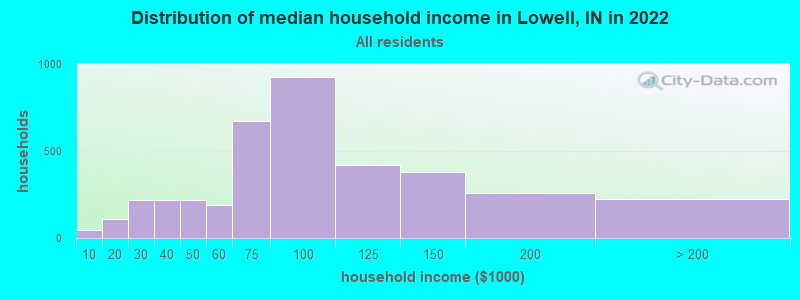
Lowell, IN household income distribution

- 47Less than $10,000
- 109$10,000 to $19,999
- 219$20,000 to $29,999
- 217$30,000 to $39,999
- 216$40,000 to $49,999
- 187$50,000 to $59,999
- 670$60,000 to $74,999
- 923$75,000 to $99,999
- 421$100,000 to $124,999
- 378$125,000 to $149,999
- 257$150,000 to $199,999
- 224$200,000 or more
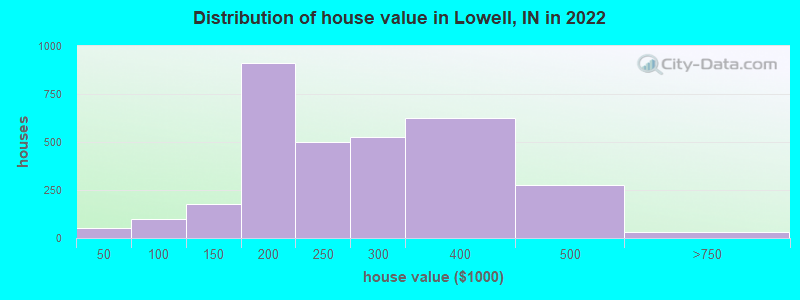
Home value of owner - occupied houses in 2022 in Lowell, IN
-
- 45$15,000 to $19,999
- 5$25,000 to $29,999
- 25$50,000 to $59,999
- 54$60,000 to $69,999
- 7$80,000 to $89,999
- 14$90,000 to $99,999
- 45$100,000 to $124,999
- 129$125,000 to $149,999
- 269$150,000 to $174,999
- 644$175,000 to $199,999
- 497$200,000 to $249,999
- 527$250,000 to $299,999
- 626$300,000 to $399,999
- 273$400,000 to $499,999
- 31$500,000 to $749,999
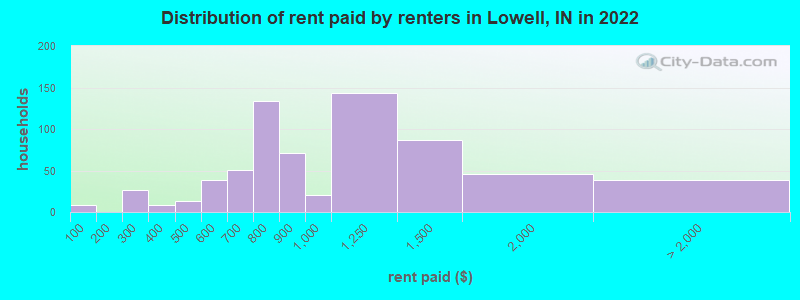
Rent paid by renters in 2022 in Lowell, IN
-
- 7Less than $100
- 26$200 to $249
- 8$300 to $349
- 12$450 to $499
- 37$500 to $549
- 50$650 to $699
- 62$700 to $749
- 71$750 to $799
- 71$800 to $899
- 21$900 to $999
- 143$1,000 to $1,249
- 87$1,250 to $1,499
- 45$1,500 to $1,999
- 38No cash rent
Percentage of workers working in this county: 79.3%
Number of people working at home: 593 (11.6% of all workers)
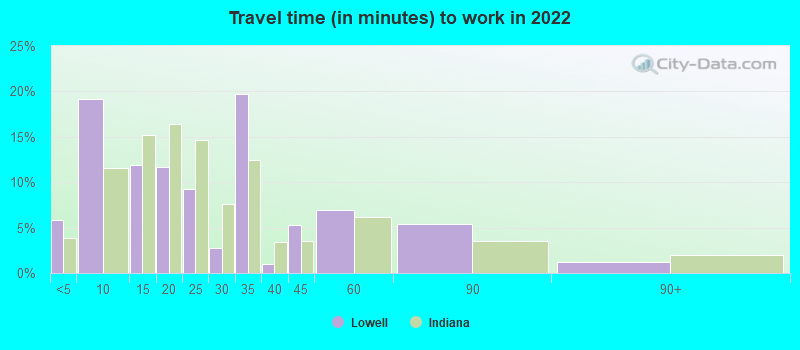
Travel time to work (commute)
- Less than 5 minutes: 302
- 5 to 9 minutes: 590
- 10 to 14 minutes: 317
- 15 to 19 minutes: 257
- 20 to 24 minutes: 325
- 25 to 29 minutes: 234
- 30 to 34 minutes: 572
- 35 to 39 minutes: 247
- 40 to 44 minutes: 369
- 45 to 59 minutes: 829
- 60 to 89 minutes: 327
- 90 or more minutes: 133
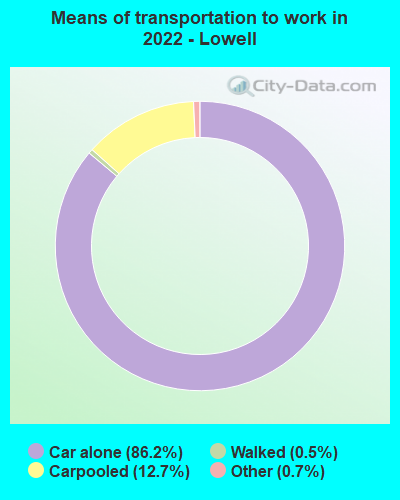
Means of transportation to work:
- Drove a car alone: 2,341 (71.7%)
- Carpooled: 409 (12.5%)
- Taxi: 17 (0.5%)
- Walked: 13 (0.4%)
- Worked at home: 593 (18.2%)
- Unemployment by race in 2022
- Unemployment rate for White non-Hispanic residents
- 3.9%Males
- 3.8%Females
- Unemployment rate for two or more race residents
- 9.6%Females
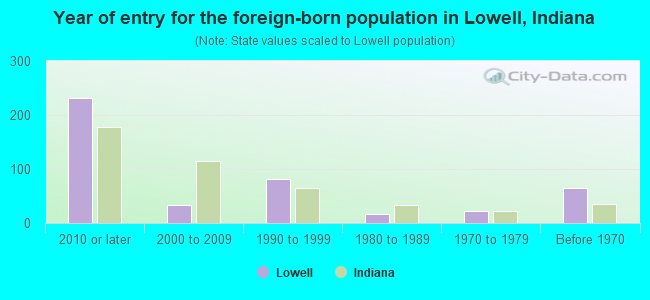
- Year of entry for the foreign-born population in Lowell, Indiana
- 2312010 or later
- 342000 to 2009
- 811990 to 1999
- 161980 to 1989
- 221970 to 1979
- 64Before 1970
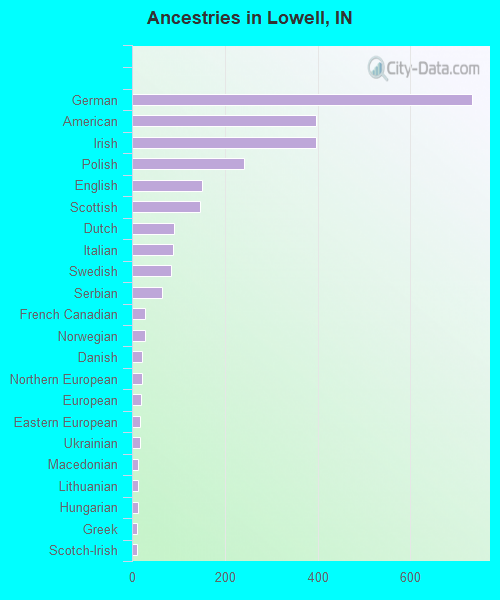
First ancestries reported:
- German: 733 (22.3%)
- American: 396 (12.0%)
- Irish: 396 (12.0%)
- Polish: 242 (7.4%)
- English: 151 (4.6%)
- Scottish: 146 (4.4%)
- Dutch: 91 (2.8%)
- Italian: 88 (2.7%)
- Swedish: 84 (2.6%)
- Serbian: 64 (1.9%)
- French Canadian: 29 (0.9%)
- Norwegian: 28 (0.9%)
- Danish: 22 (0.7%)
- Northern European: 22 (0.7%)
- European: 20 (0.6%)
- Eastern European: 18 (0.5%)
- Ukrainian: 17 (0.5%)
- Macedonian: 14 (0.4%)
- Lithuanian: 13 (0.4%)
- Hungarian: 12 (0.4%)
- Greek: 11 (0.3%)
- Scotch-Irish: 11 (0.3%)
Most common places of birth for foreign-born residents (%):
| Lowell: | 42.8% (204) |
| Indiana: | 27.0% (101,996) |
| Lowell: | 16.8% (80) |
| Indiana: | 0.6% (2,421) |
| Lowell: | 15.1% (72) |
| Indiana: | 1.8% (6,718) |
| Lowell: | 7.5% (36) |
| Indiana: | 0.4% (1,393) |
| Lowell: | 3.4% (16) |
| Indiana: | 1.7% (6,439) |
Place of birth for U.S.-born residents:
- This state: 6,690
- Other state: 3,576
- Northeast: 75
- Midwest: 3,210
- South: 230
- West: 142
93.0% of Lowell residents lived in the same house 1 years ago.
Out of people who lived in different houses, 49.6% lived in this county.
Out of people who lived in different counties, 1.9% lived in Indiana.
| Lowell: | 93.0% |
| State average: | 87.1% |
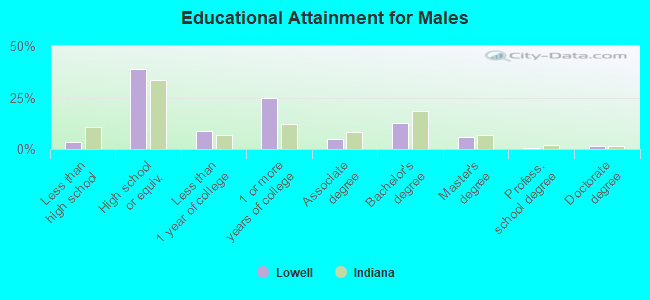
Education attainment for males 25 years and older:
- No schooling: 23
- Nursery to 4th grade: 0
- 5th and 6th grade: 12
- 7th and 8th grade: 0
- 9th grade: 0
- 10th grade: 65
- 11th grade: 0
- 12th grade, no diploma: 0
- High school graduate (or equivalency): 1,226
- Less than 1 year of college: 270
- Some college more than 1 year, no degree: 785
- Associate degree: 161
- Bachelor's degree: 393
- Master's degree: 185
- Professional school degree: 9
- Doctorate degree: 39
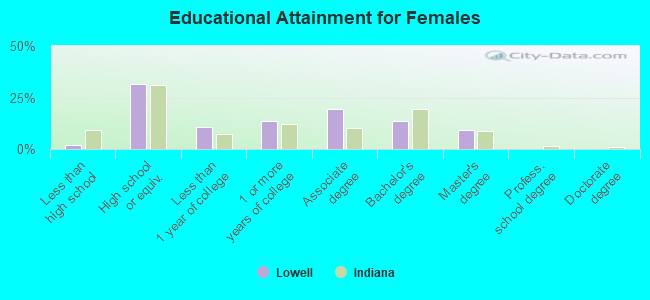
Education attainment for females 25 years and older:
- No schooling: 0
- Nursery to 4th grade: 1
- 5th and 6th grade: 17
- 7th and 8th grade: 6
- 9th grade: 0
- 10th grade: 8
- 11th grade: 11
- 12th grade, no diploma: 31
- High school graduate (or equivalency): 1,222
- Less than 1 year of college: 408
- Some college more than 1 year, no degree: 526
- Associate degree: 739
- Bachelor's degree: 531
- Master's degree: 349
- Professional school degree: 0
- Doctorate degree: 0
Housing units in structures:
- One, detached: 3,125
- One, attached: 381
- Two: 152
- 3 or 4: 99
- 5 to 9: 23
- 10 to 19: 92
- 20 to 49: 128
- 50 or more: 11
Housing units lacking complete kitchen facilities in 2022: 1.6%
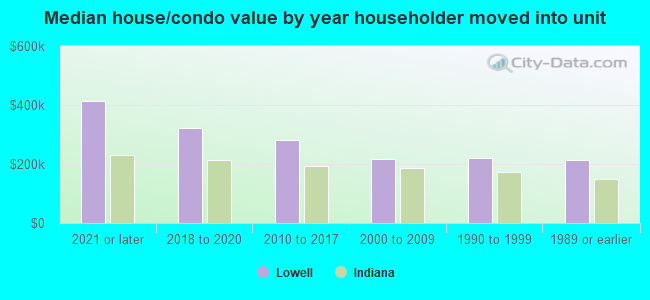
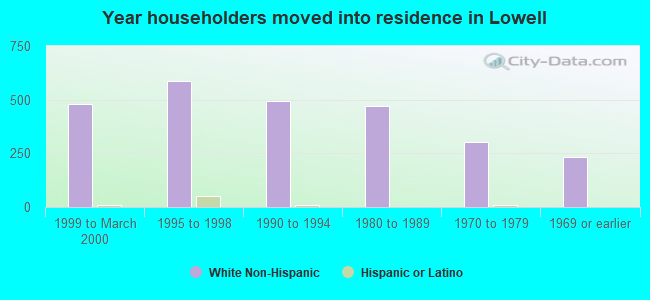
House/condo owner moved in on average 12 years ago
Renter moved in on average 2 years ago
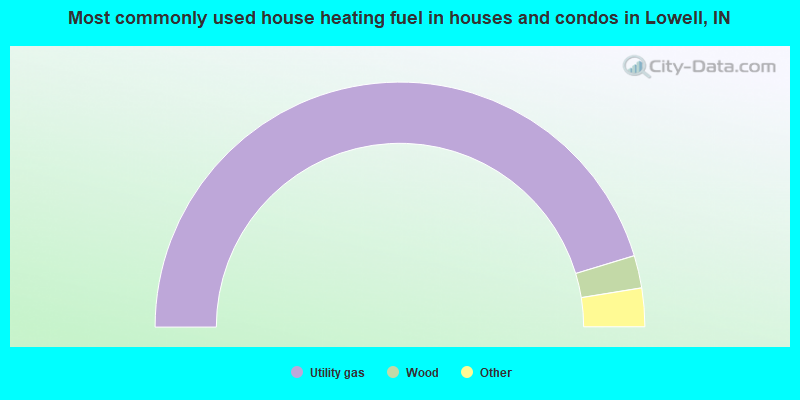
- 90.7%Utility gas
- 4.3%Wood
- 2.6%Bottled, tank, or LP gas
- 2.4%Electricity
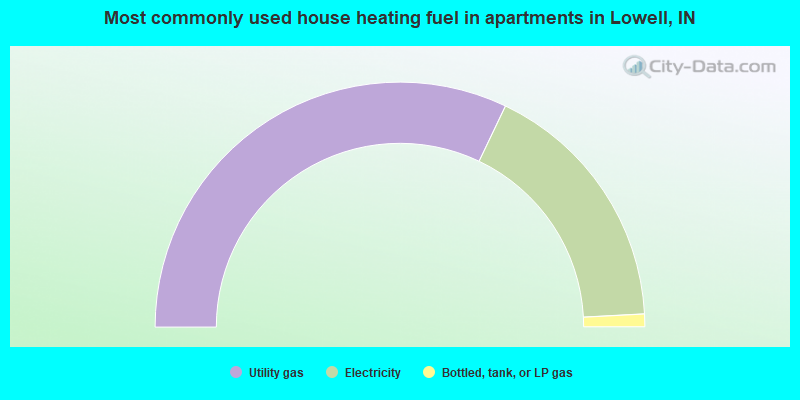
- 64.2%Utility gas
- 34.1%Electricity
- 1.7%Bottled, tank, or LP gas
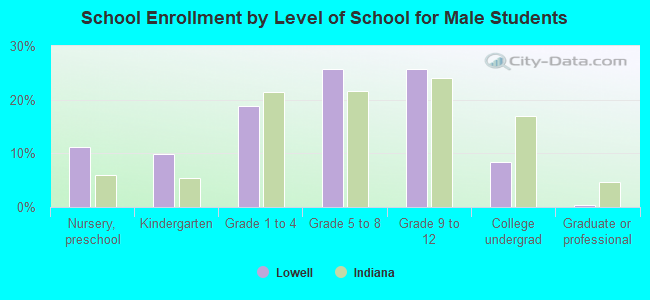
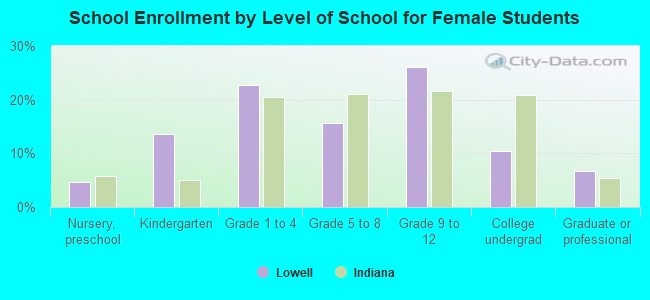
Private vs. public school enrollment:
| Here: | 6.2% |
| Indiana: | 14.9% |
| Here: | 0.0% |
| Indiana: | 11.4% |
| Here: | 82.0% |
| Indiana: | 22.3% |