Lowell, MA (Massachusetts) Houses and Residents
Estimated median house or condo value in 2022: $420,200 (it was $130,500 in 2000 )
Lowell:
$420,200Massachusetts:
$534,700
Lower value quartile - upper value quartile: $315,000 - $555,500Mean price in 2022: Detached houses: $402,607 Here:
$402,607State:
$651,570
Townhouses or other attached units: $332,514 Here:
$332,514State:
$617,749
In 2-unit structures: $495,573 Here:
$495,573State:
$594,808
In 3-to-4-unit structures: $867,095 Here:
$867,095State:
$601,912
In 5-or-more-unit structures: $287,265 Here:
$287,265State:
$555,768
Mobile homes: $85,628 Here:
$85,628State:
$170,209
Total population: 109,945 (Urban population: 105,167, Rural population: 0)
Houses: 42,944 (40,790 occupied: 18,103 owner occupied, 22,687 renter occupied )
% of renters here:
56%State:
38%
Housing density: 3,118 houses/condos per square mile
Median price asked for vacant for-sale houses and condos in 2022: $330,068.
Median contract rent in 2022: $1,303 (lower quartile is $915, upper quartile is $1,672)
Median rent asked for vacant for-rent units in 2022: $2,439
Median gross rent in Lowell, MA in 2022: $1,513
Housing units in Lowell with a mortgage: 12,287 (1,409 second mortgage, 0 home equity loan, 1,231 both second mortgage and home equity loan )Houses without a mortgage: 429
Median household income for houses/condos with a mortgage: $107,568
Median household income for apartments without a mortgage: $75,042
Median monthly housing costs: $1,557
Data:
Median house or condo value ($)
Median house or condo value ($ change since 2000)
Median house or condo value ($) - White
Median house or condo value ($) - Black or African American
Median house or condo value ($) - Asian
Median house or condo value ($) - Hispanic or Latino
Median house or condo value ($) - American Indian and Alaska Native
Median house or condo value ($) - Multirace
Median house or condo value ($) - Other Race
Median price asked for mobile homes ($)
Household density (households per square mile)
Mean house or condo value by units in structure - 1, detached ($)
Mean house or condo value by units in structure - 1, attached ($)
Mean house or condo value by units in structure - 2 ($)
Mean house or condo value by units in structure by units in structure - 3 or 4 ($)
Mean house or condo value by units in structure - 5 or more ($)
Mean house or condo value by units in structure - Boat, RV, van, etc. ($)
Mean house or condo value by units in structure - Mobile home ($)
Median contract rent ($)
Median contract rent - Lower quartile ($)
Median contract rent - Upper quartile ($)
Median gross rent ($)
Urban houses (%)
Rural houses (%)
Houses occupied (%)
Houses occupied (% change since 2000)
Houses owner occupied (%)
Houses owner occupied (% change since 2000)
Houses renter occupied (%)
Houses renter occupied (% change since 2000)
Vacant housing units - For rent (%)
Vacant housing units - For rent (% change since 2000)
Vacant housing units - For sale only (%)
Vacant housing units - For sale only (% change since 2000)
Vacant housing units - Rented or sold, not occupied (%)
Vacant housing units - Rented or sold, not occupied (% change since 2000)
Vacant housing units - For seasonal, recreational, or occasional use (%)
Vacant housing units - For seasonal, recreational, or occasional use (% change since 2000)
Vacant housing units - For migrant workers (%)
Vacant housing units - For migrant workers (% change since 2000)
Vacant housing units - Other vacant (%)
Vacant housing units - Other vacant (% change since 2000)
Median monthly housing costs ($)
Median household income for houses/condos with a mortgage ($)
Median household income for houses/condos without a mortgage ($)
Median household income ($)
Median household income ($) - White
Median household income ($) - Black or African American
Median household income ($) - Asian
Median household income ($) - Hispanic or Latino
Median household income ($) - American Indian and Alaska Native
Median household income ($) - Multirace
Median household income ($) - Other Race
Mortgage status - with mortgage (%)
Mortgage status - with second mortgage (%)
Mortgage status - with home equity loan (%)
Mortgage status - with both second mortgage and home equity loan (%)
Mortgage status - without a mortgage (%)
Median year house/condo built
Median year apartment built
Household type by relationship - Male householder living alone (%)
Household type by relationship - Male householder not living alone (%)
Household type by relationship - Female householder living alone (%)
Household type by relationship - Female householder not living alone (%)
Household type by relationship - Opposite-Sex spouse (%)
Household type by relationship - Same-Sex spouse (%)
Household type by relationship - Opposite-Sex unmarried partner (%)
Household type by relationship - Same-Sex unmarried partner (%)
Household type by relationship - In group quarters (%)
Size of family households - 2-person household (%)
Size of family households - 3-person household (%)
Size of family households - 4-person household (%)
Size of family households - 5-person household (%)
Size of family households - 6-person household (%)
Size of family households - 7-or-more-person household (%)
Size of nonfamily households - 1-person household (%)
Size of nonfamily households - 2-person household (%)
Size of nonfamily households - 3-person household (%)
Size of nonfamily households - 4-person household (%)
Size of nonfamily households - 5-person household (%)
Size of nonfamily households - 6-person household (%)
Size of nonfamily households - 7-or-moreperson household (%)
Year house built - Built 2010 or later (%)
Year house built - Built 2000 to 2009 (%)
Year house built - Built 1990 to 1999 (%)
Year house built - Built 1980 to 1989 (%)
Year house built - Built 1970 to 1979 (%)
Year house built - Built 1960 to 1969 (%)
Year house built - Built 1950 to 1959 (%)
Year house built - Built 1940 to 1949 (%)
Year house built - Built 1939 or earlier (%)
Median number of rooms in houses and condos
Median number of rooms in apartments
Median number of bedrooms in owner occupied houses
Mean number of bedrooms in owner occupied houses
Median number of bedrooms in renter occupied houses
Mean number of bedrooms in renter occupied houses
Median number of vehichles in owner occupied houses
Mean number of vehichles in owner occupied houses
Median number of vehichles in renter occupied houses
Mean number of vehichles in renter occupied houses
Rooms in owner-occupied houses - 1 room (%)
Rooms in owner-occupied houses - 2 rooms (%)
Rooms in owner-occupied houses - 3 rooms (%)
Rooms in owner-occupied houses - 4 rooms (%)
Rooms in owner-occupied houses - 5 rooms (%)
Rooms in owner-occupied houses - 6 rooms (%)
Rooms in owner-occupied houses - 7 rooms (%)
Rooms in owner-occupied houses - 8 rooms (%)
Rooms in owner-occupied houses - 9+ rooms (%)
Rooms in renter-occupied houses - 1 room (%)
Rooms in renter-occupied houses - 2 rooms (%)
Rooms in renter-occupied houses - 3 rooms (%)
Rooms in renter-occupied houses - 4 rooms (%)
Rooms in renter-occupied houses - 5 rooms (%)
Rooms in renter-occupied houses - 6 rooms (%)
Rooms in renter-occupied houses - 7 rooms (%)
Rooms in renter-occupied houses - 8 rooms (%)
Rooms in renter-occupied houses - 9+ rooms (%)
Bedrooms in owner-occupied houses - no bedrooms (%)
Bedrooms in owner-occupied houses - 1 bedroom (%)
Bedrooms in owner-occupied houses - 2 bedrooms (%)
Bedrooms in owner-occupied houses - 3 bedrooms (%)
Bedrooms in owner-occupied houses - 4 bedrooms (%)
Bedrooms in owner-occupied houses - 5+ bedrooms (%)
Bedrooms in renter-occupied houses - no bedrooms (%)
Bedrooms in renter-occupied houses - 1 bedroom (%)
Bedrooms in renter-occupied houses - 2 bedrooms (%)
Bedrooms in renter-occupied houses - 3 bedrooms (%)
Bedrooms in renter-occupied houses - 4 bedrooms (%)
Bedrooms in renter-occupied houses - 5+ bedrooms (%)
Vehicles available in owner-occupied houses - no vehicle available (%)
Vehicles available in owner-occupied houses - 1 vehicle available(%)
Vehicles available in owner-occupied houses - 2 Vehicles available (%)
Vehicles available in owner-occupied houses - 3 Vehicles available (%)
Vehicles available in owner-occupied houses - 4 Vehicles available (%)
Vehicles available in owner-occupied houses - 5+ Vehicles available (%)
Vehicles available in renter-occupied houses - no vehicle available (%)
Vehicles available in renter-occupied houses - 1 vehicle available (%)
Vehicles available in renter-occupied houses - 2 Vehicles available (%)
Vehicles available in renter-occupied houses - 3 Vehicles available (%)
Vehicles available in renter-occupied houses - 4 Vehicles available (%)
Vehicles available in renter-occupied houses - 5+ Vehicles available (%)
Housing units in structures - 1, detached (%)
Housing units in structures - 1, attached (%)
Housing units in structures - 2 (%)
Housing units in structures - 3 or 4 (%)
Housing units in structures - 5 to 9 (%)
Housing units in structures - 10 to 19 (%)
Housing units in structures - 20 to 49 (%)
Housing units in structures - 50 or more (%)
Housing units in structures - Mobile home (%)
Housing units in structures - Boat, RV, van, etc. (%)
Housing units in structures - Owners - 1, detached (%)
Housing units in structures - Owners - 1, attached (%)
Housing units in structures - Owners - 2 (%)
Housing units in structures - Owners - 3 or 4 (%)
Housing units in structures - Owners - 5 to 9 (%)
Housing units in structures - Owners - 10 to 19 (%)
Housing units in structures - Owners - 20 to 49 (%)
Housing units in structures - Owners - 50 or more (%)
Housing units in structures - Owners - Mobile home (%)
Housing units in structures - Owners - Boat, RV, van, etc. (%)
Housing units in structures - Renters - 1, detached (%)
Housing units in structures - Renters - 1, attached (%)
Housing units in structures - Renters - 2 (%)
Housing units in structures - Renters - 3 or 4 (%)
Housing units in structures - Renters - 5 to 9 (%)
Housing units in structures - Renters - 10 to 19 (%)
Housing units in structures - Renters - 20 to 49 (%)
Housing units in structures - Renters - 50 or more (%)
Housing units in structures - Renters - Mobile home (%)
Housing units in structures - Renters - Boat, RV, van, etc. (%)
House/condo owner moved in on average (years ago)
Renter moved in on average (years ago)
Year householder moved into unit - Moved in 1999 to March 2000 (%)
Year householder moved into unit - Moved in 1999 to March 2000 (%) - White
Year householder moved into unit - Moved in 1999 to March 2000 (%) - Black or African American
Year householder moved into unit - Moved in 1999 to March 2000 (%) - Asian
Year householder moved into unit - Moved in 1999 to March 2000 (%) - Hispanic or Latino
Year householder moved into unit - Moved in 1999 to March 2000 (%) - American Indian and Alaska Native
Year householder moved into unit - Moved in 1999 to March 2000 (%) - Multirace
Year householder moved into unit - Moved in 1999 to March 2000 (%) - Other Race
Year householder moved into unit - Moved in 1995 to 1998 (%)
Year householder moved into unit - Moved in 1995 to 1998 (%) - White
Year householder moved into unit - Moved in 1995 to 1998 (%) - Black or African American
Year householder moved into unit - Moved in 1995 to 1998 (%) - Asian
Year householder moved into unit - Moved in 1995 to 1998 (%) - Hispanic or Latino
Year householder moved into unit - Moved in 1995 to 1998 (%) - American Indian and Alaska Native
Year householder moved into unit - Moved in 1995 to 1998 (%) - Multirace
Year householder moved into unit - Moved in 1995 to 1998 (%) - Other Race
Year householder moved into unit - Moved in 1990 to 1994 (%)
Year householder moved into unit - Moved in 1990 to 1994 (%) - White
Year householder moved into unit - Moved in 1990 to 1994 (%) - Black or African American
Year householder moved into unit - Moved in 1990 to 1994 (%) - Asian
Year householder moved into unit - Moved in 1990 to 1994 (%) - Hispanic or Latino
Year householder moved into unit - Moved in 1990 to 1994 (%) - American Indian and Alaska Native
Year householder moved into unit - Moved in 1990 to 1994 (%) - Multirace
Year householder moved into unit - Moved in 1990 to 1994 (%) - Other Race
Year householder moved into unit - Moved in 1980 to 1989 (%)
Year householder moved into unit - Moved in 1980 to 1989 (%) - White
Year householder moved into unit - Moved in 1980 to 1989 (%) - Black or African American
Year householder moved into unit - Moved in 1980 to 1989 (%) - Asian
Year householder moved into unit - Moved in 1980 to 1989 (%) - Hispanic or Latino
Year householder moved into unit - Moved in 1980 to 1989 (%) - American Indian and Alaska Native
Year householder moved into unit - Moved in 1980 to 1989 (%) - Multirace
Year householder moved into unit - Moved in 1980 to 1989 (%) - Other Race
Year householder moved into unit - Moved in 1970 to 1979 (%)
Year householder moved into unit - Moved in 1970 to 1979 (%) - White
Year householder moved into unit - Moved in 1970 to 1979 (%) - Black or African American
Year householder moved into unit - Moved in 1970 to 1979 (%) - Asian
Year householder moved into unit - Moved in 1970 to 1979 (%) - Hispanic or Latino
Year householder moved into unit - Moved in 1970 to 1979 (%) - American Indian and Alaska Native
Year householder moved into unit - Moved in 1970 to 1979 (%) - Multirace
Year householder moved into unit - Moved in 1970 to 1979 (%) - Other Race
Year householder moved into unit - Moved in 1969 or earlier (%)
Year householder moved into unit - Moved in 1969 or earlier (%) - White
Year householder moved into unit - Moved in 1969 or earlier (%) - Black or African American
Year householder moved into unit - Moved in 1969 or earlier (%) - Asian
Year householder moved into unit - Moved in 1969 or earlier (%) - Hispanic or Latino
Year householder moved into unit - Moved in 1969 or earlier (%) - American Indian and Alaska Native
Year householder moved into unit - Moved in 1969 or earlier (%) - Multirace
Year householder moved into unit - Moved in 1969 or earlier (%) - Other Race
Housing units lacking complete plumbing facilities (%)
Housing units lacking complete kitchen facilities (%)
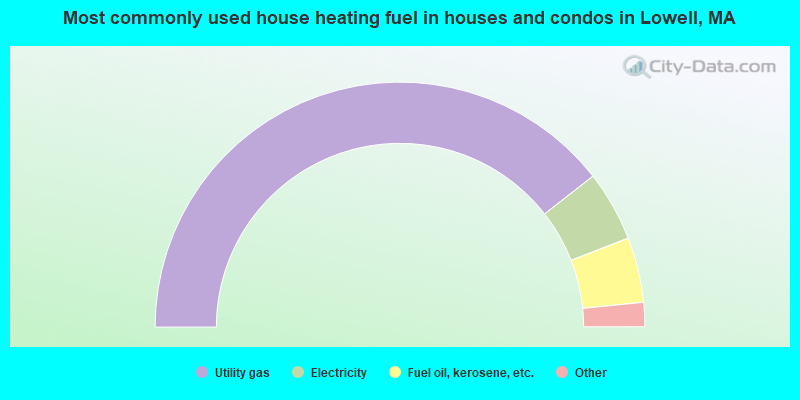
House heating fuel used in houses and condos - Utility gas (%)
House heating fuel used in houses and condos - Bottled, tank, or LP gas (%)
House heating fuel used in houses and condos - Electricity (%)
House heating fuel used in houses and condos - Fuel oil, kerosene, etc. (%)
House heating fuel used in houses and condos - Coal or coke (%)
House heating fuel used in houses and condos - Wood (%)
House heating fuel used in houses and condos - Solar energy (%)
House heating fuel used in houses and condos - Other fuel (%)
House heating fuel used in houses and condos - No fuel used (%)
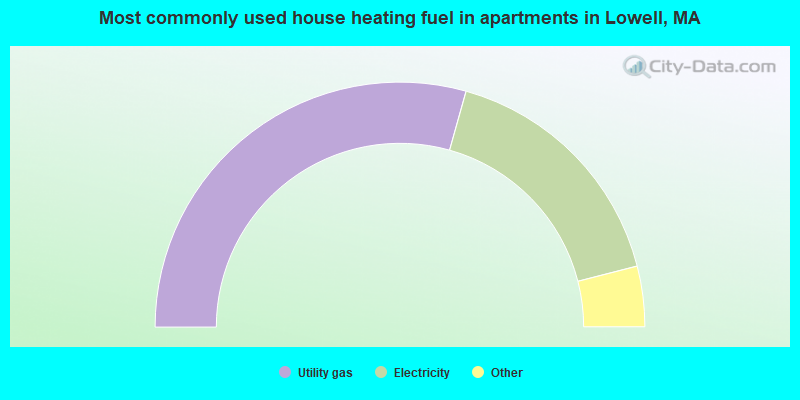
House heating fuel used in apartments - Utility gas (%)
House heating fuel used in apartments - Bottled, tank, or LP gas (%)
House heating fuel used in apartments - Electricity (%)
House heating fuel used in apartments - Fuel oil, kerosene, etc. (%)
House heating fuel used in apartments - Coal or coke (%)
House heating fuel used in apartments - Wood (%)
House heating fuel used in apartments - Solar energy (%)
House heating fuel used in apartments - Other fuel (%)
House heating fuel used in apartments - No fuel used (%)
Latest news about housing in Lowell, MA collected exclusively by city-data.com from local newspapers, TV, and radio stations
Median year house/condo built: 1945Median year apartment built: 1956Household type by relationship:
Households: 113,594
Male householders: 17,327 (4,608 living alone ), Female householders: 23,463 (5,939 living alone )15,257 spouses (15,257 opposite-sex spouses ), 5,832 unmarried partners , (5,566 opposite-sex unmarried partners ), 30,549 children (29,120 natural , 457 adopted , 972 stepchildren ), 2,317 grandchildren , 3,228 brothers or sisters , 2,845 parents , 0 foster children , 1,652 other relatives , 5,763 non-relatives In group quarters: 5,361
Size of family households: 7,200 2-persons , 7,388 3-persons , 6,264 4-persons , 1,893 5-persons , 1,946 6-persons , 755 7-or-more-persons .
Size of nonfamily households: 10,547 1-person , 3,763 2-persons , 249 3-persons , 401 4-persons , 228 5-persons , 156 7-or-more-persons .
11,439 married couples with children. single-parent households (1,550 men , 8,366 women ).
51.2% of residents of Lowell speak English at home. of residents speak Spanish at home (47% speak English very well , 24% speak English well , 18% speak English not well , 12% don't speak English at all ).of residents speak other Indo-European language at home (64% speak English very well , 13% speak English well , 13% speak English not well , 9% don't speak English at all ).of residents speak Asian or Pacific Island language at home (48% speak English very well , 27% speak English well , 20% speak English not well , 6% don't speak English at all ).of residents speak other language at home (72% speak English very well , 28% speak English well ).
Foreign born population: 37,432 (33.0%)of them are naturalized citizens )
Median number of rooms in houses and condos:
Median number of rooms in apartments
Owner-occupied Renter-occupied
Bedrooms in owner-occupied houses and condos in Lowell, Massachusetts
150 no bedroom 337 1 bedroom 4,294 2 bedrooms 9,080 3 bedrooms 3,075 4 bedrooms 1,167 5+ bedrooms
Bedrooms in renter-occupied apartments in Lowell, Massachusetts
1,883 no bedroom 4,655 1 bedroom 9,002 2 bedrooms 5,551 3 bedrooms 1,325 4 bedrooms 271 5+ bedrooms
Owner-occupied Renter-occupied
Rooms in owner-occupied houses in Lowell, Massachusetts
150 1 room 124 2 rooms 208 3 rooms 2,335 4 rooms 4,634 5 rooms 3,032 6 rooms 2,907 7 rooms 2,577 8 rooms 2,136 9+ rooms
Rooms in renter-occupied apartments in Lowell, Massachusetts
1,678 1 room 1,674 2 rooms 3,577 3 rooms 5,834 4 rooms 5,137 5 rooms 3,005 6 rooms 945 7 rooms 422 8 rooms 415 9+ rooms
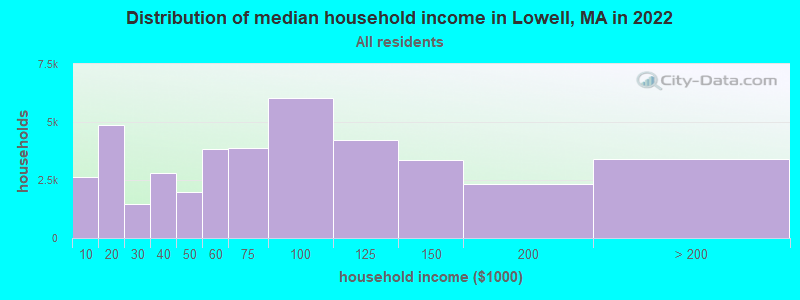
Lowell, MA household income distribution 2,613 Less than $10,0004,870 $10,000 to $19,9991,455 $20,000 to $29,9992,795 $30,000 to $39,9991,974 $40,000 to $49,9993,833 $50,000 to $59,9993,890 $60,000 to $74,9996,022 $75,000 to $99,9994,240 $100,000 to $124,9993,375 $125,000 to $149,9992,315 $150,000 to $199,9993,408 $200,000 or more
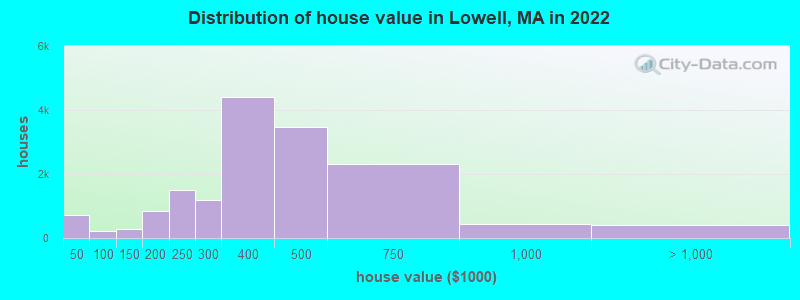
Home value of owner - occupied houses in 2022 in Lowell, MA 408 Less than $10,0009 $10,000 to $14,99918 $20,000 to $24,99911 $25,000 to $29,999113 $30,000 to $34,99910 $35,000 to $39,999132 $40,000 to $49,99937 $50,000 to $59,99911 $70,000 to $79,99944 $80,000 to $89,999183 $100,000 to $124,99995 $125,000 to $149,999328 $150,000 to $174,999506 $175,000 to $199,9991,509 $200,000 to $249,9991,201 $250,000 to $299,9994,410 $300,000 to $399,9993,481 $400,000 to $499,9992,326 $500,000 to $749,999448 $750,000 to $999,999230 $1,000,000 to $1,499,9997 $1,500,000 to $1,999,999176 $2,000,000 or moreRent paid by renters in 2022 in Lowell, MA 196 $100 to $149155 $150 to $199374 $200 to $249751 $250 to $299294 $300 to $349566 $350 to $399403 $400 to $449145 $450 to $499372 $500 to $54949 $550 to $599595 $600 to $649155 $650 to $699418 $700 to $749433 $750 to $799507 $800 to $899960 $900 to $9993,714 $1,000 to $1,2494,839 $1,250 to $1,4995,112 $1,500 to $1,9991,633 $2,000 to $2,499525 $2,500 to $2,99946 $3,000 to $3,499445 No cash rent
Percentage of workers working in this county: 73.0%Number of people working at home: 6,392 (11.1% of all workers )
Travel time to work (commute)
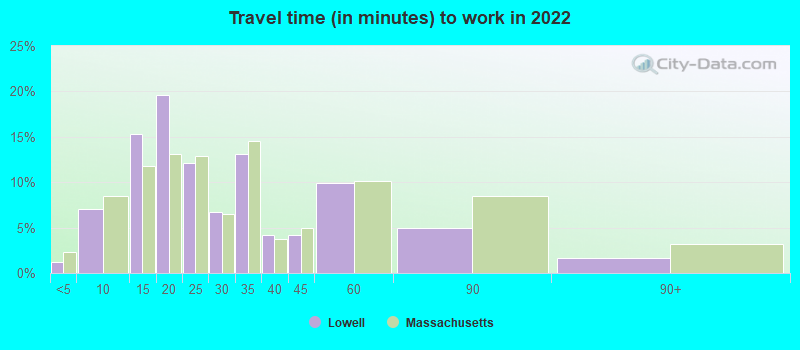
Less than 5 minutes: 3815 to 9 minutes: 2,38910 to 14 minutes: 5,58515 to 19 minutes: 6,76720 to 24 minutes: 7,34925 to 29 minutes: 4,08030 to 34 minutes: 6,58935 to 39 minutes: 2,17340 to 44 minutes: 3,24145 to 59 minutes: 4,51660 to 89 minutes: 3,63990 or more minutes: 641
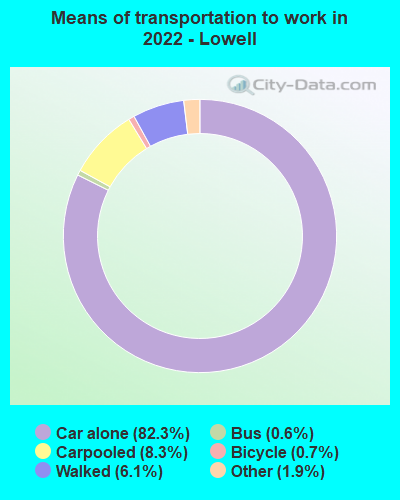
Means of transportation to work:
Drove a car alone: 28,740 (67.7%)Carpooled: 3,036 (7.1%)Bus : 174 (0.4%)Subway or elevated rail : 13 (0.0%)Long-distance train or commuter rail : 14 (0.0%)Taxi: 836 (2.0%)Bicycle: 294 (0.7%)Walked: 2,226 (5.2%)Worked at home: 6,392 (15.0%)
Unemployment by race in 2022
Unemployment rate for White non-Hispanic residents 9.2% Males3.4% FemalesUnemployment rate for Black residents 2.1% Males4.6% FemalesUnemployment rate for American Indian and Alaska Native residents 17.5% FemalesUnemployment rate for Asian residents 1.1% Males2.7% FemalesUnemployment rate for other race residents 10.4% Males1.1% FemalesUnemployment rate for two or more race residents 3.2% Males1.7% FemalesUnemployment rate for Hispanic or Latino residents 5.4% Males3.1% Females
Year of entry for the foreign-born population in Lowell, Massachusetts
13,262 2010 or later 6,508 2000 to 2009 4,837 1990 to 1999 9,944 1980 to 1989 2,033 1970 to 1979 1,743 Before 1970
First ancestries reported:
Irish: 7,537 (10.7%)
Portuguese: 3,220 (4.6%)
Brazilian: 3,004 (4.2%)
Italian: 2,316 (3.3%)
French Canadian: 1,867 (2.6%)
French: 1,835 (2.6%)
American: 1,497 (2.1%)
African: 1,182 (1.7%)
English: 1,081 (1.5%)
Greek: 865 (1.2%)
Sierra Leonean: 860 (1.2%)
German: 771 (1.1%)
Polish: 601 (0.8%)
Moroccan: 414 (0.6%)
Haitian: 409 (0.6%)
Kenyan: 388 (0.5%)
European: 335 (0.5%)
Jamaican: 276 (0.4%)
Nigerian: 259 (0.4%)
Ugandan: 222 (0.3%)
Russian: 205 (0.3%)
Lebanese: 202 (0.3%)
Lithuanian: 180 (0.3%)
Scottish: 178 (0.3%)
Liberian: 162 (0.2%)
Swedish: 161 (0.2%)
Turkish: 157 (0.2%)
Iranian: 144 (0.2%)
Ghanaian: 135 (0.2%)
Albanian: 105 (0.1%)
Armenian: 99 (0.1%)
Cape Verdean: 75 (0.1%)
West Indian: 69 (0.10%)
Canadian: 67 (0.09%)
Syrian: 67 (0.09%)
Eastern European: 63 (0.09%)
Afghan: 61 (0.09%)
Norwegian: 56 (0.08%)
Barbadian: 53 (0.07%)
Scotch-Irish: 50 (0.07%)
Austrian: 44 (0.06%)
Bermudan: 38 (0.05%)
Romanian: 37 (0.05%)
Danish: 36 (0.05%)
Hungarian: 35 (0.05%)
Swiss: 34 (0.05%)
Northern European: 32 (0.05%)
Zimbabwean: 31 (0.04%)
Welsh: 29 (0.04%)
Arab: 27 (0.04%)
British: 23 (0.03%)
Finnish: 23 (0.03%)
Iraqi: 22 (0.03%)
Guyanese: 20 (0.03%)
Somali: 20 (0.03%)
Ukrainian: 20 (0.03%)
Israeli: 16 (0.02%)
U.S. Virgin Islander: 15 (0.02%)
Egyptian: 14 (0.02%)
Dutch: 9 (0.01%)
Slovak: 9 (0.01%)
South African: 6 (0.01%)
Bahamian: 6 (0.01%)
Croatian: 6 (0.01%)
Scandinavian: 4 (0.01%)
Most common places of birth for foreign-born residents (%): Cambodia Lowell:
31.4% (10,721)Massachusetts:
1.2% (14,305)
Brazil Lowell:
11.5% (3,920)Massachusetts:
7.6% (92,959)
Dominican Republic Lowell:
7.7% (2,632)Massachusetts:
8.3% (101,767)
India Lowell:
5.7% (1,958)Massachusetts:
6.8% (82,934)
Laos Lowell:
5.6% (1,894)Massachusetts:
0.2% (2,448)
Colombia Lowell:
5.3% (1,808)Massachusetts:
2.3% (27,810)
Portugal Lowell:
4.9% (1,678)Massachusetts:
4.1% (50,360)
Vietnam Lowell:
4.5% (1,531)Massachusetts:
3.0% (37,197)
Thailand Lowell:
4.1% (1,412)Massachusetts:
0.5% (5,553)
Kenya Lowell:
2.2% (740)Massachusetts:
0.7% (8,746)
Uganda Lowell:
2.0% (690)Massachusetts:
0.4% (5,099)
Burma (Myanmar) Lowell:
1.6% (546)Massachusetts:
0.1% (1,644)
Place of birth for U.S.-born residents:
This state: 58,033Other state: 12,569Northeast: 7,235Midwest: 1,258South: 2,660West: 1,416 87.9% of Lowell residents lived in the same house 1 years ago.
Out of people who lived in different houses, 38.9% lived in this county.
Out of people who lived in different counties, 54.2% lived in Massachusetts.
Lowell:
87.9%State average:
87.7%
Education attainment for males 25 years and older:
No schooling: 1,295Nursery to 4th grade: 4535th and 6th grade: 1457th and 8th grade: 7739th grade: 41010th grade: 62311th grade: 67312th grade, no diploma: 1,171High school graduate (or equivalency): 11,886Less than 1 year of college: 2,362Some college more than 1 year, no degree: 1,753Associate degree: 1,727Bachelor's degree: 7,718Master's degree: 2,533Professional school degree: 238Doctorate degree: 581
Education attainment for females 25 years and older:
No schooling: 2,607Nursery to 4th grade: 9815th and 6th grade: 4257th and 8th grade: 7709th grade: 74210th grade: 66911th grade: 30812th grade, no diploma: 1,037High school graduate (or equivalency): 12,471Less than 1 year of college: 1,520Some college more than 1 year, no degree: 4,120Associate degree: 4,106Bachelor's degree: 6,193Master's degree: 3,614Professional school degree: 234Doctorate degree: 242
Housing units in structures:
One, detached: 14,290One, attached: 3,066Two: 6,5343 or 4: 3,5665 to 9: 4,31310 to 19: 3,72320 to 49: 3,19250 or more: 4,189Boats, RVs, vans, etc.: 71Housing units lacking complete plumbing facilities in 2022: 1.2%Housing units lacking complete kitchen facilities in 2022: 1.3%House/condo owner moved in on average 12 years ago
Renter moved in on average 4 years ago
Private vs. public school enrollment:
Students in private schools in grades 1 to 8 (elementary and middle school): 963 Here:
8.2%Massachusetts:
10.3%
Students in private schools in grades 9 to 12 (high school): 637 Here:
12.5%Massachusetts:
12.3%
Students in private undergraduate colleges: 1,874 Here:
21.1%Massachusetts:
51.2%