Lowell, OH (Ohio) Houses and Residents
| Lowell: | $102,217 |
| Ohio: | $204,100 |
Mean price in 2022:
Detached houses: $109,943
Here: $109,943 State: $254,366 Mobile homes: $86,388
Here: $86,388 State: $62,719
Total population: 550 (Urban population: 0, Rural population: 599 (all nonfarm))
Houses: 294 (216 occupied: 165 owner occupied, 53 renter occupied)
| % of renters here: | 24% |
| State: | 33% |
Housing density: 1,159 houses/condos per square mile
Median price asked for vacant for-sale houses and condos in 2022 in this county: $264,631.
Median contract rent in 2022: $581 (lower quartile is $502, upper quartile is $699)
Median rent asked for vacant for-rent units in 2022: $1,055
Median gross rent in Lowell, OH in 2022: $824
Housing units in Lowell with a mortgage: 42 (3 second mortgage, 0 home equity loan, 0 both second mortgage and home equity loan)
Houses without a mortgage: 0
Median household income for houses/condos with a mortgage: $74,375
Median household income for apartments without a mortgage: $37,714
Median monthly housing costs: $486
Compare current foreclosures near Lowell, OH:
| Photo | Address | Area | Beds / Baths | Price | Details |
|---|---|---|---|---|---|

|
#1
Muskingum River Rd
Lowell, OH 45744
|
- sq. feet
|
- baths - beds |
show details | |

|
#2
4th St
Lowell, OH 45744
|
- sq. feet
|
- baths - beds |
show details | |

|
#3
36th St
Parkersburg, WV 26104
|
1,819 sq. feet
|
2 baths 3 beds |
$59,900
|
show details |

|
#4
Phillips St
Marietta, OH 45750
|
1,210 sq. feet
|
1 baths 3 beds |
$31,900
|
show details |

|
#5
Newells Run Rd
Newport, OH 45768
|
1,722 sq. feet
|
2 baths 3 beds |
$65,000
|
show details |

|
#6
Patten Mills Rd
Stockport, OH 43787
|
1,650 sq. feet
|
1 baths 3 beds |
show details | |

|
#7
Hickory St
Lower Salem, OH 45745
|
864 sq. feet
|
1 baths 2 beds |
show details | |

|
#8
Warren Chapel Rd
Fleming, OH 45729
|
1,248 sq. feet
|
1 baths 3 beds |
show details | |

|
#9
Summit Rd
Marietta, OH 45750
|
1,092 sq. feet
|
1 baths 3 beds |
show details | |

|
#10
Warrior Dr
Vincent, OH 45784
|
1,040 sq. feet
|
1 baths 2 beds |
show details |
| Photo | Address | Area | Beds / Baths | Price | Details |
|---|---|---|---|---|---|

|
#11
19th St
Vienna, WV 26105
|
1,488 sq. feet
|
1 baths 3 beds |
show details | |

|
#12
21st St
Vienna, WV 26105
|
2,040 sq. feet
|
2 baths 4 beds |
show details | |

|
#13
Central Ave
Williamstown, WV 26187
|
1,852 sq. feet
|
3 baths 4 beds |
show details | |

|
#14
Briarwood Pl
Parkersburg, WV 26104
|
2,290 sq. feet
|
2 baths 4 beds |
show details | |

|
#15
Northwood Dr
Parkersburg, WV 26104
|
1,796 sq. feet
|
1 baths 3 beds |
show details | |

|
#16
Lincoln St
Parkersburg, WV 26104
|
1,248 sq. feet
|
1 baths 2 beds |
show details | |

|
#17
42nd St
Parkersburg, WV 26104
|
1,560 sq. feet
|
1 baths 3 beds |
show details | |

|
#18
State Route 676
Stockport, OH 43787
|
1,053 sq. feet
|
- baths 3 beds |
show details | |

|
#19
Browns Rd
Marietta, OH 45750
|
1,944 sq. feet
|
- baths 4 beds |
show details | |

|
#20
Greenhill Rd
Marietta, OH 45750
|
2,016 sq. feet
|
- baths 3 beds |
show details |
| Photo | Address | Area | Beds / Baths | Price | Details |
|---|---|---|---|---|---|

|
#21
Summers Rd
Marietta, OH 45750
|
1,664 sq. feet
|
- baths 5 beds |
show details | |

|
#22
Harvest Run Rd
Marietta, OH 45750
|
1,688 sq. feet
|
- baths 3 beds |
show details | |

|
#23
Wells Ave
Marietta, OH 45750
|
1,512 sq. feet
|
- baths 3 beds |
show details | |

|
#24
Warren Chapel Rd
Fleming, OH 45729
|
1,544 sq. feet
|
- baths 2 beds |
show details | |

|
#25
Warner St
Marietta, OH 45750
|
1,920 sq. feet
|
- baths 4 beds |
show details | |

|
#26
Greene St
Marietta, OH 45750
|
896 sq. feet
|
- baths 2 beds |
show details | |

|
#27
9th St
Marietta, OH 45750
|
1,506 sq. feet
|
- baths 2 beds |
show details | |

|
#28
Maple St
Marietta, OH 45750
|
808 sq. feet
|
- baths 3 beds |
show details | |

|
#29
Muskingum Dr
Marietta, OH 45750
|
1,820 sq. feet
|
- baths 3 beds |
show details | |

|
#30
Terrace Ave
Caldwell, OH 43724
|
- sq. feet
|
- baths - beds |
show details |
| Photo | Address | Area | Beds / Baths | Price | Details |
|---|---|---|---|---|---|

|
#31
Christy Rd
Marietta, OH 45750
|
- sq. feet
|
- baths - beds |
show details | |

|
#32
Oak Grove Rd
Waverly, WV 26184
|
- sq. feet
|
- baths - beds |
show details | |

|
#33
Patten Mills Rd
Cutler, OH 45724
|
- sq. feet
|
- baths - beds |
show details | |

|
#34
Lakeview Dr Apt 312d
Parkersburg, WV 26104
|
- sq. feet
|
- baths - beds |
show details | |

|
#35
Bartlett St
Parkersburg, WV 26104
|
- sq. feet
|
- baths - beds |
show details | |

|
#36
Millgate Rd
Marietta, OH 45750
|
- sq. feet
|
- baths - beds |
show details | |

|
#37
Leland Ave
Marietta, OH 45750
|
- sq. feet
|
- baths - beds |
show details | |

|
#38
Clark St
Marietta, OH 45750
|
- sq. feet
|
- baths - beds |
show details | |

|
#39
17th St
Vienna, WV 26105
|
- sq. feet
|
- baths - beds |
show details | |

|
#40
Victoria Ave Apt 40
Williamstown, WV 26187
|
- sq. feet
|
- baths - beds |
show details |
| Photo | Address | Area | Beds / Baths | Price | Details |
|---|---|---|---|---|---|

|
#41
Marietta Ln
Marietta, OH 45750
|
- sq. feet
|
- baths - beds |
show details | |

|
#42
Emerson Ave
Parkersburg, WV 26104
|
- sq. feet
|
- baths - beds |
show details | |

|
#43
Watertown Rd
Waterford, OH 45786
|
- sq. feet
|
- baths - beds |
show details | |

|
#44
Sandhill Rd
Reno, OH 45773
|
- sq. feet
|
- baths - beds |
show details | |

|
#45
Lebanon Rd
Lower Salem, OH 45745
|
- sq. feet
|
- baths - beds |
show details | |

|
#46
2nd St
Vincent, OH 45784
|
- sq. feet
|
- baths - beds |
show details | |

|
#47
Kittle St
Williamstown, WV 26187
|
- sq. feet
|
- baths - beds |
show details | |

|
#48
Vine St # B
Marietta, OH 45750
|
- sq. feet
|
- baths - beds |
show details | |

|
#49
Melody Ln
Marietta, OH 45750
|
- sq. feet
|
- baths - beds |
show details | |

|
Check over 1 million property listings on Foreclosure.com!
|
browse all offers | |||

Latest news about housing in Lowell, OH collected exclusively by city-data.com from local newspapers, TV, and radio stations

 | North Avondale - nice on the prime streets or still too dangerous? (113 replies) |
| Is Akron a good place to live? (52 replies) |
| Moving to the Cleveland area at the end of the month, looking for quiet suburb with good schools (25 replies) |
| UC Area Safety (56 replies) |
| Gospel churches in Columbus.. (3 replies) |
| Safe neighborhoods to rent near UC (8 replies) |

Median year apartment built: 1954
Household type by relationship:
Households: 505- Male householders: 86 (15 living alone), Female householders: 127 (42 living alone)
94 spouses (94 opposite-sex spouses), 25 unmarried partners, (25 opposite-sex unmarried partners), 140 children (123 natural, 0 adopted, 16 stepchildren), 8 grandchildren, 0 brothers or sisters, 5 parents, 0 foster children, 0 other relatives, 13 non-relatives
Size of family households: 75 2-persons, 53 3-persons, 9 4-persons, 8 5-persons, 5 6-persons.
Size of nonfamily households: 60 1-person, 5 2-persons.
75 married couples with children.
19 single-parent households (9 men, 10 women).
98.7% of residents of Lowell speak English at home.
1.0% of residents speak Asian or Pacific Island language at home (100% speak English very well).
Foreign born population: 6 (1.2%)
(100.0% of them are naturalized citizens)
| Here: | 6.6 |
| State: | 6.7 |
| Here: | 5.5 |
| State: | 4.4 |

- Bedrooms in owner-occupied houses and condos in Lowell, Ohio
- 0no bedroom
- 41 bedroom
- 472 bedrooms
- 813 bedrooms
- 164 bedrooms
- 165+ bedrooms

- Bedrooms in renter-occupied apartments in Lowell, Ohio
- 0no bedroom
- 81 bedroom
- 182 bedrooms
- 203 bedrooms
- 74 bedrooms
- 05+ bedrooms

- Cars and other vehicles available in Lowell in owner-occupied houses/condos
- 19no vehicle
- 671 vehicle
- 472 vehicles
- 243 vehicles
- 74 vehicles
- 05+ vehicles

- Cars and other vehicles available in Lowell in renter-occupied apartments
- 2no vehicle
- 171 vehicle
- 242 vehicles
- 103 vehicles
- 04 vehicles
- 05+ vehicles

- Rooms in owner-occupied houses in Lowell, Ohio
- 01 room
- 32 rooms
- 53 rooms
- 94 rooms
- 115 rooms
- 496 rooms
- 467 rooms
- 228 rooms
- 199+ rooms

- Rooms in renter-occupied apartments in Lowell, Ohio
- 01 room
- 82 rooms
- 23 rooms
- 74 rooms
- 95 rooms
- 156 rooms
- 37 rooms
- 78 rooms
- 29+ rooms


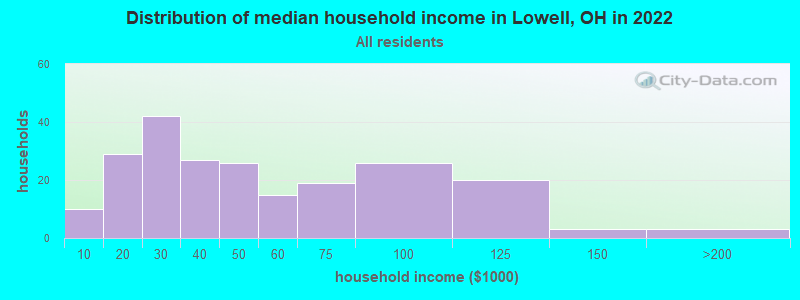
Lowell, OH household income distribution

- 10Less than $10,000
- 29$10,000 to $19,999
- 42$20,000 to $29,999
- 27$30,000 to $39,999
- 26$40,000 to $49,999
- 15$50,000 to $59,999
- 19$60,000 to $74,999
- 26$75,000 to $99,999
- 20$100,000 to $124,999
- 3$125,000 to $149,999
- 3$150,000 to $199,999
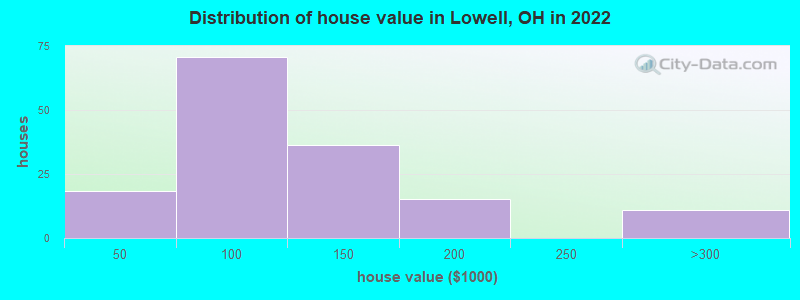
Home value of owner - occupied houses in 2022 in Lowell, OH
-
- 4Less than $10,000
- 10$10,000 to $14,999
- 2$25,000 to $29,999
- 0$40,000 to $49,999
- 5$50,000 to $59,999
- 21$60,000 to $69,999
- 22$70,000 to $79,999
- 9$80,000 to $89,999
- 11$90,000 to $99,999
- 17$100,000 to $124,999
- 19$125,000 to $149,999
- 15$150,000 to $174,999
- 9$250,000 to $299,999
- 1$400,000 to $499,999
Rent paid by renters in 2022 in Lowell, OH
-
- 2$300 to $349
- 1$350 to $399
- 7$450 to $499
- 4$500 to $549
- 11$550 to $599
- 5$600 to $649
- 3$650 to $699
- 2$700 to $749
- 8$750 to $799
- 2No cash rent


Percentage of workers working in this county: 72.8%
Number of people working at home: 1 (0.5% of all workers)
Travel time to work (commute)
- Less than 5 minutes: 8
- 5 to 9 minutes: 25
- 10 to 14 minutes: 5
- 15 to 19 minutes: 33
- 20 to 24 minutes: 66
- 25 to 29 minutes: 20
- 30 to 34 minutes: 14
- 35 to 39 minutes: 3
- 40 to 44 minutes: 13
- 45 to 59 minutes: 5
- 60 to 89 minutes: 3
- 90 or more minutes: 7
Means of transportation to work:
- Drove a car alone: 202 (79.8%)
- Carpooled: 34 (13.4%)
- Walked: 6 (2.4%)
- Other means: 5 (2.0%)
- Worked at home: 6 (2.4%)

- Unemployment by race in 2022
- Unemployment rate for White non-Hispanic residents
- 9.1%Males
- 1.7%Females

- Year of entry for the foreign-born population in Lowell, Ohio
- 72010 or later
- 02000 to 2009
- 01990 to 1999
- 01980 to 1989
- 21970 to 1979
- 2Before 1970

First ancestries reported:
- German: 90 (41.0%)
- American: 39 (17.8%)
- English: 19 (8.7%)
- Irish: 15 (6.8%)
- European: 4 (1.8%)
- Italian: 1 (0.5%)
Most common places of birth for foreign-born residents (%):
| Lowell: | 83.3% (5) |
| Ohio: | 3.1% (17,818) |
Place of birth for U.S.-born residents:
- This state: 400
- Other state: 92
- Northeast: 14
- Midwest: 5
- South: 71
- West: 0
90.8% of Lowell residents lived in the same house 1 years ago.
Out of people who lived in different houses, 31.3% lived in this county.
Out of people who lived in different counties, 84.0% lived in Ohio.
| Lowell: | 90.8% |
| State average: | 87.8% |
Education attainment for males 25 years and older:
- No schooling: 0
- Nursery to 4th grade: 0
- 5th and 6th grade: 4
- 7th and 8th grade: 0
- 9th grade: 0
- 10th grade: 0
- 11th grade: 0
- 12th grade, no diploma: 7
- High school graduate (or equivalency): 81
- Less than 1 year of college: 22
- Some college more than 1 year, no degree: 18
- Associate degree: 7
- Bachelor's degree: 17
- Master's degree: 2
- Professional school degree: 0
- Doctorate degree: 1

Education attainment for females 25 years and older:
- No schooling: 0
- Nursery to 4th grade: 0
- 5th and 6th grade: 0
- 7th and 8th grade: 0
- 9th grade: 0
- 10th grade: 0
- 11th grade: 0
- 12th grade, no diploma: 0
- High school graduate (or equivalency): 96
- Less than 1 year of college: 5
- Some college more than 1 year, no degree: 23
- Associate degree: 30
- Bachelor's degree: 15
- Master's degree: 12
- Professional school degree: 0
- Doctorate degree: 0


Housing units in structures:
- One, detached: 232
- One, attached: 4
- Two: 37
- Mobile homes: 20
Housing units lacking complete kitchen facilities in 2022: 9.2%
House/condo owner moved in on average 23 years ago
Renter moved in on average 3 years ago

Private vs. public school enrollment:
| Here: | 0.0% |
| Ohio: | 16.0% |
| Here: | 16.0% |
| Ohio: | 13.1% |
| Here: | 44.4% |
| Ohio: | 22.3% |


