Lowell, OR (Oregon) Houses and Residents
| Lowell: | $324,142 |
| Oregon: | $475,600 |
Total population: 1,068 (Urban population: 0, Rural population: 857 (all nonfarm))
Houses: 522 (504 occupied: 365 owner occupied, 134 renter occupied)
| % of renters here: | 27% |
| State: | 37% |
Housing density: 567 houses/condos per square mile
Median price asked for vacant for-sale houses and condos in 2022 in this county: $419,450.
Median contract rent in 2022: $765
Median rent asked for vacant for-rent units in 2022: $651
Median gross rent in Lowell, OR in 2022: $1,008
Housing units in Lowell with a mortgage: 262 (20 second mortgage, 12 home equity loan, 0 both second mortgage and home equity loan)
Houses without a mortgage: 0
Median household income for houses/condos with a mortgage: $91,029
Median household income for apartments without a mortgage: $34,653
Median monthly housing costs: $1,149
Compare current foreclosures near Lowell, OR:
| Photo | Address | Area | Beds / Baths | Price | Details |
|---|---|---|---|---|---|

|
#1
Carol St
Lowell, OR 97452
|
1,345 sq. feet
|
2 baths 3 beds |
show details | |

|
#2
E Main St
Lowell, OR 97452
|
1,607 sq. feet
|
2 baths 3 beds |
show details | |

|
#3
N Moss St
Lowell, OR 97452
|
- sq. feet
|
2 baths 3 beds |
show details | |

|
#4
Rockcrest Dr
Lowell, OR 97452
|
- sq. feet
|
- baths - beds |
show details | |

|
#5
Wetleau Dr
Lowell, OR 97452
|
- sq. feet
|
- baths - beds |
show details | |

|
#6
Van Duyn St
Eugene, OR 97401
|
2,192 sq. feet
|
2 baths 4 beds |
show details | |

|
#7
14th St
Springfield, OR 97477
|
1,916 sq. feet
|
3 baths 4 beds |
show details | |

|
#8
Osage St
Springfield, OR 97478
|
2,016 sq. feet
|
2 baths 4 beds |
show details | |

|
#9
Hillview Dr
Creswell, OR 97426
|
1,878 sq. feet
|
3 baths 3 beds |
show details | |

|
#10
Tamarack St
Springfield, OR 97477
|
1,465 sq. feet
|
1 baths 3 beds |
show details |
| Photo | Address | Area | Beds / Baths | Price | Details |
|---|---|---|---|---|---|

|
#11
Parks Rd
Cottage Grove, OR 97424
|
1,869 sq. feet
|
1 baths 2 beds |
show details | |

|
#12
57th St
Springfield, OR 97478
|
876 sq. feet
|
1 baths 3 beds |
show details | |

|
#13
S 3rd St
Creswell, OR 97426
|
1,382 sq. feet
|
1 baths 2 beds |
show details | |

|
#14
D St
Springfield, OR 97478
|
960 sq. feet
|
1 baths 3 beds |
show details | |

|
#15
Dixie Dr
Springfield, OR 97478
|
1,329 sq. feet
|
2 baths 3 beds |
show details | |

|
#16
37th St
Springfield, OR 97477
|
1,285 sq. feet
|
2 baths 3 beds |
show details | |

|
#17
F St
Springfield, OR 97477
|
1,124 sq. feet
|
1 baths 4 beds |
show details | |

|
#18
D St
Springfield, OR 97477
|
2,816 sq. feet
|
3 baths 7 beds |
show details | |

|
#19
Winslow Ave
Springfield, OR 97477
|
1,729 sq. feet
|
2 baths 3 beds |
show details | |

|
#20
21st St
Springfield, OR 97477
|
2,438 sq. feet
|
2 baths 4 beds |
show details |
| Photo | Address | Area | Beds / Baths | Price | Details |
|---|---|---|---|---|---|

|
#21
N St
Springfield, OR 97477
|
1,374 sq. feet
|
1 baths 4 beds |
show details | |

|
#22
19th St
Springfield, OR 97477
|
880 sq. feet
|
1 baths 2 beds |
show details | |

|
#23
Ash Grove Loop
Creswell, OR 97426
|
1,442 sq. feet
|
2 baths 3 beds |
show details | |

|
#24
21st St
Springfield, OR 97477
|
976 sq. feet
|
1 baths 3 beds |
show details | |

|
#25
E St
Springfield, OR 97477
|
1,163 sq. feet
|
1 baths 3 beds |
show details | |

|
#26
33rd St
Springfield, OR 97478
|
1,149 sq. feet
|
1 baths 3 beds |
show details | |

|
#27
El Camino St
Eugene, OR 97405
|
1,010 sq. feet
|
2 baths - beds |
show details | |

|
#28
16th St
Springfield, OR 97477
|
1,296 sq. feet
|
1 baths 2 beds |
show details | |

|
#29
Camellia St
Springfield, OR 97478
|
1,216 sq. feet
|
1 baths 2 beds |
show details | |

|
#30
Barber Dr
Creswell, OR 97426
|
1,372 sq. feet
|
2 baths 3 beds |
show details |
| Photo | Address | Area | Beds / Baths | Price | Details |
|---|---|---|---|---|---|

|
#31
S Redwood Dr
Springfield, OR 97478
|
2,148 sq. feet
|
2 baths 4 beds |
show details | |

|
#32
E St
Springfield, OR 97478
|
1,892 sq. feet
|
2 baths 4 beds |
show details | |

|
#33
D St
Springfield, OR 97478
|
1,344 sq. feet
|
1 baths 3 beds |
show details | |

|
#34
W F St
Creswell, OR 97426
|
1,088 sq. feet
|
1 baths 3 beds |
show details | |

|
#35
Lynx Hollow Rd
Creswell, OR 97426
|
1,124 sq. feet
|
1 baths 3 beds |
show details | |

|
#36
4th St
Springfield, OR 97477
|
1,454 sq. feet
|
1 baths 3 beds |
show details | |

|
#37
Viewmont Ave
Springfield, OR 97477
|
1,547 sq. feet
|
2 baths 3 beds |
show details | |

|
#38
Cottonwood Ave
Springfield, OR 97477
|
1,056 sq. feet
|
1 baths 3 beds |
show details | |

|
#39
S 6th St
Cottage Grove, OR 97424
|
2,076 sq. feet
|
2 baths 4 beds |
show details | |

|
#40
Sunset Dr
Cottage Grove, OR 97424
|
2,063 sq. feet
|
2 baths 3 beds |
show details |
| Photo | Address | Area | Beds / Baths | Price | Details |
|---|---|---|---|---|---|

|
#41
S 1st St
Cottage Grove, OR 97424
|
998 sq. feet
|
1 baths 2 beds |
show details | |

|
#42
E Madison Ave
Cottage Grove, OR 97424
|
3,896 sq. feet
|
2 baths 5 beds |
show details | |

|
#43
E 39th Pl
Eugene, OR 97405
|
1,224 sq. feet
|
1 baths 3 beds |
show details | |

|
#44
Oakdale Ave
Springfield, OR 97477
|
4,389 sq. feet
|
6 baths 6 beds |
show details | |

|
#45
E Harrison Ave
Cottage Grove, OR 97424
|
936 sq. feet
|
1 baths 2 beds |
show details | |

|
#46
Tyler Ave
Cottage Grove, OR 97424
|
1,416 sq. feet
|
1 baths 3 beds |
show details | |

|
#47
N 9th St
Cottage Grove, OR 97424
|
1,858 sq. feet
|
1 baths 3 beds |
show details | |

|
#48
Saratoga St
Eugene, OR 97405
|
1,918 sq. feet
|
3 baths 4 beds |
show details | |

|
#49
S 16th St
Cottage Grove, OR 97424
|
1,092 sq. feet
|
1 baths 3 beds |
show details | |

|
Check over 1 million property listings on Foreclosure.com!
|
browse all offers | |||

Latest news about housing in Lowell, OR collected exclusively by city-data.com from local newspapers, TV, and radio stations

 | Curious about buying homes in Salem/Marion county (15 replies) |
| How "Hippie" Is Sweet Home? (9 replies) |
| Blindly moving to the area.. (9 replies) |
| Springfield vs Eugene? (29 replies) |
| Apartment Search NW/SW (15 replies) |
| Any Portlanders From Hawai'i Out There? Aloha Spirit Guide And Thread For Portland. (71 replies) |

Median year apartment built: 1969
Household type by relationship:
Households: 1,211- Male householders: 224 (55 living alone), Female householders: 271 (34 living alone)
281 spouses (274 opposite-sex spouses), 55 unmarried partners, (55 opposite-sex unmarried partners), 338 children (322 natural, 5 adopted, 11 stepchildren), 2 grandchildren, 3 brothers or sisters, 0 parents, 0 foster children, 5 other relatives, 32 non-relatives
Size of family households: 196 2-persons, 54 3-persons, 57 4-persons, 10 5-persons, 3 6-persons, 2 7-or-more-persons.
Size of nonfamily households: 105 1-person, 64 2-persons.
150 married couples with children.
103 single-parent households (73 men, 30 women).
98.4% of residents of Lowell speak English at home.
1.7% of residents speak Spanish at home (10% speak English very well, 90% speak English well).
0.2% of residents speak other language at home (100% speak English very well).
Foreign born population: 78 (6.4%)
(84.6% of them are naturalized citizens)
| Here: | 5.5 |
| State: | 6.2 |
| Here: | 4.3 |
| State: | 4.0 |

- Bedrooms in owner-occupied houses and condos in Lowell, Oregon
- 0no bedroom
- 41 bedroom
- 642 bedrooms
- 2503 bedrooms
- 444 bedrooms
- 45+ bedrooms

- Bedrooms in renter-occupied apartments in Lowell, Oregon
- 0no bedroom
- 41 bedroom
- 822 bedrooms
- 353 bedrooms
- 134 bedrooms
- 05+ bedrooms

- Cars and other vehicles available in Lowell in owner-occupied houses/condos
- 0no vehicle
- 291 vehicle
- 1582 vehicles
- 1093 vehicles
- 504 vehicles
- 205+ vehicles

- Cars and other vehicles available in Lowell in renter-occupied apartments
- 0no vehicle
- 661 vehicle
- 692 vehicles
- 03 vehicles
- 04 vehicles
- 05+ vehicles

- Rooms in owner-occupied houses in Lowell, Oregon
- 01 room
- 02 rooms
- 173 rooms
- 754 rooms
- 915 rooms
- 586 rooms
- 827 rooms
- 198 rooms
- 249+ rooms

- Rooms in renter-occupied apartments in Lowell, Oregon
- 01 room
- 02 rooms
- 113 rooms
- 574 rooms
- 505 rooms
- 06 rooms
- 07 rooms
- 08 rooms
- 179+ rooms


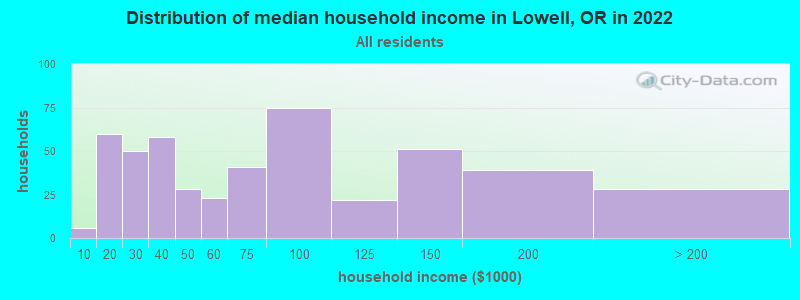
Lowell, OR household income distribution

- 6Less than $10,000
- 60$10,000 to $19,999
- 50$20,000 to $29,999
- 58$30,000 to $39,999
- 28$40,000 to $49,999
- 23$50,000 to $59,999
- 41$60,000 to $74,999
- 75$75,000 to $99,999
- 22$100,000 to $124,999
- 51$125,000 to $149,999
- 39$150,000 to $199,999
- 28$200,000 or more
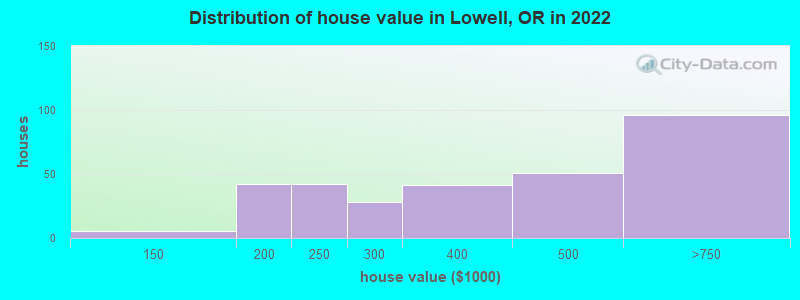
Home value of owner - occupied houses in 2022 in Lowell, OR
-
- 5$125,000 to $149,999
- 11$150,000 to $174,999
- 30$175,000 to $199,999
- 42$200,000 to $249,999
- 28$250,000 to $299,999
- 41$300,000 to $399,999
- 50$400,000 to $499,999
- 96$500,000 to $749,999
Rent paid by renters in 2022 in Lowell, OR
-
- 11Less than $100
- 6$250 to $299
- 3$600 to $649
- 19$700 to $749
- 7$800 to $899
- 4$900 to $999
- 10$1,000 to $1,249
- 13$1,250 to $1,499
- 50No cash rent


Percentage of workers working in this county: 99.2%
Number of people working at home: 37 (7.0% of all workers)
Travel time to work (commute)
- Less than 5 minutes: 10
- 5 to 9 minutes: 2
- 10 to 14 minutes: 0
- 15 to 19 minutes: 23
- 20 to 24 minutes: 67
- 25 to 29 minutes: 91
- 30 to 34 minutes: 237
- 35 to 39 minutes: 6
- 40 to 44 minutes: 0
- 45 to 59 minutes: 20
- 60 to 89 minutes: 6
- 90 or more minutes: 28
Means of transportation to work:
- Drove a car alone: 293 (74.4%)
- Carpooled: 62 (15.7%)
- Bus or trolley bus: 5 (1.3%)
- Walked: 15 (3.8%)
- Worked at home: 19 (4.8%)

- Unemployment by race in 2022
- Unemployment rate for White non-Hispanic residents
- 3.1%Males

- Year of entry for the foreign-born population in Lowell, Oregon
- 02010 or later
- 02000 to 2009
- 21990 to 1999
- 01980 to 1989
- 21970 to 1979
- 9Before 1970

First ancestries reported:
- English: 61 (22.5%)
- German: 24 (8.8%)
- Northern European: 24 (8.8%)
- British: 11 (4.1%)
- Scandinavian: 10 (3.7%)
- European: 7 (2.6%)
- Irish: 6 (2.2%)
- Scottish: 6 (2.2%)
- American: 4 (1.5%)
Most common places of birth for foreign-born residents (%):
| Lowell: | 68.8% (53) |
| Oregon: | 1.5% (6,313) |
| Lowell: | 22.1% (17) |
| Oregon: | 33.9% (140,109) |
| Lowell: | 6.5% (5) |
| Oregon: | 3.7% (15,229) |
| Lowell: | 2.6% (2) |
| Oregon: | 3.5% (14,530) |
Place of birth for U.S.-born residents:
- This state: 609
- Other state: 521
- Northeast: 26
- Midwest: 71
- South: 55
- West: 371
87.2% of Lowell residents lived in the same house 1 years ago.
Out of people who lived in different houses, 42.6% lived in this county.
Out of people who lived in different counties, 76.9% lived in Oregon.
| Lowell: | 87.2% |
| State average: | 85.5% |
Education attainment for males 25 years and older:
- No schooling: 0
- Nursery to 4th grade: 12
- 5th and 6th grade: 26
- 7th and 8th grade: 0
- 9th grade: 0
- 10th grade: 14
- 11th grade: 2
- 12th grade, no diploma: 13
- High school graduate (or equivalency): 137
- Less than 1 year of college: 54
- Some college more than 1 year, no degree: 98
- Associate degree: 54
- Bachelor's degree: 16
- Master's degree: 31
- Professional school degree: 0
- Doctorate degree: 0

Education attainment for females 25 years and older:
- No schooling: 0
- Nursery to 4th grade: 0
- 5th and 6th grade: 0
- 7th and 8th grade: 0
- 9th grade: 8
- 10th grade: 10
- 11th grade: 4
- 12th grade, no diploma: 2
- High school graduate (or equivalency): 98
- Less than 1 year of college: 48
- Some college more than 1 year, no degree: 100
- Associate degree: 47
- Bachelor's degree: 65
- Master's degree: 20
- Professional school degree: 14
- Doctorate degree: 2


Housing units in structures:
- One, detached: 383
- One, attached: 13
- Two: 11
- 5 to 9: 10
- 10 to 19: 11
- Mobile homes: 92
Median worth of mobile homes: $251,181
House/condo owner moved in on average 10 years ago
Renter moved in on average 1 years ago

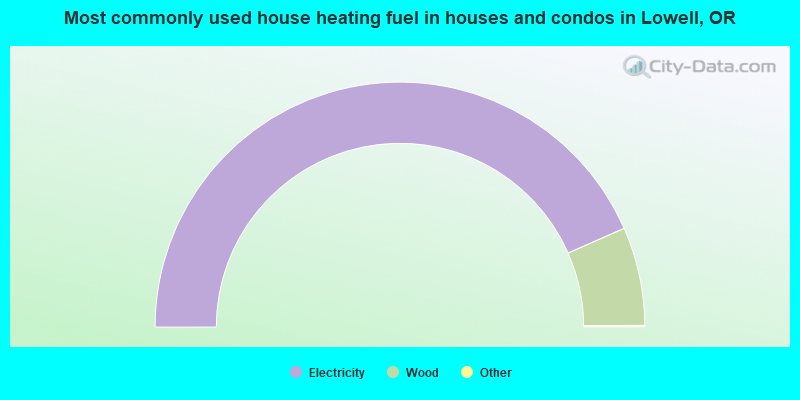
- 87.0%Electricity
- 13.0%Wood
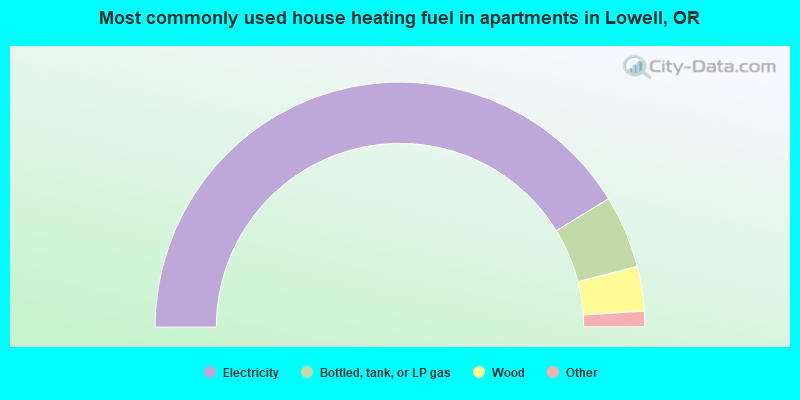
- 84.2%Electricity
- 9.8%Bottled, tank, or LP gas
- 6.0%Wood
Private vs. public school enrollment:
| Here: | 0.0% |
| Oregon: | 13.7% |
| Here: | 22.9% |
| Oregon: | 8.8% |
| Here: | 14.3% |
| Oregon: | 17.7% |


