Lucerne, CA (California) Houses and Residents
| Lucerne: | $245,065 |
| California: | $715,900 |
Mean price in 2022:
Detached houses: $473,880
Here: $473,880 State: $988,808 Mobile homes: $176,181
Here: $176,181 State: $184,506
Total population: 3,067 (Urban population: 2,323 (all inside urban clusters), Rural population: 639 (all nonfarm))
Houses: 1,951 (1,399 occupied: 892 owner occupied, 534 renter occupied)
| % of renters here: | 37% |
| State: | 44% |
Housing density: 319 houses/condos per square mile
Median price asked for vacant for-sale houses and condos in 2022: $327,082.
Median contract rent in 2022: $662 (lower quartile is $617, upper quartile is $1,091)
Median rent asked for vacant for-rent units in 2022: $530
Median gross rent in Lucerne, CA in 2022: $1,000
Housing units in Lucerne with a mortgage: 447 (20 second mortgage, 0 home equity loan, 0 both second mortgage and home equity loan)
Houses without a mortgage: 0
Median household income for houses/condos with a mortgage: $42,362
Median household income for apartments without a mortgage: $51,744
Median monthly housing costs: $872
Compare current foreclosures near Lucerne, CA:
| Photo | Address | Area | Beds / Baths | Price | Details |
|---|---|---|---|---|---|

|
#1
Highland Ave
Lucerne, CA 95458
|
- sq. feet
|
- baths - beds |
show details | |

|
#2
E Highway 20
Lucerne, CA 95458
|
- sq. feet
|
- baths - beds |
show details | |

|
#3
E State Highway 20
Lucerne, CA 95458
|
- sq. feet
|
- baths - beds |
show details | |

|
#4
Soda Bay Rd
Kelseyville, CA 95451
|
1,808 sq. feet
|
2 baths 2 beds |
$695,000
|
show details |

|
#5
11th St
Lakeport, CA 95453
|
746 sq. feet
|
1 baths 3 beds |
$170,000
|
show details |

|
#6
First Street
Clearlake Oaks, CA 95423
|
700 sq. feet
|
1 baths 2 beds |
show details | |

|
#7
Bonham Rd
Lower Lake, CA 95457
|
2,176 sq. feet
|
2 baths 3 beds |
show details | |

|
#8
40th Ave
Clearlake, CA 95422
|
968 sq. feet
|
1 baths 2 beds |
show details | |

|
#9
Wilder Ave
Clearlake, CA 95422
|
852 sq. feet
|
1 baths 2 beds |
show details | |

|
#10
Hillcrest Ave
Clearlake, CA 95422
|
847 sq. feet
|
1 baths 2 beds |
show details |
| Photo | Address | Area | Beds / Baths | Price | Details |
|---|---|---|---|---|---|

|
#11
Hilltop Dr
Kelseyville, CA 95451
|
2,023 sq. feet
|
2 baths 3 beds |
show details | |

|
#12
Konocti Rd
Kelseyville, CA 95451
|
1,222 sq. feet
|
1 baths 2 beds |
show details | |

|
#13
Westlake Ct
Kelseyville, CA 95451
|
2,309 sq. feet
|
3 baths 3 beds |
show details | |

|
#14
Boggs Ln
Lakeport, CA 95453
|
1,912 sq. feet
|
2 baths 3 beds |
show details | |

|
#15
Crump Avenue
Nice, CA 95464
|
- sq. feet
|
1 baths 2 beds |
show details | |

|
#16
Peach Way
Clearlake Oaks, CA 95423
|
2,052 sq. feet
|
2 baths 3 beds |
show details | |

|
#17
Westlake Ct
Kelseyville, CA 95451
|
2,309 sq. feet
|
2 baths 3 beds |
show details | |

|
#18
Riggs Rd
Lakeport, CA 95453
|
1,647 sq. feet
|
1 baths 3 beds |
show details | |

|
#19
Yaquima Dr
Kelseyville, CA 95451
|
1,456 sq. feet
|
2 baths 3 beds |
show details | |

|
#20
Cedar Ave
Clearlake, CA 95422
|
- sq. feet
|
- baths - beds |
$19,950
|
show details |
| Photo | Address | Area | Beds / Baths | Price | Details |
|---|---|---|---|---|---|

|
#21
Del Monte Way
Kelseyville, CA 95451
|
960 sq. feet
|
- baths 2 beds |
show details | |

|
#22
Lakeview Dr
Nice, CA 95464
|
- sq. feet
|
- baths - beds |
show details | |

|
#23
Seigler Canyon Rd
Middletown, CA 95461
|
- sq. feet
|
- baths - beds |
show details | |

|
#24
Seigler Canyon Rd
Lower Lake, CA 95457
|
- sq. feet
|
- baths - beds |
show details | |

|
#25
Eastlake Dr
Kelseyville, CA 95451
|
- sq. feet
|
- baths - beds |
show details | |

|
#26
4th St
Clearlake Oaks, CA 95423
|
- sq. feet
|
- baths - beds |
show details | |

|
#27
Jefferson St
Clearlake, CA 95422
|
- sq. feet
|
- baths - beds |
show details | |

|
#28
E State Highway 20, Spc 65
Upper Lake, CA 95485
|
- sq. feet
|
- baths - beds |
show details | |

|
#29
Hok Has Ha Ln # B
Kelseyville, CA 95451
|
- sq. feet
|
- baths - beds |
show details | |

|
#30
State Highway 281 # 5084
Kelseyville, CA 95451
|
- sq. feet
|
- baths - beds |
show details |
| Photo | Address | Area | Beds / Baths | Price | Details |
|---|---|---|---|---|---|

|
#31
First St, # 93
Clearlake Oaks, CA 95423
|
- sq. feet
|
- baths - beds |
show details | |

|
#32
Lakeport Blvd # 304
Lakeport, CA 95453
|
- sq. feet
|
- baths - beds |
show details | |

|
#33
Ellen Springs Rd
Lower Lake, CA 95457
|
- sq. feet
|
- baths - beds |
show details | |

|
#34
Jago Ave
Clearlake, CA 95422
|
- sq. feet
|
- baths - beds |
show details | |

|
Check over 1 million property listings on Foreclosure.com!
|
browse all offers | |||

Latest news about housing in Lucerne, CA collected exclusively by city-data.com from local newspapers, TV, and radio stations


Median year apartment built: 1978
Household type by relationship:
Households: 3,092- Male householders: 653 (221 living alone), Female householders: 746 (349 living alone)
549 spouses (541 opposite-sex spouses), 119 unmarried partners, (119 opposite-sex unmarried partners), 673 children (652 natural, 21 adopted, 0 stepchildren), 113 grandchildren, 15 brothers or sisters, 0 parents, 0 foster children, 33 other relatives, 183 non-relatives
- In group quarters: 5
Size of family households: 370 2-persons, 271 3-persons, 48 4-persons, 23 6-persons, 12 7-or-more-persons.
Size of nonfamily households: 667 1-person, 43 2-persons, 71 3-persons.
203 married couples with children.
117 single-parent households (39 men, 78 women).
89.4% of residents of Lucerne speak English at home.
4.8% of residents speak Spanish at home (73% speak English very well, 25% speak English not well, 2% don't speak English at all).
5.1% of residents speak other Indo-European language at home (92% speak English very well, 8% speak English well).
0.2% of residents speak other language at home (100% speak English very well).
Foreign born population: 254 (8.2%)
(81.1% of them are naturalized citizens)
| Here: | 4.7 |
| State: | 6.0 |
| Here: | 3.9 |
| State: | 3.9 |

- Bedrooms in owner-occupied houses and condos in Lucerne, California
- 108no bedroom
- 491 bedroom
- 4622 bedrooms
- 1783 bedrooms
- 964 bedrooms
- 05+ bedrooms

- Bedrooms in renter-occupied apartments in Lucerne, California
- 34no bedroom
- 441 bedroom
- 3992 bedrooms
- 423 bedrooms
- 04 bedrooms
- 155+ bedrooms

- Cars and other vehicles available in Lucerne in owner-occupied houses/condos
- 137no vehicle
- 2841 vehicle
- 2792 vehicles
- 1313 vehicles
- 134 vehicles
- 495+ vehicles

- Cars and other vehicles available in Lucerne in renter-occupied apartments
- 54no vehicle
- 1011 vehicle
- 1012 vehicles
- 1893 vehicles
- 894 vehicles
- 05+ vehicles

- Rooms in owner-occupied houses in Lucerne, California
- 1081 room
- 02 rooms
- 633 rooms
- 1404 rooms
- 3665 rooms
- 1496 rooms
- 397 rooms
- 288 rooms
- 09+ rooms

- Rooms in renter-occupied apartments in Lucerne, California
- 281 room
- 142 rooms
- 1223 rooms
- 1054 rooms
- 2085 rooms
- 426 rooms
- 07 rooms
- 08 rooms
- 159+ rooms


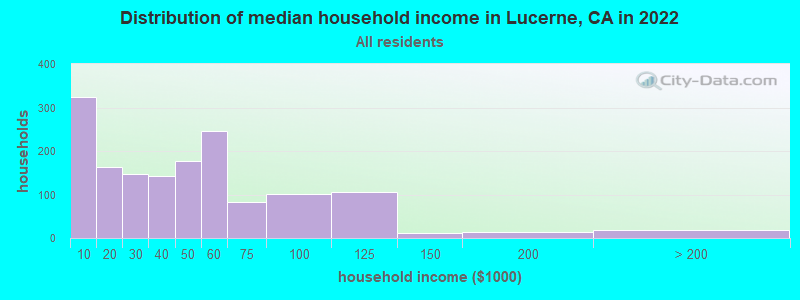
Lucerne, CA household income distribution

- 323Less than $10,000
- 163$10,000 to $19,999
- 147$20,000 to $29,999
- 143$30,000 to $39,999
- 176$40,000 to $49,999
- 245$50,000 to $59,999
- 83$60,000 to $74,999
- 102$75,000 to $99,999
- 105$100,000 to $124,999
- 12$125,000 to $149,999
- 13$150,000 to $199,999
- 18$200,000 or more
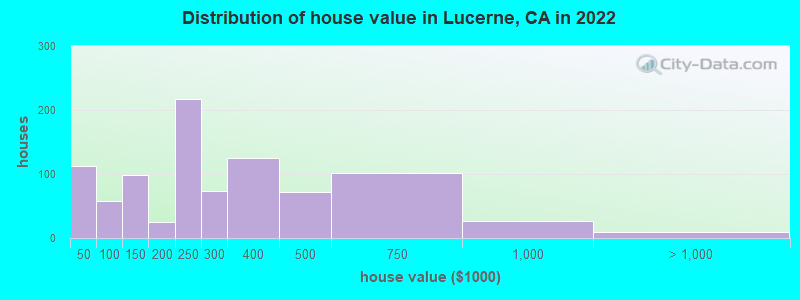
Home value of owner - occupied houses in 2022 in Lucerne, CA
-
- 103Less than $10,000
- 8$15,000 to $19,999
- 54$60,000 to $69,999
- 3$80,000 to $89,999
- 88$100,000 to $124,999
- 9$125,000 to $149,999
- 24$175,000 to $199,999
- 217$200,000 to $249,999
- 73$250,000 to $299,999
- 124$300,000 to $399,999
- 72$400,000 to $499,999
- 102$500,000 to $749,999
- 25$750,000 to $999,999
- 9$2,000,000 or more
Rent paid by renters in 2022 in Lucerne, CA
-
- 13$250 to $299
- 69$400 to $449
- 10$550 to $599
- 194$600 to $649
- 17$700 to $749
- 58$800 to $899
- 75$1,000 to $1,249
- 31$1,250 to $1,499
- 93$2,500 to $2,999


Percentage of workers working in this county: 90.2%
Number of people working at home: 259 (20.9% of all workers)
Travel time to work (commute)
- Less than 5 minutes: 44
- 5 to 9 minutes: 216
- 10 to 14 minutes: 7
- 15 to 19 minutes: 99
- 20 to 24 minutes: 183
- 25 to 29 minutes: 40
- 30 to 34 minutes: 99
- 35 to 39 minutes: 0
- 40 to 44 minutes: 34
- 45 to 59 minutes: 35
- 60 to 89 minutes: 69
- 90 or more minutes: 85
Means of transportation to work:
- Drove a car alone: 640 (75.0%)
- Carpooled: 162 (19.0%)
- Walked: 18 (2.1%)
- Worked at home: 33 (3.9%)

- Unemployment by race in 2022
- Unemployment rate for White non-Hispanic residents
- 10.6%Males
- 6.6%Females
- Unemployment rate for Asian residents
- 45.4%Females
- Unemployment rate for other race residents
- 36.9%Males
- Unemployment rate for Hispanic or Latino residents
- 32.7%Males

- Year of entry for the foreign-born population in Lucerne, California
- 1172010 or later
- 402000 to 2009
- 731990 to 1999
- 191980 to 1989
- 01970 to 1979
- 16Before 1970

First ancestries reported:
- Irish: 133 (10.9%)
- European: 119 (9.8%)
- American: 87 (7.1%)
- Italian: 63 (5.2%)
- Scottish: 60 (4.9%)
- German: 50 (4.1%)
- Dutch: 46 (3.8%)
- Afghan: 41 (3.4%)
- English: 39 (3.2%)
- Norwegian: 23 (1.9%)
- Yugoslavian: 20 (1.6%)
- Northern European: 14 (1.2%)
Most common places of birth for foreign-born residents (%):
| Lucerne: | 43.4% (129) |
| California: | 0.5% (53,260) |
| Lucerne: | 21.5% (64) |
| California: | 0.5% (49,399) |
| Lucerne: | 14.1% (42) |
| California: | 37.2% (3,881,193) |
| Lucerne: | 8.8% (26) |
| California: | 0.6% (60,582) |
| Lucerne: | 6.4% (19) |
| California: | 0.7% (73,304) |
| Lucerne: | 6.4% (19) |
| California: | 0.3% (33,937) |
| Lucerne: | 2.7% (8) |
| California: | 0.2% (23,338) |
Place of birth for U.S.-born residents:
- This state: 2,095
- Other state: 740
- Northeast: 91
- Midwest: 180
- South: 166
- West: 284
86.1% of Lucerne residents lived in the same house 1 years ago.
Out of people who lived in different houses, 35.7% lived in this county.
Out of people who lived in different counties, 92.6% lived in California.
| Lucerne: | 86.1% |
| State average: | 88.9% |
Education attainment for males 25 years and older:
- No schooling: 9
- Nursery to 4th grade: 0
- 5th and 6th grade: 18
- 7th and 8th grade: 0
- 9th grade: 0
- 10th grade: 0
- 11th grade: 59
- 12th grade, no diploma: 67
- High school graduate (or equivalency): 368
- Less than 1 year of college: 76
- Some college more than 1 year, no degree: 238
- Associate degree: 83
- Bachelor's degree: 22
- Master's degree: 65
- Professional school degree: 12
- Doctorate degree: 68

Education attainment for females 25 years and older:
- No schooling: 0
- Nursery to 4th grade: 0
- 5th and 6th grade: 0
- 7th and 8th grade: 4
- 9th grade: 43
- 10th grade: 41
- 11th grade: 23
- 12th grade, no diploma: 15
- High school graduate (or equivalency): 288
- Less than 1 year of college: 97
- Some college more than 1 year, no degree: 262
- Associate degree: 136
- Bachelor's degree: 90
- Master's degree: 96
- Professional school degree: 0
- Doctorate degree: 0


Housing units in structures:
- One, detached: 1,111
- One, attached: 50
- Two: 95
- 3 or 4: 7
- 20 to 49: 15
- Mobile homes: 655
- Boats, RVs, vans, etc.: 18
Housing units lacking complete kitchen facilities in 2022: 4.1%
House/condo owner moved in on average 9 years ago
Renter moved in on average 1 years ago

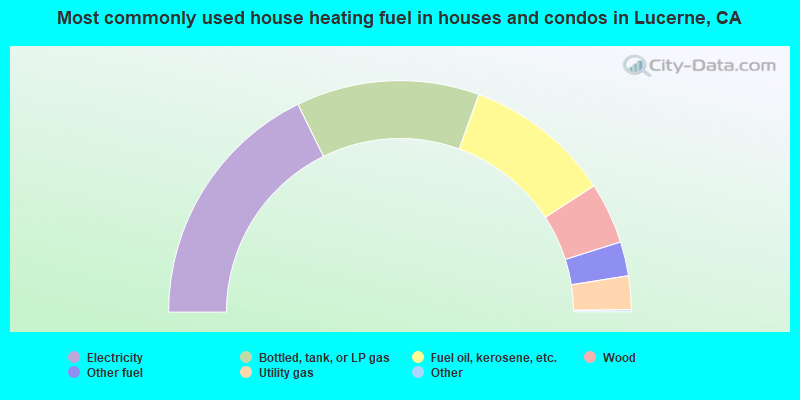
- 35.6%Electricity
- 25.7%Bottled, tank, or LP gas
- 20.6%Fuel oil, kerosene, etc.
- 8.6%Wood
- 4.8%Other fuel
- 4.7%Utility gas

- 59.5%Electricity
- 33.3%Wood
- 4.0%Other fuel
- 2.1%Bottled, tank, or LP gas
- 1.1%Fuel oil, kerosene, etc.
Private vs. public school enrollment:
| Here: | 3.0% |
| California: | 10.5% |
| Here: | 0.0% |
| California: | 8.5% |
| Here: | 13.9% |
| California: | 15.9% |


