Lufkin, TX (Texas) Houses and Residents
| Lufkin: | $180,865 |
| Texas: | $275,400 |
Mean price in 2022:
Detached houses: $262,365
Here: $262,365 State: $369,058 Townhouses or other attached units: $202,733
Here: $202,733 State: $327,631 Mobile homes: $37,872
Here: $37,872 State: $124,413
Total population: 36,141 (Urban population: 32,015 (all inside urban clusters), Rural population: 608 (all nonfarm))
Houses: 14,505 (12,691 occupied: 7,231 owner occupied, 6,382 renter occupied)
| % of renters here: | 47% |
| State: | 38% |
Housing density: 543 houses/condos per square mile
Median price asked for vacant for-sale houses and condos in 2022: $1,769,788.
Median contract rent in 2022: $773 (lower quartile is $567, upper quartile is $978)
Median rent asked for vacant for-rent units in 2022: $1,048
Median gross rent in Lufkin, TX in 2022: $985
Housing units in Lufkin with a mortgage: 3,383 (38 second mortgage, 0 home equity loan, 41 both second mortgage and home equity loan)
Houses without a mortgage: 68
Median household income for houses/condos with a mortgage: $75,412
Median household income for apartments without a mortgage: $71,850
Median monthly housing costs: $1,001
Compare current foreclosures in Lufkin, TX:
| Photo | Address | Area | Beds / Baths | Price | Details |
|---|---|---|---|---|---|

|
#1
Oak Crest Dr
Lufkin, TX 75901
|
- sq. feet
|
- baths - beds |
show details | |

|
#2
Runyan Ct
Lufkin, TX 75901
|
2,168 sq. feet
|
- baths - beds |
show details | |

|
#3
Crosswood St
Lufkin, TX 75904
|
1,514 sq. feet
|
- baths - beds |
show details | |

|
#4
Jefferson Ave
Lufkin, TX 75904
|
- sq. feet
|
- baths - beds |
show details | |

|
#5
Cumming St
Lufkin, TX 75904
|
1,064 sq. feet
|
- baths - beds |
show details | |

|
#6
Sun Meadow St
Lufkin, TX 75904
|
1,120 sq. feet
|
- baths - beds |
show details | |

|
#7
W Frank Ave Apt 305
Lufkin, TX 75904
|
- sq. feet
|
- baths - beds |
show details | |

|
#8
Cross Timbers St
Lufkin, TX 75904
|
- sq. feet
|
- baths - beds |
show details | |

|
#9
Blackburn Switch Rd
Lufkin, TX 75904
|
1,216 sq. feet
|
- baths - beds |
show details | |

|
#10
Park Ln
Lufkin, TX 75904
|
1,369 sq. feet
|
- baths - beds |
show details |
| Photo | Address | Area | Beds / Baths | Price | Details |
|---|---|---|---|---|---|

|
#11
Greg Rudd Rd
Lufkin, TX 75901
|
912 sq. feet
|
- baths - beds |
show details | |

|
#12
Mantooth Ave
Lufkin, TX 75904
|
- sq. feet
|
- baths - beds |
show details | |

|
#13
Dc Lawson Rd
Lufkin, TX 75904
|
1,200 sq. feet
|
- baths - beds |
show details | |

|
#14
E Groesbeck Ave
Lufkin, TX 75901
|
1,271 sq. feet
|
- baths - beds |
show details | |

|
#15
Hickory Hill Dr
Lufkin, TX 75901
|
1,296 sq. feet
|
- baths - beds |
show details | |

|
#16
Pine Forrest Dr
Lufkin, TX 75901
|
- sq. feet
|
- baths - beds |
show details | |

|
#17
Daniel Mccall Dr Apt 429
Lufkin, TX 75904
|
- sq. feet
|
- baths - beds |
show details | |

|
#18
N Fm 1194
Lufkin, TX 75904
|
1,680 sq. feet
|
- baths - beds |
show details | |

|
#19
Gaylon Wallace Rd
Lufkin, TX 75901
|
- sq. feet
|
- baths - beds |
show details | |

|
#20
Plantation Dr
Lufkin, TX 75901
|
1,946 sq. feet
|
- baths - beds |
show details |
| Photo | Address | Area | Beds / Baths | Price | Details |
|---|---|---|---|---|---|

|
#21
Hoskins Ave
Lufkin, TX 75901
|
1,748 sq. feet
|
- baths - beds |
show details | |

|
#22
Us Highway 69 N
Lufkin, TX 75904
|
- sq. feet
|
- baths - beds |
show details | |

|
#23
Sprucewood Dr
Lufkin, TX 75904
|
- sq. feet
|
- baths - beds |
show details | |

|
#24
Fm 2021
Lufkin, TX 75904
|
860 sq. feet
|
- baths - beds |
show details | |

|
#25
Garner Ave
Lufkin, TX 75904
|
920 sq. feet
|
- baths - beds |
show details | |

|
#26
Delmas Dr
Lufkin, TX 75901
|
1,391 sq. feet
|
- baths - beds |
show details | |

|
#27
S John Redditt Dr Unit 150603
Lufkin, TX 75915
|
- sq. feet
|
- baths - beds |
show details | |

|
#28
Shady Grove Loop
Lufkin, TX 75904
|
1,254 sq. feet
|
- baths - beds |
show details | |

|
#29
Fm 2680
Lufkin, TX 75904
|
- sq. feet
|
- baths - beds |
show details | |

|
#30
Shady Grove Loop
Lufkin, TX 75904
|
1,402 sq. feet
|
- baths - beds |
show details |
| Photo | Address | Area | Beds / Baths | Price | Details |
|---|---|---|---|---|---|

|
#31
E State Highway 103
Lufkin, TX 75901
|
- sq. feet
|
- baths - beds |
show details | |

|
#32
Berry Rd
Lufkin, TX 75904
|
- sq. feet
|
- baths - beds |
show details | |

|
#33
Stonewood Dr
Lufkin, TX 75901
|
868 sq. feet
|
- baths - beds |
show details | |

|
#34
Idylwood Dr
Lufkin, TX 75904
|
1,321 sq. feet
|
- baths - beds |
show details | |

|
#35
Cain St
Lufkin, TX 75904
|
816 sq. feet
|
- baths - beds |
show details | |

|
#36
W Frank Ave Apt 403
Lufkin, TX 75904
|
- sq. feet
|
- baths - beds |
show details | |

|
#37
Rainwood Dr
Lufkin, TX 75901
|
1,242 sq. feet
|
- baths - beds |
show details | |

|
#38
E Laurel Ave
Lufkin, TX 75901
|
1,004 sq. feet
|
- baths - beds |
show details | |

|
#39
Kingston St
Lufkin, TX 75901
|
1,208 sq. feet
|
- baths - beds |
show details | |

|
#40
Cimmarron St
Lufkin, TX 75904
|
1,360 sq. feet
|
- baths - beds |
show details |
| Photo | Address | Area | Beds / Baths | Price | Details |
|---|---|---|---|---|---|

|
#41
Fm 2021
Lufkin, TX 75904
|
1,120 sq. feet
|
- baths - beds |
show details | |

|
#42
Coach Redd Rd
Lufkin, TX 75901
|
2,077 sq. feet
|
- baths - beds |
show details | |

|
#43
Chambliss Rd
Lufkin, TX 75901
|
1,568 sq. feet
|
- baths - beds |
show details | |

|
#44
Willow Oak Dr
Lufkin, TX 75901
|
- sq. feet
|
- baths - beds |
show details | |

|
#45
Cunningham Dr
Lufkin, TX 75901
|
1,911 sq. feet
|
- baths - beds |
show details | |

|
#46
Ridgewood St
Lufkin, TX 75904
|
1,428 sq. feet
|
- baths - beds |
show details | |

|
#47
Phil Jackson Road
Lufkin, TX 75904
|
- sq. feet
|
- baths - beds |
show details | |

|
#48
Mccarty Rd
Lufkin, TX 75904
|
1,657 sq. feet
|
- baths - beds |
show details | |

|
#49
Lancewood Cir
Lufkin, TX 75904
|
1,752 sq. feet
|
- baths - beds |
show details | |

|
Check over 1 million property listings on Foreclosure.com!
|
browse all offers | |||

Latest news about housing in Lufkin, TX collected exclusively by city-data.com from local newspapers, TV, and radio stations

 | Lufkin - Best Apartments? (3 replies) |
| Nacogdoches room for rent? (2 replies) |
| Why people are leaving Dallas (53 replies) |
| Have you noticed a savings on property taxes with the homestead exemption? (21 replies) |
| Texas County Recommendations (24 replies) |
| Which City Has More Character Nacogdoche/Lufkin/Longview (219 replies) |

Median year apartment built: 1985
Household type by relationship:
Households: 34,359- Male householders: 5,455 (1,683 living alone), Female householders: 7,159 (2,115 living alone)
5,278 spouses (5,278 opposite-sex spouses), 950 unmarried partners, (864 opposite-sex unmarried partners), 10,384 children (9,500 natural, 272 adopted, 611 stepchildren), 1,423 grandchildren, 339 brothers or sisters, 533 parents, 48 foster children, 808 other relatives, 559 non-relatives
- In group quarters: 1,418
Size of family households: 3,333 2-persons, 1,899 3-persons, 1,202 4-persons, 1,262 5-persons, 801 6-persons, 134 7-or-more-persons.
Size of nonfamily households: 4,303 1-person, 714 2-persons, 51 3-persons, 27 5-persons.
4,869 married couples with children.
2,335 single-parent households (246 men, 2,089 women).
71.2% of residents of Lufkin speak English at home.
26.0% of residents speak Spanish at home (71% speak English very well, 10% speak English well, 14% speak English not well, 5% don't speak English at all).
0.5% of residents speak other Indo-European language at home (77% speak English very well, 6% speak English well, 9% speak English not well, 8% don't speak English at all).
0.7% of residents speak Asian or Pacific Island language at home (96% speak English very well, 4% speak English well).
1.1% of residents speak other language at home (79% speak English very well, 3% speak English well, 18% speak English not well).
Foreign born population: 4,925 (14.3%)
(34.7% of them are naturalized citizens)
| Here: | 6.5 |
| State: | 6.3 |
| Here: | 4.0 |
| State: | 4.0 |

- Bedrooms in owner-occupied houses and condos in Lufkin, Texas
- 0no bedroom
- 2451 bedroom
- 8942 bedrooms
- 4,2993 bedrooms
- 1,4364 bedrooms
- 3575+ bedrooms

- Bedrooms in renter-occupied apartments in Lufkin, Texas
- 482no bedroom
- 1,6561 bedroom
- 2,1592 bedrooms
- 1,7643 bedrooms
- 3224 bedrooms
- 05+ bedrooms

- Cars and other vehicles available in Lufkin in owner-occupied houses/condos
- 120no vehicle
- 1,8241 vehicle
- 3,0552 vehicles
- 1,6623 vehicles
- 3904 vehicles
- 1805+ vehicles

- Cars and other vehicles available in Lufkin in renter-occupied apartments
- 690no vehicle
- 3,4151 vehicle
- 1,7792 vehicles
- 4613 vehicles
- 374 vehicles
- 05+ vehicles

- Rooms in owner-occupied houses in Lufkin, Texas
- 01 room
- 672 rooms
- 1683 rooms
- 7034 rooms
- 1,7425 rooms
- 1,3856 rooms
- 1,4667 rooms
- 7448 rooms
- 9559+ rooms

- Rooms in renter-occupied apartments in Lufkin, Texas
- 4821 room
- 5432 rooms
- 1,1753 rooms
- 1,7484 rooms
- 1,1515 rooms
- 5966 rooms
- 3647 rooms
- 3108 rooms
- 139+ rooms


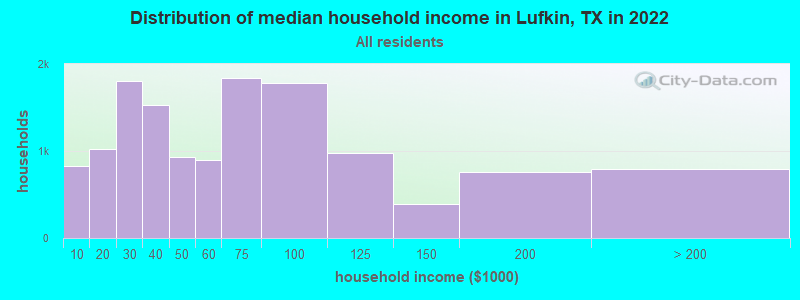
Lufkin, TX household income distribution

- 826Less than $10,000
- 1,024$10,000 to $19,999
- 1,807$20,000 to $29,999
- 1,532$30,000 to $39,999
- 927$40,000 to $49,999
- 897$50,000 to $59,999
- 1,839$60,000 to $74,999
- 1,779$75,000 to $99,999
- 979$100,000 to $124,999
- 391$125,000 to $149,999
- 758$150,000 to $199,999
- 796$200,000 or more
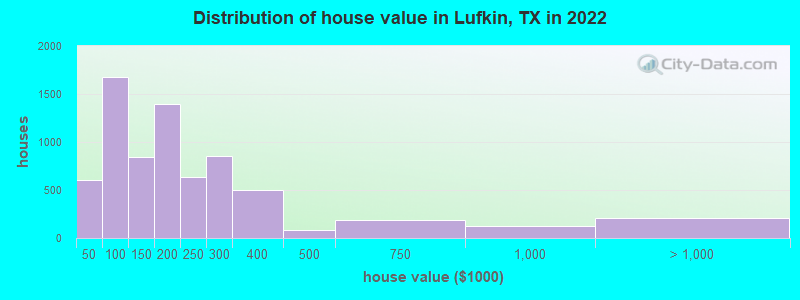
Home value of owner - occupied houses in 2022 in Lufkin, TX
-
- 116Less than $10,000
- 46$10,000 to $14,999
- 27$15,000 to $19,999
- 100$20,000 to $24,999
- 27$25,000 to $29,999
- 106$30,000 to $34,999
- 80$35,000 to $39,999
- 98$40,000 to $49,999
- 363$50,000 to $59,999
- 127$60,000 to $69,999
- 490$70,000 to $79,999
- 176$80,000 to $89,999
- 420$90,000 to $99,999
- 373$100,000 to $124,999
- 474$125,000 to $149,999
- 639$150,000 to $174,999
- 758$175,000 to $199,999
- 634$200,000 to $249,999
- 849$250,000 to $299,999
- 504$300,000 to $399,999
- 80$400,000 to $499,999
- 183$500,000 to $749,999
- 128$750,000 to $999,999
- 200$1,000,000 to $1,499,999
- 11$2,000,000 or more
Rent paid by renters in 2022 in Lufkin, TX
-
- 46Less than $100
- 65$100 to $149
- 7$150 to $199
- 82$200 to $249
- 82$250 to $299
- 122$300 to $349
- 133$350 to $399
- 336$400 to $449
- 49$450 to $499
- 362$500 to $549
- 148$550 to $599
- 673$600 to $649
- 431$650 to $699
- 185$700 to $749
- 346$750 to $799
- 551$800 to $899
- 1,242$900 to $999
- 671$1,000 to $1,249
- 243$1,250 to $1,499
- 98$1,500 to $1,999
- 27$2,000 to $2,499
- 70$2,500 to $2,999
- 50$3,500 or more
- 535No cash rent


Percentage of workers working in this county: 89.3%
Number of people working at home: 805 (5.2% of all workers)
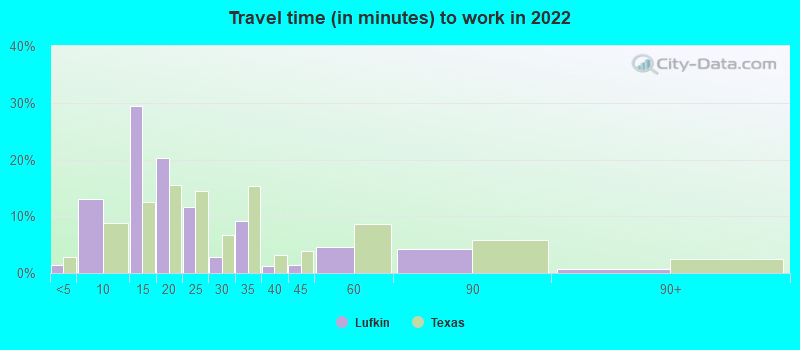
Travel time to work (commute)
- Less than 5 minutes: 239
- 5 to 9 minutes: 2,707
- 10 to 14 minutes: 4,753
- 15 to 19 minutes: 2,628
- 20 to 24 minutes: 1,585
- 25 to 29 minutes: 186
- 30 to 34 minutes: 902
- 35 to 39 minutes: 199
- 40 to 44 minutes: 75
- 45 to 59 minutes: 235
- 60 to 89 minutes: 297
- 90 or more minutes: 255
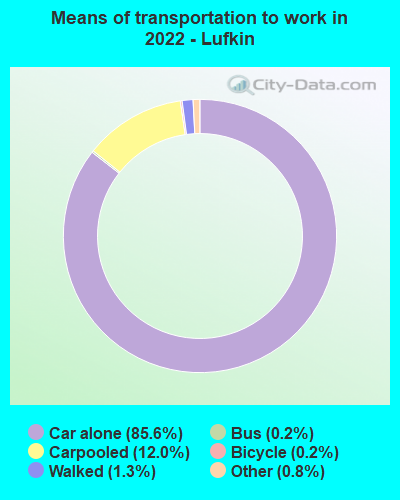
Means of transportation to work:
- Drove a car alone: 22,678 (79.4%)
- Carpooled: 3,445 (12.1%)
- Bus: 42 (0.1%)
- Taxi: 259 (0.9%)
- Bicycle: 54 (0.2%)
- Walked: 371 (1.3%)
- Worked at home: 805 (2.8%)

- Unemployment by race in 2022
- Unemployment rate for White non-Hispanic residents
- 4.5%Males
- 7.5%Females
- Unemployment rate for Black residents
- 9.5%Males
- 8.4%Females
- Unemployment rate for American Indian and Alaska Native residents
- 14.7%Males
- Unemployment rate for other race residents
- 20.6%Males
- Unemployment rate for two or more race residents
- 8.5%Males
- 5.6%Females
- Unemployment rate for Hispanic or Latino residents
- 7.8%Males
- 6.6%Females

- Year of entry for the foreign-born population in Lufkin, Texas
- 7912010 or later
- 1,6902000 to 2009
- 1,3821990 to 1999
- 1,0951980 to 1989
- 5091970 to 1979
- 92Before 1970
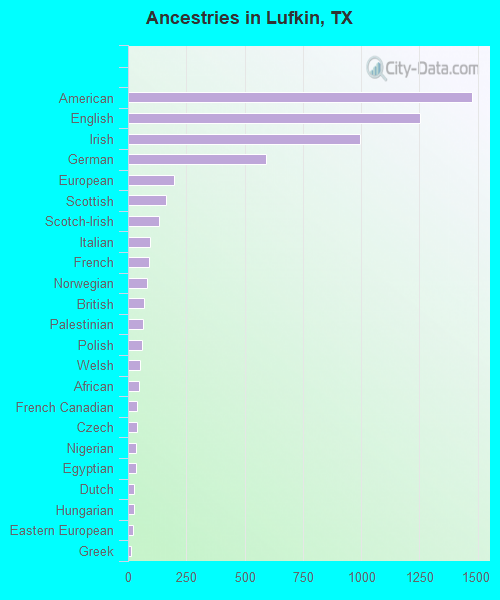
First ancestries reported:
- American: 1,475 (7.4%)
- English: 1,252 (6.3%)
- Irish: 995 (5.0%)
- German: 594 (3.0%)
- European: 197 (1.0%)
- Scottish: 161 (0.8%)
- Scotch-Irish: 134 (0.7%)
- Italian: 96 (0.5%)
- French: 89 (0.4%)
- Norwegian: 80 (0.4%)
- British: 69 (0.3%)
- Palestinian: 64 (0.3%)
- Polish: 61 (0.3%)
- Welsh: 52 (0.3%)
- African: 49 (0.2%)
- French Canadian: 38 (0.2%)
- Czech: 37 (0.2%)
- Nigerian: 36 (0.2%)
- Egyptian: 34 (0.2%)
- Dutch: 24 (0.1%)
- Hungarian: 24 (0.1%)
- Eastern European: 23 (0.1%)
- Greek: 14 (0.07%)
- Bahamian: 12 (0.06%)
- Swiss: 7 (0.04%)
Most common places of birth for foreign-born residents (%):
| Lufkin: | 71.0% (3,597) |
| Texas: | 48.4% (2,411,723) |
| Lufkin: | 8.4% (424) |
| Texas: | 4.5% (224,455) |
| Lufkin: | 3.9% (198) |
| Texas: | 2.1% (103,148) |
| Lufkin: | 2.2% (114) |
| Texas: | 1.9% (96,110) |
| Lufkin: | 2.1% (106) |
| Texas: | 6.1% (306,347) |
| Lufkin: | 1.9% (98) |
| Texas: | 3.0% (147,182) |
Place of birth for U.S.-born residents:
- This state: 23,617
- Other state: 5,515
- Northeast: 345
- Midwest: 1,017
- South: 2,722
- West: 1,625
77.9% of Lufkin residents lived in the same house 1 years ago.
Out of people who lived in different houses, 34.1% lived in this county.
Out of people who lived in different counties, 78.1% lived in Texas.
| Lufkin: | 77.9% |
| State average: | 85.7% |
Education attainment for males 25 years and older:
- No schooling: 362
- Nursery to 4th grade: 102
- 5th and 6th grade: 291
- 7th and 8th grade: 344
- 9th grade: 249
- 10th grade: 225
- 11th grade: 468
- 12th grade, no diploma: 265
- High school graduate (or equivalency): 2,993
- Less than 1 year of college: 670
- Some college more than 1 year, no degree: 1,204
- Associate degree: 1,182
- Bachelor's degree: 1,479
- Master's degree: 602
- Professional school degree: 92
- Doctorate degree: 142

Education attainment for females 25 years and older:
- No schooling: 423
- Nursery to 4th grade: 24
- 5th and 6th grade: 150
- 7th and 8th grade: 538
- 9th grade: 218
- 10th grade: 390
- 11th grade: 112
- 12th grade, no diploma: 451
- High school graduate (or equivalency): 3,519
- Less than 1 year of college: 933
- Some college more than 1 year, no degree: 1,168
- Associate degree: 1,441
- Bachelor's degree: 1,407
- Master's degree: 1,374
- Professional school degree: 146
- Doctorate degree: 55


Housing units in structures:
- One, detached: 9,556
- One, attached: 150
- Two: 315
- 3 or 4: 893
- 5 to 9: 928
- 10 to 19: 845
- 20 to 49: 408
- 50 or more: 777
- Mobile homes: 598
- Boats, RVs, vans, etc.: 29
Median worth of mobile homes: $56,775
Housing units lacking complete kitchen facilities in 2022: 3.5%
House/condo owner moved in on average 9 years ago
Renter moved in on average 3 years ago

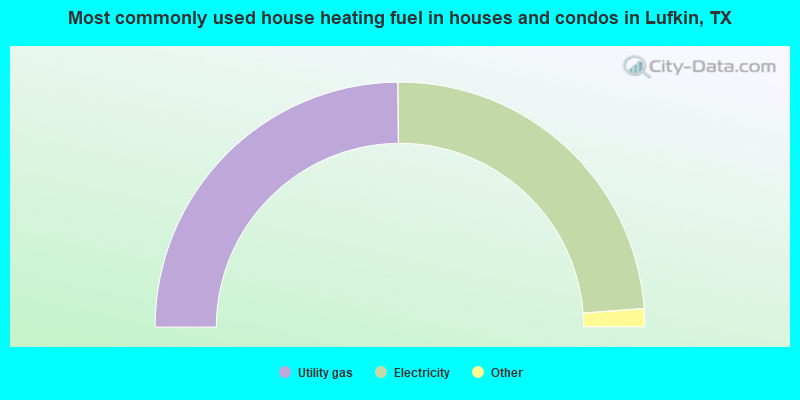
- 49.8%Utility gas
- 47.9%Electricity
- 1.8%Bottled, tank, or LP gas
- 0.4%Wood
- 0.2%No fuel used
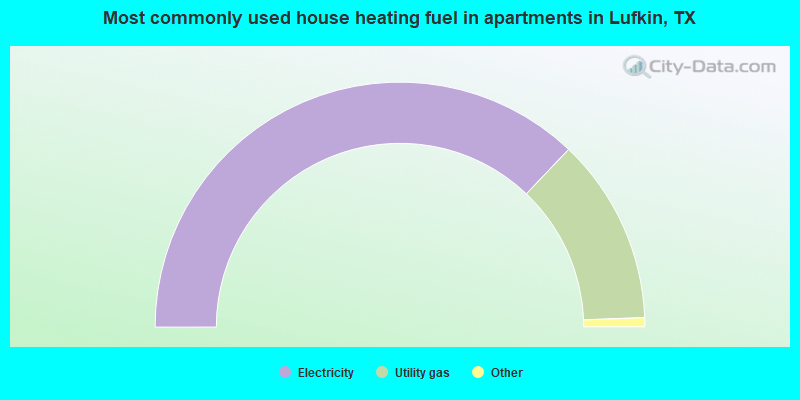
- 74.2%Electricity
- 24.6%Utility gas
- 0.7%Bottled, tank, or LP gas
- 0.4%No fuel used
Private vs. public school enrollment:
| Here: | 12.8% |
| Texas: | 8.8% |
| Here: | 2.5% |
| Texas: | 8.0% |
| Here: | 12.7% |
| Texas: | 16.2% |


