Lumberland, NY (New York) Houses and Residents
| Lumberland: | $331,645 |
| New York: | $400,400 |
Total population: 2,468 (Urban population: 0, Rural population: 1,939 (all nonfarm))
Houses: 1,419 (781 occupied: 644 owner occupied, 137 renter occupied)
| % of renters here: | 18% |
| State: | 46% |
Housing density: 30 houses/condos per square mile
Median price asked for vacant for-sale houses and condos in 2022 in this county: $640,942.
Median contract rent in 2022: $766 (lower quartile is $558, upper quartile is $1,242)
Median rent asked for vacant for-rent units in 2022: $533
Median gross rent in Lumberland, NY in 2022: $947
Housing units in Lumberland with a mortgage: 316 (37 second mortgage, 20 home equity loan, 0 both second mortgage and home equity loan)
Houses without a mortgage: 206
Compare current foreclosures near Lumberland, NY:
| Photo | Address | Area | Beds / Baths | Price | Details |
|---|---|---|---|---|---|

|
#1
Lake Shore Dr E
Rock Hill, NY 12775
|
2,820 sq. feet
|
3 baths 4 beds |
$439,900
|
show details |

|
#2
Oak Ridge Dr
Milford, PA 18337
|
2,201 sq. feet
|
2 baths 4 beds |
$365,000
|
show details |

|
#3
Main St
Sparrow Bush, NY 12780
|
1,824 sq. feet
|
1 baths 3 beds |
show details | |

|
#4
Haring Rd
Barryville, NY 12719
|
2,896 sq. feet
|
2 baths 5 beds |
show details | |

|
#5
Boulder Dr
Hawley, PA 18428
|
2,087 sq. feet
|
2 baths 3 beds |
show details | |

|
#6
Yale Rd
Milford, PA 18337
|
1,701 sq. feet
|
2 baths 3 beds |
show details | |

|
#7
Doolan Rd
Dingmans Ferry, PA 18328
|
1,040 sq. feet
|
1 baths 3 beds |
show details | |

|
#8
Greenville Tpke
Middletown, NY 10940
|
1,764 sq. feet
|
2 baths 3 beds |
show details | |

|
#9
Route 209
Cuddebackville, NY 12729
|
1,250 sq. feet
|
1 baths 3 beds |
show details | |

|
#10
Charlotte Ln
Middletown, NY 10940
|
2,240 sq. feet
|
2 baths 4 beds |
show details |
| Photo | Address | Area | Beds / Baths | Price | Details |
|---|---|---|---|---|---|

|
#11
Slake Shore Dr A
Montague, NJ 07827
|
- sq. feet
|
1 baths 2 beds |
show details | |

|
#12
Baran Dr
Glen Spey, NY 12737
|
1,728 sq. feet
|
2 baths 4 beds |
show details | |

|
#13
Lime Kiln Rd
Port Jervis, NY 12771
|
2,240 sq. feet
|
4 baths 3 beds |
show details | |

|
#14
Black Rock Trl
Port Jervis, NY 12771
|
1,144 sq. feet
|
1 baths 3 beds |
show details | |

|
#15
York Ave
Monticello, NY 12701
|
1,602 sq. feet
|
1 baths 3 beds |
show details | |

|
#16
Monahan Rd
Port Jervis, NY 12771
|
1,560 sq. feet
|
3 baths 4 beds |
show details | |

|
#17
Grange Rd
Otisville, NY 10963
|
2,066 sq. feet
|
1 baths 3 beds |
show details | |

|
#18
Lincoln Pl
Monticello, NY 12701
|
1,836 sq. feet
|
2 baths 4 beds |
show details | |

|
#19
Guymard Tpke
Middletown, NY 10940
|
3,816 sq. feet
|
2 baths 4 beds |
show details | |

|
#20
Greenville Tpke
Middletown, NY 10940
|
3,096 sq. feet
|
3 baths 3 beds |
show details |
| Photo | Address | Area | Beds / Baths | Price | Details |
|---|---|---|---|---|---|

|
#21
Seward Ave
Port Jervis, NY 12771
|
2,028 sq. feet
|
2 baths 6 beds |
show details | |

|
#22
White Bridge Rd
Middletown, NY 10940
|
3,960 sq. feet
|
2 baths 3 beds |
show details | |

|
#23
Ridge Rd
Westtown, NY 10998
|
1,056 sq. feet
|
1 baths 2 beds |
show details | |

|
#24
Yulan Barryville Rd
Barryville, NY 12719
|
1,007 sq. feet
|
1 baths 3 beds |
show details | |

|
#25
Rio Dam Rd
Glen Spey, NY 12737
|
1,040 sq. feet
|
1 baths 2 beds |
show details | |

|
#26
State Route 42
Sparrow Bush, NY 12780
|
1,368 sq. feet
|
2 baths 3 beds |
show details | |

|
#27
Sussex St
Port Jervis, NY 12771
|
2,724 sq. feet
|
2 baths 4 beds |
show details | |

|
#28
Maiden Ln
Port Jervis, NY 12771
|
1,564 sq. feet
|
2 baths 3 beds |
show details | |

|
#29
Hidden Ridge Dr
Monticello, NY 12701
|
1,114 sq. feet
|
2 baths 2 beds |
show details | |

|
#30
S Centerville Rd
Middletown, NY 10940
|
2,000 sq. feet
|
2 baths 3 beds |
show details |
| Photo | Address | Area | Beds / Baths | Price | Details |
|---|---|---|---|---|---|

|
#31
Shoddy Hollow Rd
Middletown, NY 10940
|
2,160 sq. feet
|
2 baths 4 beds |
show details | |

|
#32
North Rd
Forestburgh, NY 12777
|
5,284 sq. feet
|
5 baths - beds |
show details | |

|
#33
Deerfield Ln
Montague, NJ 07827
|
- sq. feet
|
- baths - beds |
show details | |

|
#34
Ash Ln
Milford, PA 18337
|
- sq. feet
|
- baths - beds |
show details | |

|
#35
Deerfield Ln
Montague, NJ 07827
|
- sq. feet
|
- baths - beds |
show details | |

|
#36
Hearthstone Ct
Montague, NJ 07827
|
- sq. feet
|
- baths - beds |
show details | |

|
#37
Deerfield Ln, Unit B
Montague, NJ 07827
|
- sq. feet
|
- baths - beds |
show details | |

|
#38
Spook Ridge Rd
Montague, NJ 07827
|
- sq. feet
|
- baths - beds |
show details | |

|
#39
Spruce Lake Dr
Milford, PA 18337
|
- sq. feet
|
- baths - beds |
show details | |

|
#40
Deerfield Ln, Unit B
Montague, NJ 07827
|
- sq. feet
|
- baths - beds |
show details |
| Photo | Address | Area | Beds / Baths | Price | Details |
|---|---|---|---|---|---|

|
#41
Rolling Ridge Rd
Montague, NJ 07827
|
- sq. feet
|
- baths - beds |
show details | |

|
#42
Old Mine Rd # H
Montague, NJ 07827
|
- sq. feet
|
- baths - beds |
show details | |

|
#43
W Broadway Apt 30
Monticello, NY 12701
|
- sq. feet
|
- baths - beds |
show details | |

|
#44
Chubby Ln
Montague, NJ 07827
|
920 sq. feet
|
- baths - beds |
show details | |

|
#45
New Rd
Montague, NJ 07827
|
3,334 sq. feet
|
- baths - beds |
show details | |

|
#46
Dom Dr
Monticello, NY 12701
|
- sq. feet
|
- baths - beds |
show details | |

|
#47
Old Mine Rd
Montague, NJ 07827
|
- sq. feet
|
- baths - beds |
show details | |

|
#48
Casey Ln
Wurtsboro, NY 12790
|
- sq. feet
|
- baths - beds |
show details | |

|
#49
Shore D, #d
Montague, NJ 07827
|
- sq. feet
|
- baths - beds |
show details | |

|
Check over 1 million property listings on Foreclosure.com!
|
browse all offers | |||

Household type by relationship:
Households: 73,722- In family households: 60,228 (12,565 male householders, 6,707 female householders)
13,611 spouses, 21,107 children (19,723 natural, 408 adopted, 976 stepchildren), 1,369 grandchildren, 597 brothers or sisters, 734 parents, foster children, 818 other relatives, 2,294 non-relatives
- In nonfamily households: 13,494 (5,675 male householders (4,417 living alone)), 5,192 female householders (4,343 living alone)), 2,627 nonrelatives
- In group quarters: 3,825 (2,009 institutionalized population)
11,545 married couples with children.
4,946 single-parent households (1,285 men, 3,661 women).
80.8% of residents of Lumberland speak English at home.
2.3% of residents speak Spanish at home (84% speak English very well, 16% speak English well).
16.8% of residents speak other Indo-European language at home (42% speak English very well, 48% speak English well, 11% speak English not well).
0.1% of residents speak Asian or Pacific Island language at home (100% speak English well).
Foreign born population: 476 (22.8%)
(96.8% of them are naturalized citizens)
| Here: | 6.1 |
| State: | 6.3 |
| Here: | 4.0 |
| State: | 3.8 |

- Bedrooms in owner-occupied houses and condos in Lumberland, New York
- 2no bedroom
- 341 bedroom
- 1692 bedrooms
- 3383 bedrooms
- 744 bedrooms
- 275+ bedrooms

- Bedrooms in renter-occupied apartments in Lumberland, New York
- 2no bedroom
- 351 bedroom
- 382 bedrooms
- 433 bedrooms
- 174 bedrooms
- 25+ bedrooms

- Cars and other vehicles available in Lumberland in owner-occupied houses/condos
- 33no vehicle
- 2121 vehicle
- 2432 vehicles
- 1273 vehicles
- 194 vehicles
- 105+ vehicles

- Cars and other vehicles available in Lumberland in renter-occupied apartments
- 9no vehicle
- 691 vehicle
- 542 vehicles
- 33 vehicles
- 04 vehicles
- 25+ vehicles

- Rooms in owner-occupied houses in Lumberland, New York
- 01 room
- 72 rooms
- 203 rooms
- 1064 rooms
- 1595 rooms
- 1816 rooms
- 857 rooms
- 418 rooms
- 459+ rooms

- Rooms in renter-occupied apartments in Lumberland, New York
- 21 room
- 82 rooms
- 253 rooms
- 234 rooms
- 375 rooms
- 156 rooms
- 207 rooms
- 78 rooms
- 09+ rooms


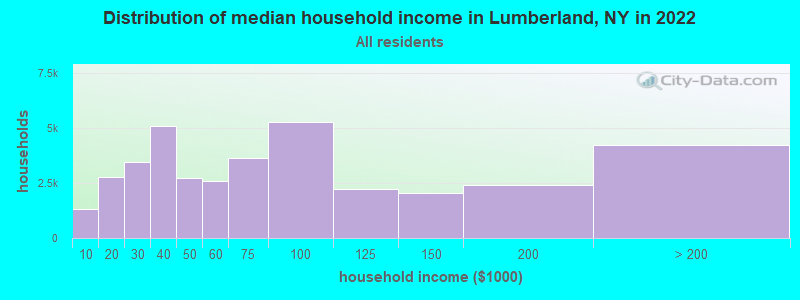
Lumberland, NY household income distribution

- 1,312Less than $10,000
- 2,756$10,000 to $19,999
- 3,439$20,000 to $29,999
- 5,092$30,000 to $39,999
- 2,705$40,000 to $49,999
- 2,586$50,000 to $59,999
- 3,651$60,000 to $74,999
- 5,271$75,000 to $99,999
- 2,211$100,000 to $124,999
- 2,043$125,000 to $149,999
- 2,426$150,000 to $199,999
- 4,248$200,000 or more
Percentage of workers working in this county: 42.1%
Number of people working at home: 110 (12.1% of all workers)
Travel time to work (commute)
- Less than 5 minutes: 33
- 5 to 9 minutes: 43
- 10 to 14 minutes: 47
- 15 to 19 minutes: 76
- 20 to 24 minutes: 102
- 25 to 29 minutes: 44
- 30 to 34 minutes: 108
- 35 to 39 minutes: 19
- 40 to 44 minutes: 37
- 45 to 59 minutes: 172
- 60 to 89 minutes: 76
- 90 or more minutes: 72
Means of transportation to work:
- Drove a car alone: 663 (77.7%)
- Carpooled: 124 (14.5%)
- Bus or trolley bus: 3 (0.4%)
- Subway or elevated: 9 (1.1%)
- Railroad: 11 (1.3%)
- Walked: 19 (2.2%)
- Worked at home: 24 (2.8%)


- Year of entry for the foreign-born population in Lumberland, New York
- 221995 to March 2000
- 51990 to 1994
- 111985 to 1989
- 201980 to 1984
- 131975 to 1979
- 61970 to 1974
- 111965 to 1969
- 207Before 1965

First ancestries reported:
- German: 472 (21.4%)
- Irish: 371 (16.8%)
- Ukrainian: 219 (9.9%)
- Italian: 193 (8.8%)
- Other: 193 (8.8%)
- English: 154 (7.0%)
- Polish: 128 (5.8%)
- French: 83 (3.8%)
- Dutch: 80 (3.6%)
- United States: 78 (3.5%)
- Russian: 46 (2.1%)
- Scottish: 30 (1.4%)
- Welsh: 30 (1.4%)
- Swedish: 27 (1.2%)
- French Canadian: 19 (0.9%)
- Scotch-Irish: 19 (0.9%)
- Slovak: 19 (0.9%)
- Hungarian: 17 (0.8%)
- Czech: 11 (0.5%)
- Norwegian: 8 (0.4%)
- Lithuanian: 3 (0.1%)
- Danish: 2 (0.09%)
- Swiss: 1 (0.05%)
Most common places of birth for foreign-born residents (%):
| Lumberland: | 41.4% (122) |
| New York: | 2.1% (82,238) |
| Lumberland: | 14.9% (44) |
| New York: | 2.4% (93,187) |
| Lumberland: | 8.8% (26) |
| New York: | 1.8% (69,327) |
| Lumberland: | 6.4% (19) |
| New York: | 2.4% (94,595) |
| Lumberland: | 3.1% (9) |
| New York: | 0.3% (13,246) |
| Lumberland: | 2.4% (7) |
| New York: | 0.3% (11,299) |
| Lumberland: | 2.4% (7) |
| New York: | 0.3% (10,645) |
| Lumberland: | 2.4% (7) |
| New York: | 1.4% (54,876) |
| Lumberland: | 2.0% (6) |
| New York: | 1.6% (62,237) |
| Lumberland: | 1.7% (5) |
| New York: | 0.3% (13,070) |
| Lumberland: | 1.7% (5) |
| New York: | 1.4% (53,825) |
| Lumberland: | 1.7% (5) |
| New York: | 1.1% (43,314) |
| Lumberland: | 1.7% (5) |
| New York: | 0.6% (22,265) |
Place of birth for U.S.-born residents:
- This state: 1,174
- Other state: 459
- Northeast: 356
- Midwest: 45
- South: 50
- West: 8
70% of Lumberland residents lived in the same house 5 years ago.
Out of people who lived in different houses, 47% lived in this county.
Out of people who lived in different counties, 70% lived in New York.
Education attainment for males 25 years and older:
- No schooling: 3
- Nursery to 4th grade: 3
- 5th and 6th grade: 3
- 7th and 8th grade: 18
- 9th grade: 14
- 10th grade: 27
- 11th grade: 13
- 12th grade, no diploma: 9
- High school graduate (or equivalency): 237
- Less than 1 year of college: 49
- Some college more than 1 year, no degree: 68
- Associate degree: 42
- Bachelor's degree: 90
- Master's degree: 29
- Professional school degree: 22
- Doctorate degree: 13

Education attainment for females 25 years and older:
- No schooling: 7
- Nursery to 4th grade: 3
- 5th and 6th grade: 12
- 7th and 8th grade: 32
- 9th grade: 7
- 10th grade: 17
- 11th grade: 23
- 12th grade, no diploma: 27
- High school graduate (or equivalency): 243
- Less than 1 year of college: 78
- Some college more than 1 year, no degree: 80
- Associate degree: 54
- Bachelor's degree: 57
- Master's degree: 49
- Professional school degree: 14
- Doctorate degree: 5


Housing units in structures:
- One, detached: 1,278
- One, attached: 10
- Two: 23
- 3 or 4: 20
- 5 to 9: 25
- Mobile homes: 57
- Boats, RVs, vans, etc.: 6
Median worth of mobile homes: $83,729
Housing units lacking complete kitchen facilities: 2.1%

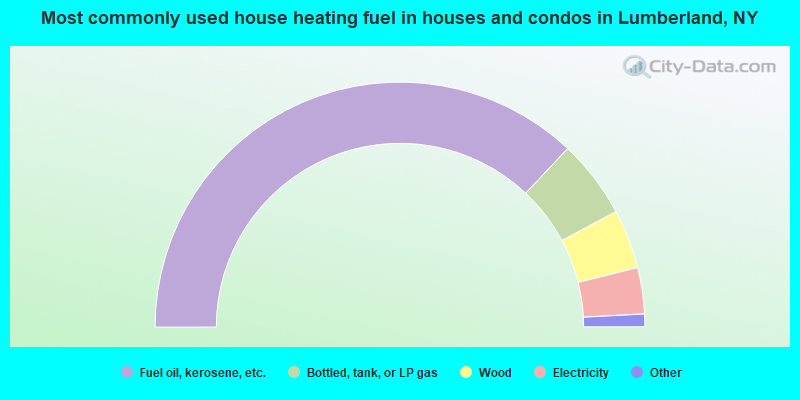
- 74.1%Fuel oil, kerosene, etc.
- 10.4%Bottled, tank, or LP gas
- 7.8%Wood
- 6.1%Electricity
- 0.6%Other fuel
- 0.5%Coal or coke
- 0.3%Utility gas
- 0.3%No fuel used
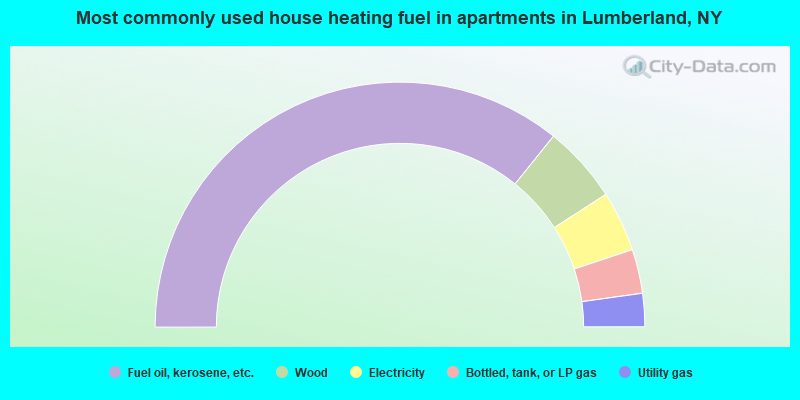
- 71.5%Fuel oil, kerosene, etc.
- 10.2%Wood
- 8.0%Electricity
- 5.8%Bottled, tank, or LP gas
- 4.4%Utility gas
Private vs. public school enrollment:
| Here: | 6.0% |
| New York: | 14.0% |
| Here: | 2.8% |
| New York: | 13.2% |
| Here: | 14.7% |
| New York: | 38.2% |


