Luttrell, TN (Tennessee) Houses and Residents
| Luttrell: | $154,977 |
| Tennessee: | $284,800 |
Mean price in 2022:
Detached houses: $181,253
Here: $181,253 State: $374,382 Mobile homes: $95,198
Here: $95,198 State: $101,421
Total population: 1,080 (Urban population: 0, Rural population: 836 (all nonfarm))
Houses: 490 (373 occupied: 314 owner occupied, 65 renter occupied)
| % of renters here: | 17% |
| State: | 33% |
Housing density: 125 houses/condos per square mile
Median price asked for vacant for-sale houses and condos in 2022 in this county: $418,687.
Median contract rent in 2022: $481 (lower quartile is $368, upper quartile is $562)
Median rent asked for vacant for-rent units in 2022: $2,100
Median gross rent in Luttrell, TN in 2022: $651
Housing units in Luttrell with a mortgage: 106 (10 second mortgage, 0 home equity loan, 10 both second mortgage and home equity loan)
Houses without a mortgage: 0
Median household income for houses/condos with a mortgage: $39,272
Median household income for apartments without a mortgage: $37,718
Median monthly housing costs: $526
Compare current foreclosures near Luttrell, TN:
| Photo | Address | Area | Beds / Baths | Price | Details |
|---|---|---|---|---|---|

|
#1
Grace Ave
Luttrell, TN 37779
|
1,568 sq. feet
|
2 baths 3 beds |
$156,000
|
show details |

|
#2
Sallings Rd
Luttrell, TN 37779
|
1,196 sq. feet
|
1 baths - beds |
show details | |

|
#3
Highway 61 E
Luttrell, TN 37779
|
1,280 sq. feet
|
2 baths - beds |
show details | |

|
#4
Highway 61 E
Luttrell, TN 37779
|
2,040 sq. feet
|
1 baths - beds |
show details | |

|
#5
Beeler Ln
Luttrell, TN 37779
|
- sq. feet
|
- baths - beds |
show details | |

|
#6
Texas Hollow Rd
Luttrell, TN 37779
|
1,568 sq. feet
|
- baths - beds |
show details | |

|
#7
Donahue Rd
Luttrell, TN 37779
|
- sq. feet
|
- baths - beds |
show details | |

|
#8
Wolfenbarger Ln # 358
Luttrell, TN 37779
|
1,568 sq. feet
|
- baths - beds |
show details | |

|
#9
Highway 131
Washburn, TN 37888
|
1,400 sq. feet
|
2 baths 3 beds |
$280,000
|
show details |

|
#10
Julian Dr
Luttrell, TN 37779
|
- sq. feet
|
- baths - beds |
show details |
| Photo | Address | Area | Beds / Baths | Price | Details |
|---|---|---|---|---|---|

|
#11
Satterfield Rd
Luttrell, TN 37779
|
- sq. feet
|
- baths - beds |
show details | |

|
#12
Patterson Town Rd
Blaine, TN 37709
|
1,026 sq. feet
|
1 baths - beds |
$24,900
|
show details |

|
#13
Cingular Dr
New Tazewell, TN 37825
|
- sq. feet
|
2 baths 3 beds |
show details | |

|
#14
Jesse Baker Ln
Jefferson City, TN 37760
|
- sq. feet
|
2 baths 4 beds |
show details | |

|
#15
Rosie Ln
Strawberry Plains, TN 37871
|
4,395 sq. feet
|
3 baths 4 beds |
show details | |

|
#16
Horsestall Dr
Knoxville, TN 37918
|
1,956 sq. feet
|
2 baths 3 beds |
show details | |

|
#17
Babelay Rd
Knoxville, TN 37924
|
1,108 sq. feet
|
2 baths 3 beds |
show details | |

|
#18
Possum Valley Rd
Maynardville, TN 37807
|
1,960 sq. feet
|
3 baths 3 beds |
show details | |

|
#19
Armstrong Rd
Knoxville, TN 37924
|
1,040 sq. feet
|
1 baths 2 beds |
show details | |

|
#20
Mccampbell Wells Way
Knoxville, TN 37924
|
2,283 sq. feet
|
2 baths 2 beds |
show details |
| Photo | Address | Area | Beds / Baths | Price | Details |
|---|---|---|---|---|---|

|
#21
Periwinkle Rd
Knoxville, TN 37918
|
960 sq. feet
|
2 baths 2 beds |
show details | |

|
#22
Guinn Dr
New Market, TN 37820
|
2,280 sq. feet
|
2 baths 3 beds |
show details | |

|
#23
Hillcrest Dr
Knoxville, TN 37918
|
1,430 sq. feet
|
1 baths 3 beds |
show details | |

|
#24
Cedarbreeze Rd
Knoxville, TN 37918
|
1,604 sq. feet
|
1 baths 3 beds |
show details | |

|
#25
Edmondson Ln
Knoxville, TN 37918
|
1,200 sq. feet
|
1 baths 2 beds |
show details | |

|
#26
Lynnview Dr
Knoxville, TN 37918
|
1,367 sq. feet
|
1 baths 2 beds |
show details | |

|
#27
Catalpa Ave
Knoxville, TN 37914
|
1,430 sq. feet
|
1 baths 3 beds |
show details | |

|
#28
Plymouth Rd
Knoxville, TN 37914
|
2,036 sq. feet
|
1 baths 3 beds |
show details | |

|
#29
Blackgum Cir
Knoxville, TN 37918
|
1,104 sq. feet
|
2 baths 3 beds |
show details | |

|
#30
Homestead Dr
Knoxville, TN 37918
|
1,420 sq. feet
|
2 baths 3 beds |
show details |
| Photo | Address | Area | Beds / Baths | Price | Details |
|---|---|---|---|---|---|

|
#31
Fountain Dr
Knoxville, TN 37918
|
2,406 sq. feet
|
3 baths 3 beds |
show details | |

|
#32
Hallsdale Rd
Knoxville, TN 37938
|
1,941 sq. feet
|
2 baths 3 beds |
show details | |

|
#33
Wayne Dr
Knoxville, TN 37914
|
1,160 sq. feet
|
1 baths 2 beds |
show details | |

|
#34
Edmondson Ln
Knoxville, TN 37918
|
1,008 sq. feet
|
1 baths 3 beds |
show details | |

|
#35
Cedar Ln
Knoxville, TN 37918
|
1,450 sq. feet
|
1 baths 3 beds |
show details | |

|
#36
Fairmont Blvd
Knoxville, TN 37917
|
1,234 sq. feet
|
1 baths 2 beds |
show details | |

|
#37
Drinnen Rd
Knoxville, TN 37914
|
1,512 sq. feet
|
1 baths 3 beds |
show details | |

|
#38
Old Dandridge Stage Coach Rd
Knoxville, TN 37914
|
1,536 sq. feet
|
2 baths 2 beds |
show details | |

|
#39
September Ln
Knoxville, TN 37924
|
1,120 sq. feet
|
1 baths 3 beds |
show details | |

|
#40
September Ln
Knoxville, TN 37924
|
1,120 sq. feet
|
1 baths 3 beds |
show details |
| Photo | Address | Area | Beds / Baths | Price | Details |
|---|---|---|---|---|---|

|
#41
Rising Rd
Knoxville, TN 37924
|
1,312 sq. feet
|
1 baths 3 beds |
show details | |

|
#42
Boright Dr
Knoxville, TN 37917
|
720 sq. feet
|
1 baths 2 beds |
show details | |

|
#43
Tecoma Dr
Knoxville, TN 37917
|
1,380 sq. feet
|
2 baths 4 beds |
show details | |

|
#44
Holbrook Dr
Knoxville, TN 37918
|
944 sq. feet
|
1 baths 2 beds |
show details | |

|
#45
Wilmouth Run Rd
Knoxville, TN 37918
|
1,180 sq. feet
|
2 baths 2 beds |
show details | |

|
#46
Fountain Park Blvd
Knoxville, TN 37917
|
1,456 sq. feet
|
2 baths 3 beds |
show details | |

|
#47
Midview Ln
Knoxville, TN 37938
|
1,852 sq. feet
|
2 baths 3 beds |
show details | |

|
#48
Willow Falls Way
Knoxville, TN 37917
|
1,026 sq. feet
|
2 baths 2 beds |
show details | |

|
#49
Forestdale Ave
Knoxville, TN 37917
|
2,025 sq. feet
|
1 baths 4 beds |
show details | |

|
Check over 1 million property listings on Foreclosure.com!
|
browse all offers | |||

Latest news about housing in Luttrell, TN collected exclusively by city-data.com from local newspapers, TV, and radio stations

 | Neighborhood recommendations in Knoxville (6 replies) |
| Does Knoxville have typical suburbs? What's a good area for a single guy to buy house? (56 replies) |
| Wanting to move to Luttrell TN (20 replies) |
| Elon (1 reply) |
| New To Tennessee, Moving to Luttrell (15 replies) |
| Pros & Cons and differences of retiring to Bristol, Kingsport or Johnson City ? (106 replies) |

Median year apartment built: 1975
Household type by relationship:
Households: 933- Male householders: 180 (28 living alone), Female householders: 188 (51 living alone)
158 spouses (158 opposite-sex spouses), 5 unmarried partners, (5 opposite-sex unmarried partners), 265 children (255 natural, 10 adopted, 0 stepchildren), 75 grandchildren, 22 brothers or sisters, 21 parents, 0 foster children, 14 other relatives, 2 non-relatives
Size of family households: 166 2-persons, 55 3-persons, 22 4-persons, 49 5-persons, 4 6-persons.
Size of nonfamily households: 81 1-person.
110 married couples with children.
62 single-parent households (5 men, 57 women).
97.9% of residents of Luttrell speak English at home.
2.1% of residents speak Spanish at home (78% speak English very well, 22% speak English well).
Foreign born population: 5 (0.5%)
(100.0% of them are naturalized citizens)
| Here: | 5.6 |
| State: | 6.5 |
| Here: | 5.3 |
| State: | 4.4 |

- Bedrooms in owner-occupied houses and condos in Luttrell, Tennessee
- 0no bedroom
- 181 bedroom
- 552 bedrooms
- 1983 bedrooms
- 424 bedrooms
- 25+ bedrooms

- Bedrooms in renter-occupied apartments in Luttrell, Tennessee
- 0no bedroom
- 01 bedroom
- 232 bedrooms
- 423 bedrooms
- 04 bedrooms
- 05+ bedrooms

- Cars and other vehicles available in Luttrell in owner-occupied houses/condos
- 8no vehicle
- 871 vehicle
- 1242 vehicles
- 673 vehicles
- 234 vehicles
- 55+ vehicles

- Cars and other vehicles available in Luttrell in renter-occupied apartments
- 20no vehicle
- 341 vehicle
- 82 vehicles
- 33 vehicles
- 04 vehicles
- 05+ vehicles

- Rooms in owner-occupied houses in Luttrell, Tennessee
- 01 room
- 02 rooms
- 33 rooms
- 624 rooms
- 855 rooms
- 736 rooms
- 507 rooms
- 218 rooms
- 209+ rooms

- Rooms in renter-occupied apartments in Luttrell, Tennessee
- 01 room
- 02 rooms
- 03 rooms
- 134 rooms
- 235 rooms
- 56 rooms
- 187 rooms
- 68 rooms
- 09+ rooms


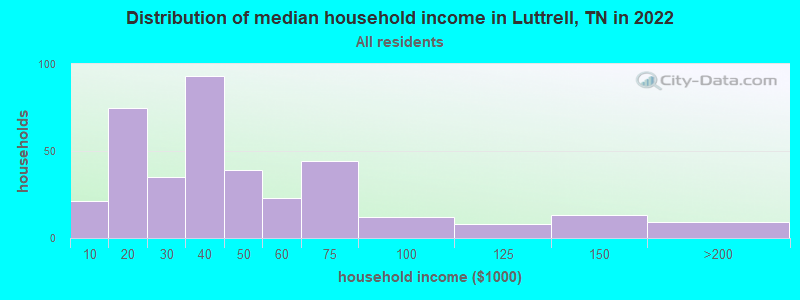
Luttrell, TN household income distribution

- 21Less than $10,000
- 75$10,000 to $19,999
- 35$20,000 to $29,999
- 93$30,000 to $39,999
- 39$40,000 to $49,999
- 23$50,000 to $59,999
- 44$60,000 to $74,999
- 12$75,000 to $99,999
- 8$100,000 to $124,999
- 13$125,000 to $149,999
- 9$150,000 to $199,999
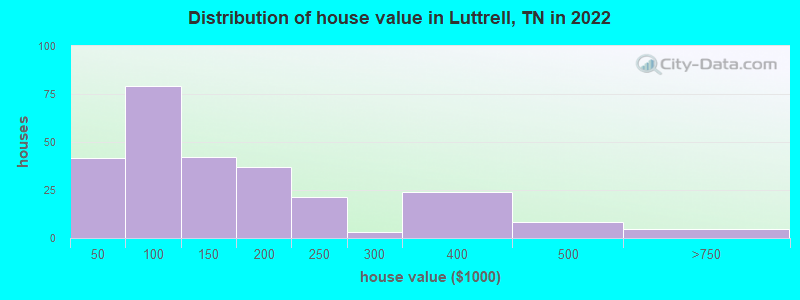
Home value of owner - occupied houses in 2022 in Luttrell, TN
-
- 9Less than $10,000
- 4$15,000 to $19,999
- 9$20,000 to $24,999
- 4$25,000 to $29,999
- 8$30,000 to $34,999
- 6$40,000 to $49,999
- 24$50,000 to $59,999
- 28$70,000 to $79,999
- 7$80,000 to $89,999
- 12$90,000 to $99,999
- 8$100,000 to $124,999
- 33$125,000 to $149,999
- 31$150,000 to $174,999
- 5$175,000 to $199,999
- 21$200,000 to $249,999
- 3$250,000 to $299,999
- 23$300,000 to $399,999
- 8$400,000 to $499,999
- 4$500,000 to $749,999
Rent paid by renters in 2022 in Luttrell, TN
-
- 5$100 to $149
- 8$200 to $249
- 12$350 to $399
- 2$400 to $449
- 6$450 to $499
- 11$500 to $549
- 6$600 to $649
- 2$750 to $799
- 7No cash rent


Percentage of workers working in this county: 21.1%
Number of people working at home: 8 (2.9% of all workers)
Travel time to work (commute)
- Less than 5 minutes: 10
- 5 to 9 minutes: 2
- 10 to 14 minutes: 16
- 15 to 19 minutes: 14
- 20 to 24 minutes: 30
- 25 to 29 minutes: 6
- 30 to 34 minutes: 58
- 35 to 39 minutes: 4
- 40 to 44 minutes: 10
- 45 to 59 minutes: 26
- 60 to 89 minutes: 60
- 90 or more minutes: 15
Means of transportation to work:
- Drove a car alone: 228 (75.7%)
- Carpooled: 60 (19.9%)
- Walked: 4 (1.3%)
- Other means: 3 (1.0%)
- Worked at home: 6 (2.0%)

- Unemployment by race in 2022
- Unemployment rate for White non-Hispanic residents
- 2.4%Males
- 4.1%Females

- Year of entry for the foreign-born population in Luttrell, Tennessee
- 02010 or later
- 02000 to 2009
- 51990 to 1999
- 01980 to 1989
- 01970 to 1979
- 0Before 1970
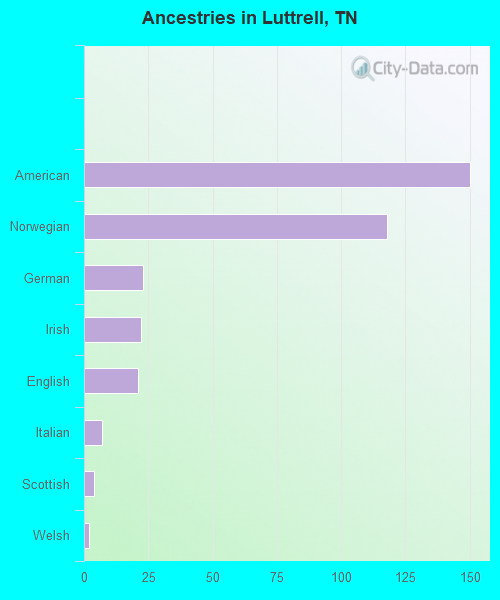
First ancestries reported:
- American: 150 (35.1%)
- Norwegian: 118 (27.6%)
- German: 23 (5.4%)
- Irish: 22 (5.1%)
- English: 21 (4.9%)
- Italian: 7 (1.6%)
- Scottish: 4 (0.9%)
- Welsh: 2 (0.5%)
- Scotch-Irish: 1 (0.2%)
Most common places of birth for foreign-born residents (%):
| Luttrell: | 80.0% (4) |
| Tennessee: | 23.0% (86,435) |
Place of birth for U.S.-born residents:
- This state: 757
- Other state: 160
- Northeast: 0
- Midwest: 80
- South: 69
- West: 7
97.8% of Luttrell residents lived in the same house 1 years ago.
Out of people who lived in different houses, 30.6% lived in this county.
Out of people who lived in different counties, 42.9% lived in Tennessee.
| Luttrell: | 97.8% |
| State average: | 87.0% |
Education attainment for males 25 years and older:
- No schooling: 0
- Nursery to 4th grade: 0
- 5th and 6th grade: 2
- 7th and 8th grade: 31
- 9th grade: 25
- 10th grade: 8
- 11th grade: 11
- 12th grade, no diploma: 0
- High school graduate (or equivalency): 164
- Less than 1 year of college: 14
- Some college more than 1 year, no degree: 33
- Associate degree: 2
- Bachelor's degree: 2
- Master's degree: 0
- Professional school degree: 45
- Doctorate degree: 0

Education attainment for females 25 years and older:
- No schooling: 3
- Nursery to 4th grade: 0
- 5th and 6th grade: 1
- 7th and 8th grade: 13
- 9th grade: 18
- 10th grade: 3
- 11th grade: 8
- 12th grade, no diploma: 0
- High school graduate (or equivalency): 164
- Less than 1 year of college: 15
- Some college more than 1 year, no degree: 34
- Associate degree: 13
- Bachelor's degree: 6
- Master's degree: 0
- Professional school degree: 0
- Doctorate degree: 0


Housing units in structures:
- One, detached: 285
- One, attached: 30
- Two: 26
- Mobile homes: 147
Median worth of mobile homes: $61,048
Housing units lacking complete kitchen facilities in 2022: 15.5%
House/condo owner moved in on average 19 years ago
Renter moved in on average 6 years ago

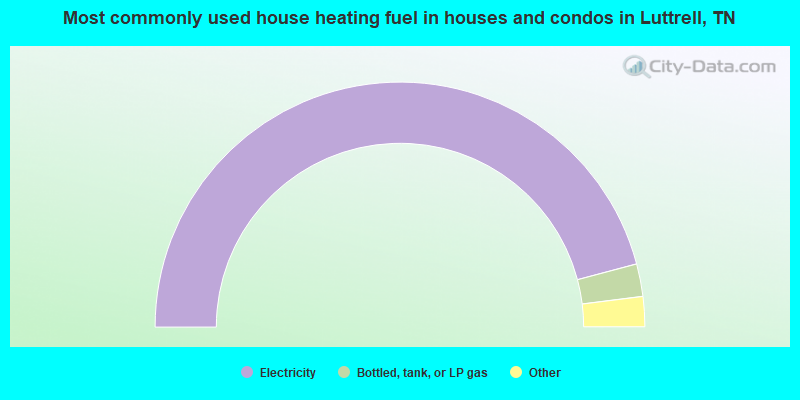
- 92.0%Electricity
- 4.3%Bottled, tank, or LP gas
- 2.0%Fuel oil, kerosene, etc.
- 1.0%No fuel used
- 0.7%Wood
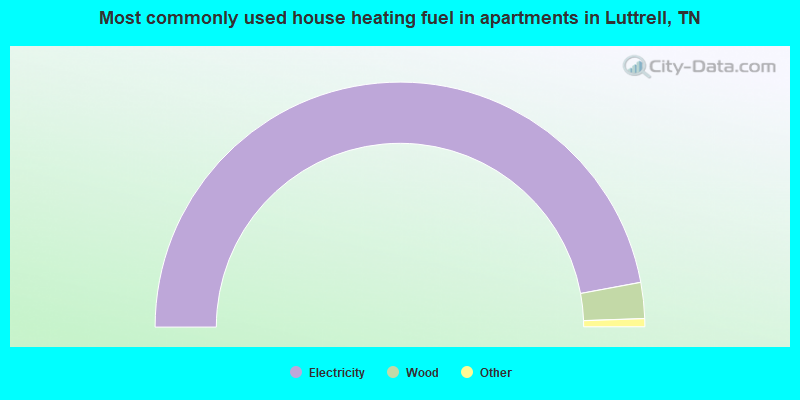
- 95.2%Electricity
- 4.8%Wood
Private vs. public school enrollment:
| Here: | 3.9% |
| Tennessee: | 15.0% |
| Here: | 0.0% |
| Tennessee: | 16.2% |
| Here: | 12.5% |
| Tennessee: | 23.5% |


