Lyerly, GA (Georgia) Houses and Residents
| Lyerly: | $110,421 |
| Georgia: | $297,400 |
Mean price in 2022:
Detached houses: $110,582
Here: $110,582 State: $376,364 Mobile homes: $70,559
Here: $70,559 State: $102,413
Total population: 526 (Urban population: 0, Rural population: 527 (4 farm, 523 nonfarm))
Houses: 219 (203 occupied: 154 owner occupied, 50 renter occupied)
| % of renters here: | 25% |
| State: | 34% |
Housing density: 292 houses/condos per square mile
Median price asked for vacant for-sale houses and condos in 2022 in this county: $83,130.
Median contract rent in 2022: $649
Median rent asked for vacant for-rent units in 2022: $517
Median gross rent in Lyerly, GA in 2022: $876
Housing units in Lyerly with a mortgage: 59 (2 second mortgage, 0 home equity loan, 0 both second mortgage and home equity loan)
Houses without a mortgage: 1
Median household income for houses/condos with a mortgage: $89,681
Median household income for apartments without a mortgage: $52,128
Median monthly housing costs: $695
Compare current foreclosures near Lyerly, GA:
| Photo | Address | Area | Beds / Baths | Price | Details |
|---|---|---|---|---|---|

|
#1
Worsham Rd
Lyerly, GA 30730
|
2,938 sq. feet
|
1 baths - beds |
show details | |

|
#2
Williams St
Lyerly, GA 30730
|
1,640 sq. feet
|
1 baths - beds |
show details | |

|
#3
White Farm Rd
Lyerly, GA 30730
|
- sq. feet
|
- baths - beds |
show details | |

|
#4
Chattooga Ave
Lyerly, GA 30730
|
- sq. feet
|
- baths - beds |
show details | |

|
#5
Oak Hill Rd
Lyerly, GA 30730
|
- sq. feet
|
- baths - beds |
show details | |

|
#6
Walton Creek Dr SW
Rome, GA 30165
|
1,830 sq. feet
|
1 baths 4 beds |
show details | |

|
#7
Wilkins St NW
Rome, GA 30165
|
- sq. feet
|
1 baths 3 beds |
show details | |

|
#8
Race Horse Dr
Summerville, GA 30747
|
3,030 sq. feet
|
1 baths - beds |
show details | |

|
#9
Sidney St
Summerville, GA 30747
|
1,050 sq. feet
|
1 baths - beds |
show details | |

|
#10
11th Ave
Menlo, GA 30731
|
1,688 sq. feet
|
1 baths - beds |
show details |
| Photo | Address | Area | Beds / Baths | Price | Details |
|---|---|---|---|---|---|

|
#11
Roosevelt St
Summerville, GA 30747
|
1,196 sq. feet
|
1 baths - beds |
show details | |

|
#12
Hawkins Dr
Summerville, GA 30747
|
1,375 sq. feet
|
1 baths - beds |
show details | |

|
#13
Hair Lake Rd
Summerville, GA 30747
|
1,414 sq. feet
|
1 baths - beds |
show details | |

|
#14
Green Valley Cir NE
Fort Payne, AL 35967
|
1,221 sq. feet
|
1 baths - beds |
show details | |

|
#15
Ramey St
Summerville, GA 30747
|
1,050 sq. feet
|
1 baths - beds |
show details | |

|
#16
Reynolds Dr
La Fayette, GA 30728
|
1,280 sq. feet
|
1 baths - beds |
show details | |

|
#17
N Elizabeth St
Summerville, GA 30747
|
960 sq. feet
|
1 baths - beds |
show details | |

|
#18
Orchard Hill Rd
Summerville, GA 30747
|
1,008 sq. feet
|
1 baths - beds |
show details | |

|
#19
Old Highway 27
Trion, GA 30753
|
676 sq. feet
|
1 baths - beds |
show details | |

|
#20
Highway 137
Valley Head, AL 35989
|
2,400 sq. feet
|
1 baths - beds |
show details |
| Photo | Address | Area | Beds / Baths | Price | Details |
|---|---|---|---|---|---|

|
#21
Williams Rd
Summerville, GA 30747
|
1,680 sq. feet
|
1 baths - beds |
show details | |

|
#22
Highway 27
Trion, GA 30753
|
1,832 sq. feet
|
1 baths - beds |
show details | |

|
#23
Warren Rd NE
Rome, GA 30165
|
- sq. feet
|
2 baths - beds |
show details | |

|
#24
Pine St
Trion, GA 30753
|
3,157 sq. feet
|
1 baths - beds |
show details | |

|
#25
Peach St
Trion, GA 30753
|
1,207 sq. feet
|
1 baths - beds |
show details | |

|
#26
Park Ave
Trion, GA 30753
|
1,248 sq. feet
|
1 baths - beds |
show details | |

|
#27
Cedar Ave
Summerville, GA 30747
|
1,421 sq. feet
|
1 baths - beds |
show details | |

|
#28
Ramey St
Summerville, GA 30747
|
1,270 sq. feet
|
1 baths - beds |
show details | |

|
#29
Jones St
Summerville, GA 30747
|
1,608 sq. feet
|
1 baths - beds |
show details | |

|
#30
Highway 114
Summerville, GA 30747
|
1,092 sq. feet
|
1 baths - beds |
show details |
| Photo | Address | Area | Beds / Baths | Price | Details |
|---|---|---|---|---|---|

|
#31
Jenkins Gap Rd
Summerville, GA 30747
|
1,356 sq. feet
|
1 baths - beds |
show details | |

|
#32
Montgomery St
Summerville, GA 30747
|
1,009 sq. feet
|
1 baths - beds |
show details | |

|
#33
Walnut Ave
Summerville, GA 30747
|
1,068 sq. feet
|
1 baths - beds |
show details | |

|
#34
Highway 114
Summerville, GA 30747
|
1,648 sq. feet
|
1 baths - beds |
show details | |

|
#35
Lick Skillet Rd
Summerville, GA 30747
|
1,300 sq. feet
|
1 baths - beds |
show details | |

|
#36
Kirby St
Summerville, GA 30747
|
1,466 sq. feet
|
1 baths - beds |
show details | |

|
#37
Oak Tree Ln
Cedar Bluff, AL 35959
|
2,556 sq. feet
|
- baths - beds |
show details | |

|
#38
Hickory St NE
Rome, GA 30161
|
- sq. feet
|
1 baths - beds |
show details | |

|
#39
Godfrey Ave NE
Fort Payne, AL 35967
|
1,640 sq. feet
|
1 baths - beds |
show details | |

|
#40
Wallace Rd
Trion, GA 30753
|
1,372 sq. feet
|
3 baths - beds |
show details |
| Photo | Address | Area | Beds / Baths | Price | Details |
|---|---|---|---|---|---|

|
#41
Willowrun Dr SW
Rome, GA 30165
|
- sq. feet
|
- baths - beds |
show details | |

|
#42
Paris Dr SW
Rome, GA 30165
|
- sq. feet
|
1 baths - beds |
show details | |

|
#43
Hennon Dr NW Apt D
Rome, GA 30165
|
- sq. feet
|
- baths - beds |
show details | |

|
#44
Warren Rd NE
Rome, GA 30165
|
- sq. feet
|
1 baths - beds |
show details | |

|
#45
Walton Creek Dr SW
Rome, GA 30165
|
- sq. feet
|
- baths - beds |
show details | |

|
#46
Castlewood Dr SW
Rome, GA 30165
|
- sq. feet
|
1 baths - beds |
show details | |

|
#47
Hawk Spring Dr SW
Rome, GA 30165
|
- sq. feet
|
- baths - beds |
show details | |

|
#48
Woodbridge Cir NW
Rome, GA 30165
|
- sq. feet
|
- baths - beds |
show details | |

|
#49
Beard Dr NE # B
Rome, GA 30165
|
- sq. feet
|
- baths - beds |
show details | |

|
Check over 1 million property listings on Foreclosure.com!
|
browse all offers | |||


Median year apartment built: 1964
Household type by relationship:
Households: 557- Male householders: 103 (32 living alone), Female householders: 97 (21 living alone)
100 spouses (98 opposite-sex spouses), 9 unmarried partners, (9 opposite-sex unmarried partners), 180 children (166 natural, 0 adopted, 13 stepchildren), 47 grandchildren, 5 brothers or sisters, 6 parents, 0 foster children, 4 other relatives, 3 non-relatives
Size of family households: 63 2-persons, 55 3-persons, 15 4-persons, 5 5-persons, 1 6-persons, 7 7-or-more-persons.
Size of nonfamily households: 54 1-person, 3 2-persons.
89 married couples with children.
10 single-parent households (5 men, 5 women).
97.8% of residents of Lyerly speak English at home.
1.7% of residents speak Spanish at home (78% speak English very well, 22% speak English well).
Foreign born population: 3 (0.5%)
(100.0% of them are naturalized citizens)
| Here: | 5.8 |
| State: | 6.8 |
| Here: | 3.6 |
| State: | 4.6 |

- Bedrooms in owner-occupied houses and condos in Lyerly, Georgia
- 0no bedroom
- 11 bedroom
- 272 bedrooms
- 1093 bedrooms
- 124 bedrooms
- 55+ bedrooms

- Bedrooms in renter-occupied apartments in Lyerly, Georgia
- 0no bedroom
- 91 bedroom
- 252 bedrooms
- 133 bedrooms
- 34 bedrooms
- 05+ bedrooms

- Cars and other vehicles available in Lyerly in owner-occupied houses/condos
- 0no vehicle
- 261 vehicle
- 572 vehicles
- 663 vehicles
- 24 vehicles
- 35+ vehicles

- Cars and other vehicles available in Lyerly in renter-occupied apartments
- 0no vehicle
- 241 vehicle
- 232 vehicles
- 13 vehicles
- 34 vehicles
- 05+ vehicles

- Rooms in owner-occupied houses in Lyerly, Georgia
- 01 room
- 02 rooms
- 103 rooms
- 334 rooms
- 275 rooms
- 266 rooms
- 477 rooms
- 108 rooms
- 19+ rooms

- Rooms in renter-occupied apartments in Lyerly, Georgia
- 01 room
- 02 rooms
- 243 rooms
- 134 rooms
- 35 rooms
- 06 rooms
- 57 rooms
- 48 rooms
- 19+ rooms


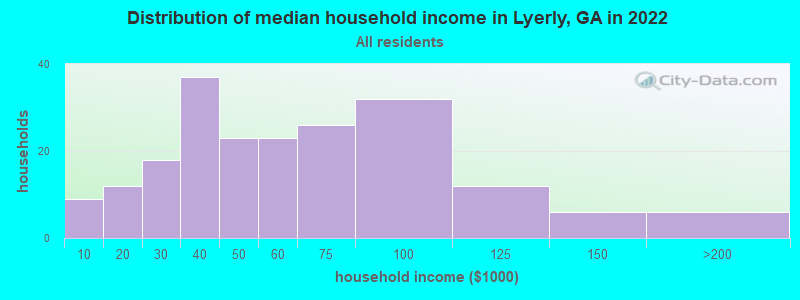
Lyerly, GA household income distribution

- 9Less than $10,000
- 12$10,000 to $19,999
- 18$20,000 to $29,999
- 37$30,000 to $39,999
- 23$40,000 to $49,999
- 23$50,000 to $59,999
- 26$60,000 to $74,999
- 32$75,000 to $99,999
- 12$100,000 to $124,999
- 6$125,000 to $149,999
- 6$150,000 to $199,999
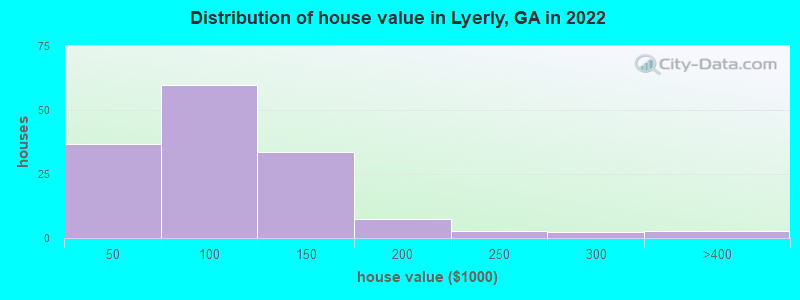
Home value of owner - occupied houses in 2022 in Lyerly, GA
-
- 2Less than $10,000
- 0$20,000 to $24,999
- 11$30,000 to $34,999
- 21$40,000 to $49,999
- 1$50,000 to $59,999
- 13$60,000 to $69,999
- 6$70,000 to $79,999
- 8$80,000 to $89,999
- 7$90,000 to $99,999
- 17$100,000 to $124,999
- 15$125,000 to $149,999
- 7$150,000 to $174,999
- 2$200,000 to $249,999
- 2$250,000 to $299,999
- 2$300,000 to $399,999
Rent paid by renters in 2022 in Lyerly, GA
-
- 2$200 to $249
- 10$300 to $349
- 2$450 to $499
- 4$500 to $549
- 15$600 to $649
- 4$650 to $699
- 2$900 to $999
- 3$1,250 to $1,499
- 6No cash rent


Percentage of workers working in this county: 64.3%
Number of people working at home: 11 (4.8% of all workers)
Travel time to work (commute)
- Less than 5 minutes: 10
- 5 to 9 minutes: 12
- 10 to 14 minutes: 13
- 15 to 19 minutes: 57
- 20 to 24 minutes: 43
- 25 to 29 minutes: 10
- 30 to 34 minutes: 32
- 35 to 39 minutes: 4
- 40 to 44 minutes: 5
- 45 to 59 minutes: 14
- 60 to 89 minutes: 2
- 90 or more minutes: 0
Means of transportation to work:
- Drove a car alone: 174 (74.4%)
- Carpooled: 50 (21.4%)
- Bus or trolley bus: 2 (0.9%)
- Walked: 4 (1.7%)
- Worked at home: 4 (1.7%)

- Unemployment by race in 2022
- Unemployment rate for White non-Hispanic residents
- 4.9%Males
- 4.8%Females

- Year of entry for the foreign-born population in Lyerly, Georgia
- 02010 or later
- 02000 to 2009
- 31990 to 1999
- 01980 to 1989
- 01970 to 1979
- 0Before 1970

First ancestries reported:
- American: 220 (59.1%)
- English: 35 (9.4%)
- German: 25 (6.7%)
- Irish: 11 (3.0%)
- Scottish: 9 (2.4%)
- Scotch-Irish: 1 (0.3%)
Most common places of birth for foreign-born residents (%):
| Lyerly: | 33.3% (1) |
| Georgia: | 0.4% (5,023) |
Place of birth for U.S.-born residents:
- This state: 340
- Other state: 206
- Northeast: 2
- Midwest: 33
- South: 168
- West: 3
93.5% of Lyerly residents lived in the same house 1 years ago.
Out of people who lived in different houses, 30.8% lived in this county.
Out of people who lived in different counties, 89.5% lived in Georgia.
| Lyerly: | 93.5% |
| State average: | 86.6% |
Education attainment for males 25 years and older:
- No schooling: 0
- Nursery to 4th grade: 0
- 5th and 6th grade: 5
- 7th and 8th grade: 13
- 9th grade: 2
- 10th grade: 3
- 11th grade: 7
- 12th grade, no diploma: 32
- High school graduate (or equivalency): 61
- Less than 1 year of college: 20
- Some college more than 1 year, no degree: 16
- Associate degree: 15
- Bachelor's degree: 8
- Master's degree: 2
- Professional school degree: 0
- Doctorate degree: 0

Education attainment for females 25 years and older:
- No schooling: 0
- Nursery to 4th grade: 0
- 5th and 6th grade: 0
- 7th and 8th grade: 0
- 9th grade: 4
- 10th grade: 7
- 11th grade: 12
- 12th grade, no diploma: 1
- High school graduate (or equivalency): 79
- Less than 1 year of college: 14
- Some college more than 1 year, no degree: 23
- Associate degree: 22
- Bachelor's degree: 9
- Master's degree: 6
- Professional school degree: 0
- Doctorate degree: 0


Housing units in structures:
- One, detached: 182
- 3 or 4: 4
- 5 to 9: 9
- Mobile homes: 23
Median worth of mobile homes: $54,801
Housing units lacking complete kitchen facilities in 2022: 5.1%
House/condo owner moved in on average 17 years ago
Renter moved in on average 6 years ago

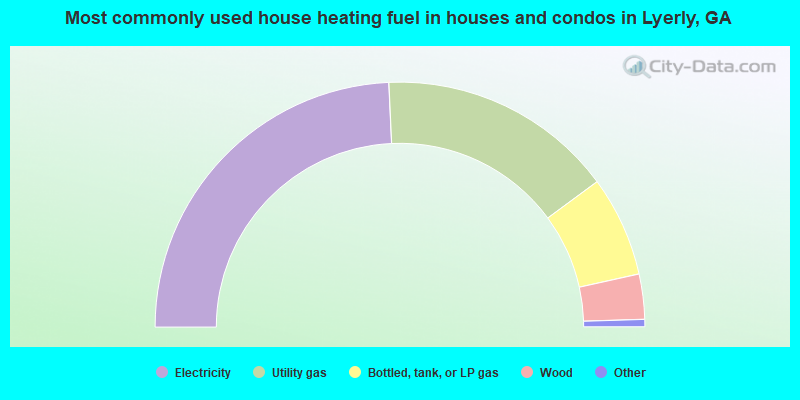
- 49.0%Electricity
- 31.5%Utility gas
- 13.4%Bottled, tank, or LP gas
- 6.0%Wood
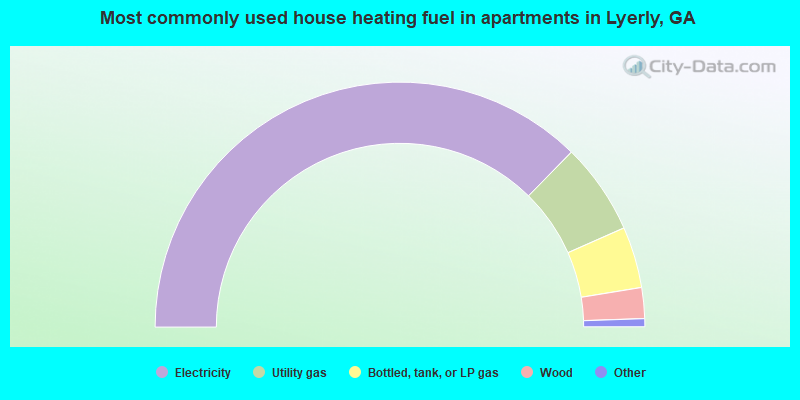
- 75.5%Electricity
- 12.2%Utility gas
- 8.2%Bottled, tank, or LP gas
- 4.1%Wood
Private vs. public school enrollment:
| Here: | 0.0% |
| Georgia: | 12.1% |
| Here: | 0.0% |
| Georgia: | 10.8% |
| Here: | 0.0% |
| Georgia: | 17.1% |


