Lyford, TX (Texas) Houses and Residents
| Lyford: | $68,619 |
| Texas: | $275,400 |
Mean price in 2022:
Detached houses: $118,245
Here: $118,245 State: $369,058 Mobile homes: $120,139
Here: $120,139 State: $124,413
Total population: 2,589 (Urban population: 0, Rural population: 1,989 (all nonfarm))
Houses: 815 (718 occupied: 489 owner occupied, 239 renter occupied)
| % of renters here: | 33% |
| State: | 38% |
Housing density: 762 houses/condos per square mile
Median price asked for vacant for-sale houses and condos in 2022 in this county: $48,560.
Median contract rent in 2022: $421 (lower quartile is $299, upper quartile is $599)
Median rent asked for vacant for-rent units in 2022: $491
Median gross rent in Lyford, TX in 2022: $678
Housing units in Lyford with a mortgage: 85 (0 second mortgage, 0 home equity loan, 0 both second mortgage and home equity loan)
Houses without a mortgage: 0
Median household income for houses/condos with a mortgage: $82,044
Median household income for apartments without a mortgage: $54,520
Median monthly housing costs: $478
Compare current foreclosures near Lyford, TX:
| Photo | Address | Area | Beds / Baths | Price | Details |
|---|---|---|---|---|---|

|
#1
Mesquite Rd
Lyford, TX 78569
|
- sq. feet
|
- baths - beds |
show details | |

|
#2
N Huisache St
Lyford, TX 78569
|
- sq. feet
|
- baths - beds |
show details | |

|
#3
Meredith St
La Feria, TX 78559
|
3,187 sq. feet
|
3 baths 5 beds |
show details | |

|
#4
Robusta Ct
Harlingen, TX 78552
|
3,341 sq. feet
|
4 baths 5 beds |
show details | |

|
#5
Lazy Palm Dr S
Harlingen, TX 78552
|
1,072 sq. feet
|
2 baths 3 beds |
show details | |

|
#6
E Madison Ave
Harlingen, TX 78550
|
1,656 sq. feet
|
2 baths 3 beds |
show details | |

|
#7
N White Ranch Rd
La Feria, TX 78559
|
1,798 sq. feet
|
2 baths 3 beds |
show details | |

|
#8
Green Jay
Harlingen, TX 78552
|
1,039 sq. feet
|
- baths 3 beds |
show details | |

|
#9
N Rose St
Harlingen, TX 78550
|
1,730 sq. feet
|
2 baths 3 beds |
show details | |

|
#10
N 27th St
Harlingen, TX 78550
|
1,203 sq. feet
|
2 baths 3 beds |
show details |
| Photo | Address | Area | Beds / Baths | Price | Details |
|---|---|---|---|---|---|

|
#11
Fm 508
Harlingen, TX 78550
|
1,844 sq. feet
|
2 baths 4 beds |
show details | |

|
#12
Vista Verde Cir W
Harlingen, TX 78552
|
1,197 sq. feet
|
2 baths 3 beds |
show details | |

|
#13
Beckham Rd
Harlingen, TX 78552
|
2,661 sq. feet
|
2 baths 3 beds |
show details | |

|
#14
E Loma Dr
Mercedes, TX 78570
|
1,336 sq. feet
|
1 baths 3 beds |
show details | |

|
#15
Sun Crest Dr
Harlingen, TX 78552
|
1,835 sq. feet
|
2 baths 3 beds |
show details | |

|
#16
E Pierce Ave
Harlingen, TX 78550
|
900 sq. feet
|
1 baths 3 beds |
show details | |

|
#17
Rabb Rd
Santa Rosa, TX 78593
|
1,156 sq. feet
|
2 baths 3 beds |
show details | |

|
#18
Sun Dr
Harlingen, TX 78552
|
1,196 sq. feet
|
2 baths 3 beds |
show details | |

|
#19
Hitching Post Blvd
Harlingen, TX 78552
|
2,530 sq. feet
|
- baths 4 beds |
show details | |

|
#20
Palm Valley Dr E
Harlingen, TX 78552
|
2,554 sq. feet
|
- baths 4 beds |
show details |
| Photo | Address | Area | Beds / Baths | Price | Details |
|---|---|---|---|---|---|

|
#21
W Linda St
Harlingen, TX 78550
|
1,026 sq. feet
|
4 baths - beds |
show details | |

|
#22
Bass Blvd
Harlingen, TX 78552
|
3,719 sq. feet
|
- baths 5 beds |
show details | |

|
#23
N A St
Harlingen, TX 78550
|
1,160 sq. feet
|
1 baths - beds |
show details | |

|
#24
Chapote Ave
Harlingen, TX 78552
|
- sq. feet
|
- baths - beds |
show details | |

|
#25
Lee Ann St
Edcouch, TX 78538
|
- sq. feet
|
- baths - beds |
show details | |

|
#26
Rio Hondo Rd
Harlingen, TX 78550
|
1,405 sq. feet
|
- baths - beds |
show details | |

|
#27
Mile 2 W
Mercedes, TX 78570
|
- sq. feet
|
- baths - beds |
show details | |

|
#28
Bob Dr
Edcouch, TX 78538
|
- sq. feet
|
- baths - beds |
show details | |

|
#29
Gonzalez Rd
Harlingen, TX 78550
|
550 sq. feet
|
- baths - beds |
show details | |

|
#30
Fountain View Ct
Harlingen, TX 78550
|
- sq. feet
|
- baths - beds |
show details |
| Photo | Address | Area | Beds / Baths | Price | Details |
|---|---|---|---|---|---|

|
#31
N 7th St # 475
Harlingen, TX 78550
|
- sq. feet
|
- baths - beds |
show details | |

|
#32
Mile 2 W
Mercedes, TX 78570
|
- sq. feet
|
- baths - beds |
show details | |

|
#33
E Gartuck Cir
Harlingen, TX 78552
|
2,844 sq. feet
|
- baths - beds |
show details | |

|
#34
El Caribe Cir N
La Feria, TX 78559
|
- sq. feet
|
- baths - beds |
show details | |

|
#35
Picnic Dr
Weslaco, TX 78596
|
- sq. feet
|
- baths - beds |
show details | |

|
#36
Road 374
La Feria, TX 78559
|
1,788 sq. feet
|
- baths - beds |
show details | |

|
#37
S Palm Court Dr
Harlingen, TX 78552
|
2,056 sq. feet
|
- baths - beds |
show details | |

|
#38
E Jackson St
Harlingen, TX 78550
|
1,440 sq. feet
|
- baths - beds |
show details | |

|
#39
Baker Potts Rd
Harlingen, TX 78552
|
2,121 sq. feet
|
- baths - beds |
show details | |

|
#40
W Lincoln Ave
Harlingen, TX 78550
|
1,271 sq. feet
|
- baths - beds |
show details |
| Photo | Address | Area | Beds / Baths | Price | Details |
|---|---|---|---|---|---|

|
#41
Cate St
Edinburg, TX 78542
|
- sq. feet
|
- baths - beds |
show details | |

|
#42
E Washington Ave
Harlingen, TX 78550
|
1,448 sq. feet
|
- baths - beds |
show details | |

|
#43
W Monroe Ave
Harlingen, TX 78550
|
2,529 sq. feet
|
- baths - beds |
show details | |

|
#44
Skinner Rd
Edcouch, TX 78538
|
- sq. feet
|
- baths - beds |
show details | |

|
#45
N 26th St Apt 7
Harlingen, TX 78550
|
- sq. feet
|
- baths - beds |
show details | |

|
#46
Countryside Ln
Harlingen, TX 78552
|
- sq. feet
|
- baths - beds |
show details | |

|
#47
Bass Blvd
Harlingen, TX 78552
|
2,673 sq. feet
|
- baths - beds |
show details | |

|
#48
N 77 Sunshine Strip, Pmb 146
Harlingen, TX 78550
|
- sq. feet
|
- baths - beds |
show details | |

|
#49
Sunflower Rd
Edcouch, TX 78538
|
- sq. feet
|
- baths - beds |
show details | |

|
Check over 1 million property listings on Foreclosure.com!
|
browse all offers | |||

Latest news about housing in Lyford, TX collected exclusively by city-data.com from local newspapers, TV, and radio stations

 | Brenwood Park in Katy, TX- a newcomer's review (48 replies) |

Median year apartment built: 1994
Household type by relationship:
Households: 2,608- Male householders: 332 (62 living alone), Female householders: 375 (95 living alone)
348 spouses (334 opposite-sex spouses), 30 unmarried partners, (30 opposite-sex unmarried partners), 1,087 children (1,014 natural, 26 adopted, 46 stepchildren), 246 grandchildren, 20 brothers or sisters, 56 parents, 0 foster children, 99 other relatives, 7 non-relatives
- In group quarters: 3
Size of family households: 168 2-persons, 74 3-persons, 129 4-persons, 91 5-persons, 8 6-persons, 44 7-or-more-persons.
Size of nonfamily households: 166 1-person, 43 2-persons.
234 married couples with children.
173 single-parent households (29 men, 144 women).
25.1% of residents of Lyford speak English at home.
75.0% of residents speak Spanish at home (87% speak English very well, 4% speak English well, 7% speak English not well, 2% don't speak English at all).
0.1% of residents speak Asian or Pacific Island language at home (100% speak English very well).
Foreign born population: 331 (12.7%)
(71.9% of them are naturalized citizens)
| Here: | 5.2 |
| State: | 6.3 |
| Here: | 2.6 |
| State: | 4.0 |

- Bedrooms in owner-occupied houses and condos in Lyford, Texas
- 0no bedroom
- 71 bedroom
- 1222 bedrooms
- 2633 bedrooms
- 554 bedrooms
- 425+ bedrooms

- Bedrooms in renter-occupied apartments in Lyford, Texas
- 85no bedroom
- 791 bedroom
- 32 bedrooms
- 543 bedrooms
- 194 bedrooms
- 05+ bedrooms

- Cars and other vehicles available in Lyford in owner-occupied houses/condos
- 20no vehicle
- 1751 vehicle
- 1522 vehicles
- 743 vehicles
- 564 vehicles
- 125+ vehicles

- Cars and other vehicles available in Lyford in renter-occupied apartments
- 7no vehicle
- 1741 vehicle
- 412 vehicles
- 173 vehicles
- 04 vehicles
- 05+ vehicles

- Rooms in owner-occupied houses in Lyford, Texas
- 01 room
- 02 rooms
- 323 rooms
- 524 rooms
- 2235 rooms
- 706 rooms
- 427 rooms
- 378 rooms
- 349+ rooms

- Rooms in renter-occupied apartments in Lyford, Texas
- 851 room
- 302 rooms
- 263 rooms
- 04 rooms
- 585 rooms
- 416 rooms
- 07 rooms
- 08 rooms
- 09+ rooms


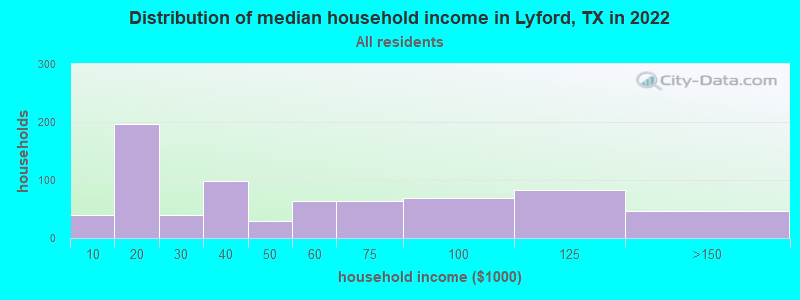
Lyford, TX household income distribution

- 40Less than $10,000
- 197$10,000 to $19,999
- 40$20,000 to $29,999
- 98$30,000 to $39,999
- 30$40,000 to $49,999
- 64$50,000 to $59,999
- 63$60,000 to $74,999
- 69$75,000 to $99,999
- 82$100,000 to $124,999
- 44$125,000 to $149,999
- 2$200,000 or more
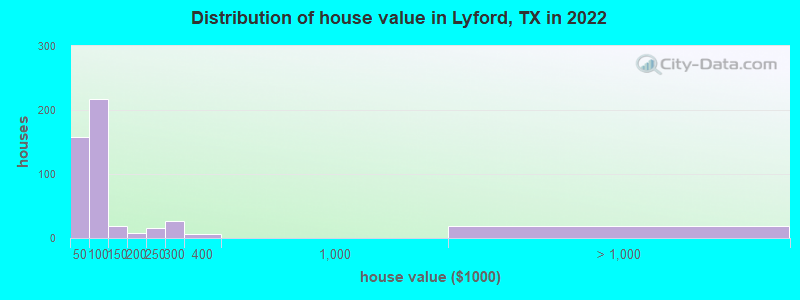
Home value of owner - occupied houses in 2022 in Lyford, TX
-
- 27$15,000 to $19,999
- 42$20,000 to $24,999
- 7$25,000 to $29,999
- 43$30,000 to $34,999
- 36$40,000 to $49,999
- 49$50,000 to $59,999
- 62$60,000 to $69,999
- 25$70,000 to $79,999
- 35$80,000 to $89,999
- 6$90,000 to $99,999
- 15$100,000 to $124,999
- 2$125,000 to $149,999
- 7$150,000 to $174,999
- 15$200,000 to $249,999
- 26$250,000 to $299,999
- 6$300,000 to $399,999
- 18$1,000,000 to $1,499,999
Rent paid by renters in 2022 in Lyford, TX
-
- 46$250 to $299
- 33$300 to $349
- 6$350 to $399
- 30$400 to $449
- 19$500 to $549
- 12$550 to $599
- 17$600 to $649
- 26$1,250 to $1,499
- 37No cash rent

Percentage of workers working in this county: 55.9%
Number of people working at home: 33 (3.1% of all workers)
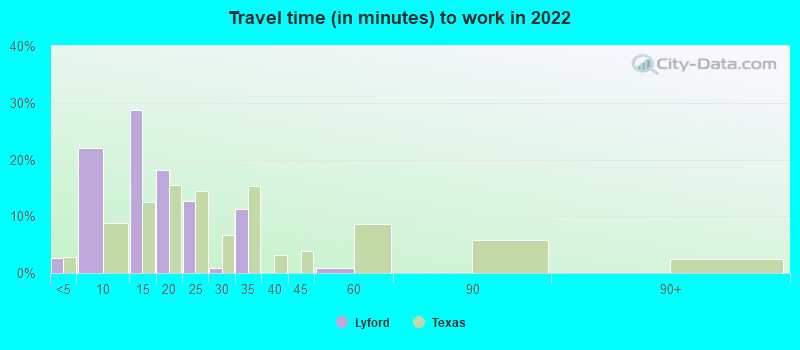
Travel time to work (commute)
- Less than 5 minutes: 61
- 5 to 9 minutes: 165
- 10 to 14 minutes: 170
- 15 to 19 minutes: 95
- 20 to 24 minutes: 133
- 25 to 29 minutes: 47
- 30 to 34 minutes: 105
- 35 to 39 minutes: 117
- 40 to 44 minutes: 39
- 45 to 59 minutes: 53
- 60 to 89 minutes: 0
- 90 or more minutes: 0
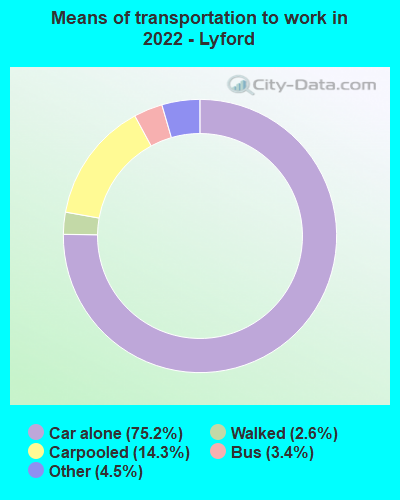
Means of transportation to work:
- Drove a car alone: 426 (68.9%)
- Carpooled: 84 (13.6%)
- Bus: 15 (2.4%)
- Taxi: 30 (4.9%)
- Walked: 15 (2.4%)
- Worked at home: 20 (3.2%)
- Unemployment by race in 2022
- Unemployment rate for two or more race residents
- 4.3%Males
- 6.4%Females
- Unemployment rate for Hispanic or Latino residents
- 3.1%Males
- 6.9%Females

- Year of entry for the foreign-born population in Lyford, Texas
- 312010 or later
- 262000 to 2009
- 1141990 to 1999
- 1321980 to 1989
- 521970 to 1979
- 78Before 1970

First ancestries reported:
- English: 29 (1.4%)
- American: 23 (1.1%)
- Jamaican: 8 (0.4%)
- Irish: 7 (0.3%)
- German: 3 (0.1%)
- Turkish: 3 (0.1%)
Most common places of birth for foreign-born residents (%):
| Lyford: | 94.6% (313) |
| Texas: | 48.4% (2,411,723) |
Place of birth for U.S.-born residents:
- This state: 2,133
- Other state: 91
- Northeast: 0
- Midwest: 15
- South: 17
- West: 60
99.9% of Lyford residents lived in the same house 1 years ago.
Out of people who lived in different houses, 50.0% lived in this county.
| Lyford: | 99.9% |
| State average: | 85.7% |
Education attainment for males 25 years and older:
- No schooling: 61
- Nursery to 4th grade: 16
- 5th and 6th grade: 7
- 7th and 8th grade: 15
- 9th grade: 18
- 10th grade: 49
- 11th grade: 9
- 12th grade, no diploma: 62
- High school graduate (or equivalency): 439
- Less than 1 year of college: 24
- Some college more than 1 year, no degree: 43
- Associate degree: 7
- Bachelor's degree: 80
- Master's degree: 12
- Professional school degree: 0
- Doctorate degree: 0

Education attainment for females 25 years and older:
- No schooling: 75
- Nursery to 4th grade: 36
- 5th and 6th grade: 20
- 7th and 8th grade: 27
- 9th grade: 25
- 10th grade: 20
- 11th grade: 17
- 12th grade, no diploma: 23
- High school graduate (or equivalency): 265
- Less than 1 year of college: 61
- Some college more than 1 year, no degree: 126
- Associate degree: 51
- Bachelor's degree: 136
- Master's degree: 43
- Professional school degree: 0
- Doctorate degree: 0


Housing units in structures:
- One, detached: 621
- 3 or 4: 125
- 50 or more: 26
- Mobile homes: 41
Median worth of mobile homes: $128,139
Housing units lacking complete kitchen facilities in 2022: 4.0%
House/condo owner moved in on average 24 years ago
Renter moved in on average 7 years ago

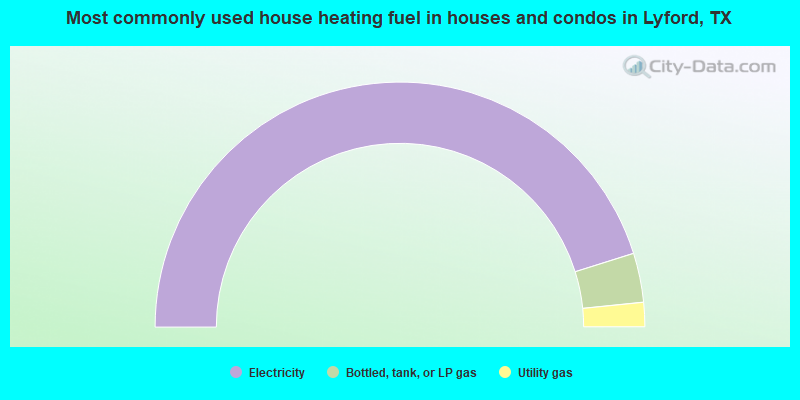
- 90.3%Electricity
- 6.5%Bottled, tank, or LP gas
- 3.2%Utility gas
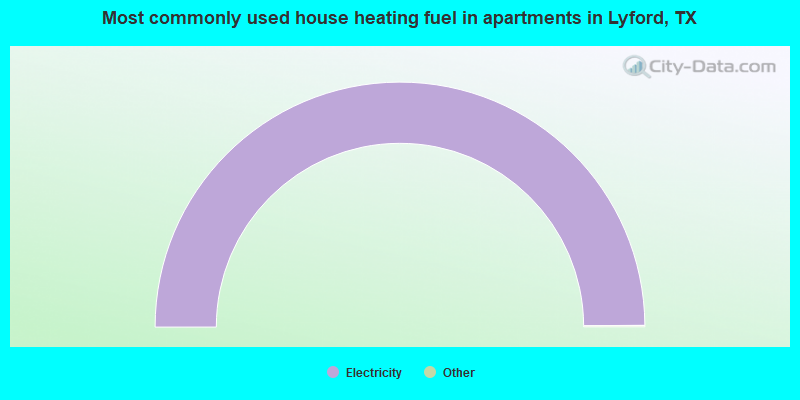
- 100.0%Electricity
Private vs. public school enrollment:
| Here: | 0.0% |
| Texas: | 8.8% |
| Here: | 0.0% |
| Texas: | 8.0% |
| Here: | 0.0% |
| Texas: | 16.2% |


