Lykens, PA (Pennsylvania) Houses and Residents
| Lykens: | $116,845 |
| Pennsylvania: | $245,500 |
Mean price in 2022:
Detached houses: $339,364
Here: $339,364 State: $317,202 Townhouses or other attached units: $99,067
Here: $99,067 State: $254,369 Mobile homes: $64,280
Here: $64,280 State: $92,414
Total population: 1,761 (All urban)
Houses: 914 (762 occupied: 483 owner occupied, 300 renter occupied)
| % of renters here: | 38% |
| State: | 31% |
Housing density: 684 houses/condos per square mile
Median price asked for vacant for-sale houses and condos in 2022: $218,717.
Median contract rent in 2022: $701 (lower quartile is $461, upper quartile is $830)
Median rent asked for vacant for-rent units in 2022: $441
Median gross rent in Lykens, PA in 2022: $818
Housing units in Lykens with a mortgage: 272 (39 second mortgage, 0 home equity loan, 40 both second mortgage and home equity loan)
Houses without a mortgage: 24
Median household income for houses/condos with a mortgage: $74,296
Median household income for apartments without a mortgage: $57,887
Median monthly housing costs: $820
Compare current foreclosures near Lykens, PA:
| Photo | Address | Area | Beds / Baths | Price | Details |
|---|---|---|---|---|---|

|
#1
Main St
Lykens, PA 17048
|
2,015 sq. feet
|
1 baths 3 beds |
show details | |

|
#2
Spruce St
Lykens, PA 17048
|
1,485 sq. feet
|
2 baths 4 beds |
show details | |

|
#3
S 2nd St
Lykens, PA 17048
|
1,420 sq. feet
|
2 baths 4 beds |
show details | |

|
#4
N 2nd St
Lykens, PA 17048
|
1,288 sq. feet
|
1 baths 3 beds |
show details | |

|
#5
Pottsville St
Lykens, PA 17048
|
- sq. feet
|
- baths - beds |
show details | |

|
#6
Specktown Rd
Lykens, PA 17048
|
- sq. feet
|
- baths - beds |
show details | |

|
#7
E Grand Ave
Tower City, PA 17980
|
1,566 sq. feet
|
1 baths 3 beds |
$69,938
|
show details |

|
#8
W Laurel St
Tremont, PA 17981
|
1,065 sq. feet
|
1 baths 2 beds |
$3,132
|
show details |

|
#9
Joseph St
Tower City, PA 17980
|
928 sq. feet
|
1 baths 2 beds |
show details | |

|
#10
S Lancaster St
Lebanon, PA 17046
|
900 sq. feet
|
1 baths 3 beds |
show details |
| Photo | Address | Area | Beds / Baths | Price | Details |
|---|---|---|---|---|---|

|
#11
N Tulpehocken St
Pine Grove, PA 17963
|
600 sq. feet
|
1 baths 2 beds |
show details | |

|
#12
Clover Ln
Halifax, PA 17032
|
1,103 sq. feet
|
1 baths 3 beds |
show details | |

|
#13
Moore St
Millersburg, PA 17061
|
1,614 sq. feet
|
1 baths 3 beds |
show details | |

|
#14
Shawnee Dr
Harrisburg, PA 17112
|
1,092 sq. feet
|
1 baths 3 beds |
show details | |

|
#15
Swatara Creek Dr
Jonestown, PA 17038
|
1,276 sq. feet
|
1 baths 3 beds |
show details | |

|
#16
Armstrong Valley Rd
Halifax, PA 17032
|
1,260 sq. feet
|
1 baths 3 beds |
show details | |

|
#17
Horizon Dr
Fredericksburg, PA 17026
|
1,276 sq. feet
|
2 baths 3 beds |
show details | |

|
#18
E Colliery Ave
Tower City, PA 17980
|
1,160 sq. feet
|
1 baths 3 beds |
show details | |

|
#19
N 4th St
Tower City, PA 17980
|
2,576 sq. feet
|
4 baths 5 beds |
show details | |

|
#20
State Route 72
Jonestown, PA 17038
|
1,517 sq. feet
|
2 baths 4 beds |
show details |
| Photo | Address | Area | Beds / Baths | Price | Details |
|---|---|---|---|---|---|

|
#21
East Market Street
Gratz, PA 17030
|
- sq. feet
|
2 baths 3 beds |
show details | |

|
#22
W Main St
Elizabethville, PA 17023
|
1,470 sq. feet
|
2 baths 4 beds |
show details | |

|
#23
Laurel Grove Rd
Annville, PA 17003
|
1,176 sq. feet
|
1 baths 3 beds |
show details | |

|
#24
Moore Rd
Lebanon, PA 17046
|
1,196 sq. feet
|
1 baths 3 beds |
show details | |

|
#25
Houston Dr
Grantville, PA 17028
|
1,596 sq. feet
|
2 baths 3 beds |
show details | |

|
#26
Evergreen Ln
Palmyra, PA 17078
|
1,966 sq. feet
|
2 baths 3 beds |
show details | |

|
#27
Blue Hen Ct
Harrisburg, PA 17112
|
1,687 sq. feet
|
2 baths 3 beds |
show details | |

|
#28
Samantha Ct
Harrisburg, PA 17112
|
2,528 sq. feet
|
2 baths 4 beds |
show details | |

|
#29
Hickory Hollow Rd
Harrisburg, PA 17112
|
2,672 sq. feet
|
3 baths 4 beds |
show details | |

|
#30
Hickory Hollow Rd
Harrisburg, PA 17112
|
2,672 sq. feet
|
3 baths 4 beds |
show details |
| Photo | Address | Area | Beds / Baths | Price | Details |
|---|---|---|---|---|---|

|
#31
Palm St
Harrisburg, PA 17112
|
960 sq. feet
|
1 baths 3 beds |
show details | |

|
#32
Cobble Stone Dr
Harrisburg, PA 17112
|
2,769 sq. feet
|
2 baths 4 beds |
show details | |

|
#33
Adams Ave
Harrisburg, PA 17112
|
975 sq. feet
|
1 baths 3 beds |
show details | |

|
#34
Peters Mountain Rd
Halifax, PA 17032
|
1,320 sq. feet
|
1 baths 3 beds |
show details | |

|
#35
Williams St
Halifax, PA 17032
|
1,378 sq. feet
|
1 baths 3 beds |
show details | |

|
#36
Linglestown Rd
Harrisburg, PA 17112
|
1,026 sq. feet
|
1 baths 3 beds |
show details | |

|
#37
Pheasant Rd
Grantville, PA 17028
|
1,956 sq. feet
|
2 baths 3 beds |
show details | |

|
#38
Jonestown Rd
Grantville, PA 17028
|
640 sq. feet
|
1 baths 2 beds |
show details | |

|
#39
Blue Heron Ln
Palmyra, PA 17078
|
2,657 sq. feet
|
2 baths 4 beds |
show details | |

|
#40
Rider Ln
Hummelstown, PA 17036
|
1,340 sq. feet
|
2 baths 3 beds |
show details |
| Photo | Address | Area | Beds / Baths | Price | Details |
|---|---|---|---|---|---|

|
#41
Ridge Rd
Grantville, PA 17028
|
1,176 sq. feet
|
1 baths 3 beds |
show details | |

|
#42
Railroad St
Millersburg, PA 17061
|
1,288 sq. feet
|
1 baths 3 beds |
show details | |

|
#43
N Pine St
Liverpool, PA 17045
|
- sq. feet
|
2 baths 2 beds |
show details | |

|
#44
Level Rd
Hummelstown, PA 17036
|
2,994 sq. feet
|
3 baths 5 beds |
show details | |

|
#45
Union Church Rd
Halifax, PA 17032
|
1,040 sq. feet
|
1 baths 3 beds |
show details | |

|
#46
Greystone Dr
Harrisburg, PA 17112
|
1,854 sq. feet
|
2 baths 3 beds |
show details | |

|
#47
W Market St
Williamstown, PA 17098
|
1,318 sq. feet
|
1 baths 3 beds |
show details | |

|
#48
Tunnel St
Williamstown, PA 17098
|
1,414 sq. feet
|
1 baths 3 beds |
show details | |

|
#49
State Route 209
Elizabethville, PA 17023
|
1,118 sq. feet
|
1 baths 3 beds |
show details | |

|
Check over 1 million property listings on Foreclosure.com!
|
browse all offers | |||

Latest news about housing in Lykens, PA collected exclusively by city-data.com from local newspapers, TV, and radio stations

 | The Raven Night Club...near Harrisburg 1966ish (35 replies) |
| Thinking of Shenandoah (2 replies) |
| Relocating to Harrisburg in 6 weeks!! (18 replies) |
| In Harrisburg is the Residences at Governor's Square a good place to live? (5 replies) |

Median year apartment built: 1943
Household type by relationship:
Households: 1,646- Male householders: 454 (119 living alone), Female householders: 307 (137 living alone)
298 spouses (298 opposite-sex spouses), 78 unmarried partners, (78 opposite-sex unmarried partners), 410 children (394 natural, 12 adopted, 4 stepchildren), 21 grandchildren, 11 brothers or sisters, 20 parents, 0 foster children, 18 other relatives, 25 non-relatives
Size of family households: 206 2-persons, 115 3-persons, 35 4-persons, 45 5-persons.
Size of nonfamily households: 263 1-person, 141 2-persons, 4 4-persons.
172 married couples with children.
139 single-parent households (40 men, 99 women).
97.4% of residents of Lykens speak English at home.
1.2% of residents speak Spanish at home (79% speak English very well, 21% speak English well).
0.6% of residents speak Asian or Pacific Island language at home (100% speak English very well).
Foreign born population: 15 (0.9%)
(106.7% of them are naturalized citizens)
| Here: | 6.9 |
| State: | 6.8 |
| Here: | 5.9 |
| State: | 4.3 |

- Bedrooms in owner-occupied houses and condos in Lykens, Pennsylvania
- 0no bedroom
- 171 bedroom
- 772 bedrooms
- 2553 bedrooms
- 1244 bedrooms
- 115+ bedrooms

- Bedrooms in renter-occupied apartments in Lykens, Pennsylvania
- 12no bedroom
- 831 bedroom
- 652 bedrooms
- 293 bedrooms
- 1104 bedrooms
- 05+ bedrooms

- Cars and other vehicles available in Lykens in owner-occupied houses/condos
- 19no vehicle
- 1271 vehicle
- 1782 vehicles
- 933 vehicles
- 494 vehicles
- 195+ vehicles

- Cars and other vehicles available in Lykens in renter-occupied apartments
- 67no vehicle
- 2111 vehicle
- 222 vehicles
- 03 vehicles
- 04 vehicles
- 05+ vehicles

- Rooms in owner-occupied houses in Lykens, Pennsylvania
- 01 room
- 02 rooms
- 83 rooms
- 254 rooms
- 585 rooms
- 1126 rooms
- 1007 rooms
- 928 rooms
- 889+ rooms

- Rooms in renter-occupied apartments in Lykens, Pennsylvania
- 121 room
- 32 rooms
- 833 rooms
- 04 rooms
- 365 rooms
- 326 rooms
- 1107 rooms
- 68 rooms
- 179+ rooms


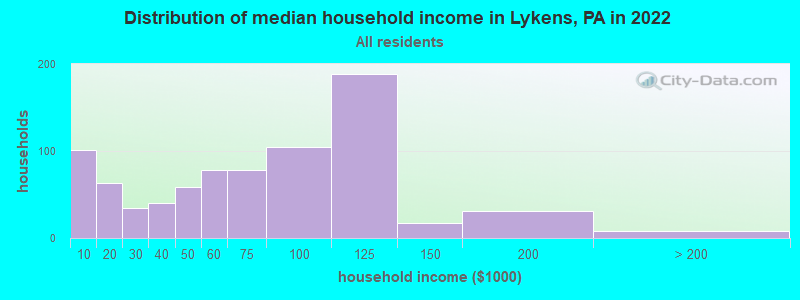
Lykens, PA household income distribution

- 101Less than $10,000
- 63$10,000 to $19,999
- 35$20,000 to $29,999
- 40$30,000 to $39,999
- 59$40,000 to $49,999
- 78$50,000 to $59,999
- 78$60,000 to $74,999
- 105$75,000 to $99,999
- 189$100,000 to $124,999
- 17$125,000 to $149,999
- 31$150,000 to $199,999
- 8$200,000 or more
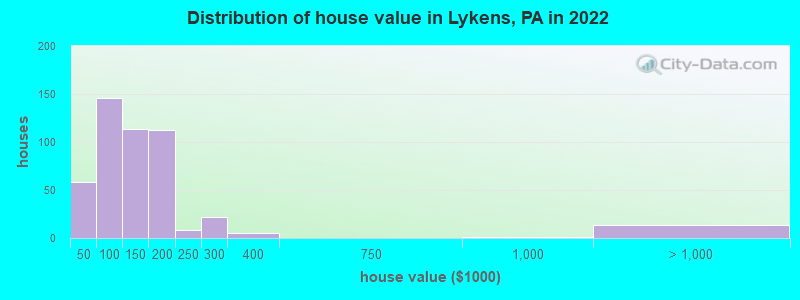
Home value of owner - occupied houses in 2022 in Lykens, PA
-
- 3$20,000 to $24,999
- 5$30,000 to $34,999
- 18$35,000 to $39,999
- 31$40,000 to $49,999
- 23$50,000 to $59,999
- 4$60,000 to $69,999
- 17$70,000 to $79,999
- 54$80,000 to $89,999
- 15$90,000 to $99,999
- 75$100,000 to $124,999
- 38$125,000 to $149,999
- 89$150,000 to $174,999
- 23$175,000 to $199,999
- 8$200,000 to $249,999
- 22$250,000 to $299,999
- 5$300,000 to $399,999
- 1$750,000 to $999,999
- 13$2,000,000 or more
Rent paid by renters in 2022 in Lykens, PA
-
- 7Less than $100
- 17$150 to $199
- 3$200 to $249
- 23$250 to $299
- 5$300 to $349
- 7$400 to $449
- 10$450 to $499
- 22$500 to $549
- 15$550 to $599
- 2$600 to $649
- 17$650 to $699
- 7$700 to $749
- 23$750 to $799
- 161$800 to $899
- 24No cash rent


Percentage of workers working in this county: 74.1%
Number of people working at home: 187 (23.5% of all workers)
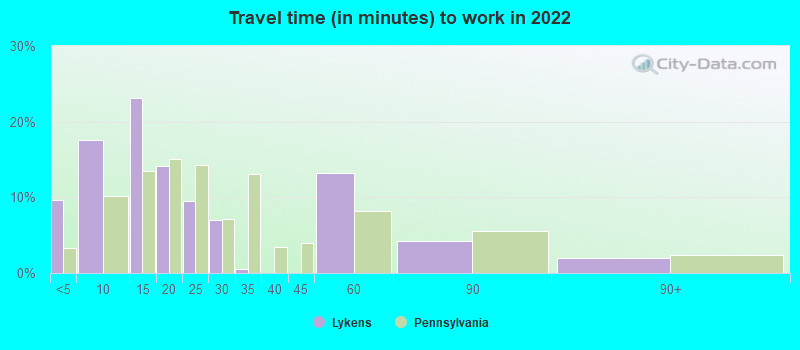
Travel time to work (commute)
- Less than 5 minutes: 36
- 5 to 9 minutes: 32
- 10 to 14 minutes: 27
- 15 to 19 minutes: 188
- 20 to 24 minutes: 29
- 25 to 29 minutes: 35
- 30 to 34 minutes: 26
- 35 to 39 minutes: 0
- 40 to 44 minutes: 16
- 45 to 59 minutes: 102
- 60 to 89 minutes: 136
- 90 or more minutes: 14
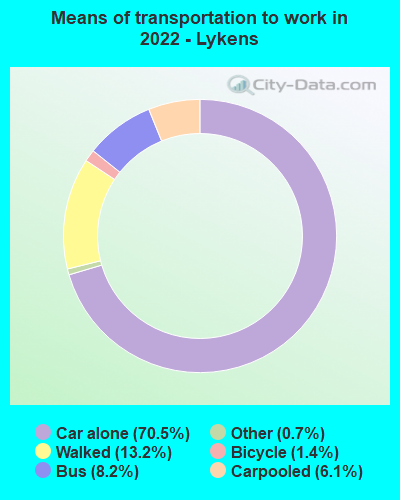
Means of transportation to work:
- Drove a car alone: 284 (51.7%)
- Carpooled: 21 (3.8%)
- Bus: 33 (6.0%)
- Taxi: 3 (0.5%)
- Bicycle: 3 (0.5%)
- Walked: 56 (10.2%)
- Worked at home: 187 (34.1%)

- Unemployment by race in 2022
- Unemployment rate for White non-Hispanic residents
- 7.3%Males
- 2.2%Females

- Year of entry for the foreign-born population in Lykens, Pennsylvania
- 02010 or later
- 42000 to 2009
- 01990 to 1999
- 111980 to 1989
- 111970 to 1979
- 3Before 1970
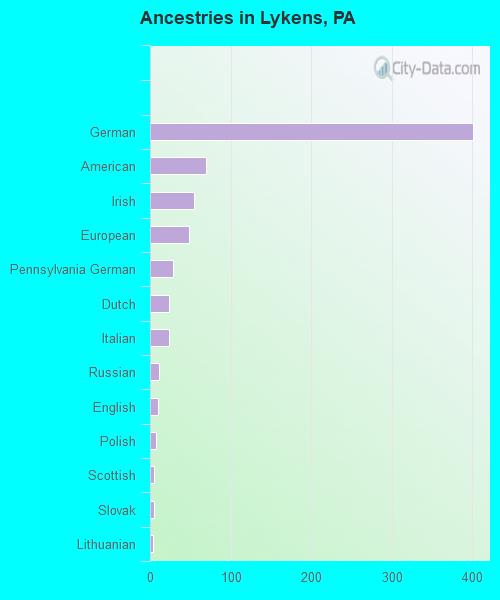
First ancestries reported:
- German: 401 (48.5%)
- American: 69 (8.3%)
- Irish: 55 (6.7%)
- European: 49 (5.9%)
- Pennsylvania German: 28 (3.4%)
- Dutch: 24 (2.9%)
- Italian: 24 (2.9%)
- Russian: 11 (1.3%)
- English: 10 (1.2%)
- Polish: 7 (0.8%)
- Scottish: 5 (0.6%)
- Slovak: 5 (0.6%)
- Lithuanian: 4 (0.5%)
- Welsh: 2 (0.2%)
Most common places of birth for foreign-born residents (%):
| Lykens: | 46.2% (6) |
| Pennsylvania: | 2.2% (21,039) |
| Lykens: | 30.8% (4) |
| Pennsylvania: | 5.8% (54,190) |
| Lykens: | 23.1% (3) |
| Pennsylvania: | 3.3% (31,542) |
Place of birth for U.S.-born residents:
- This state: 1,436
- Other state: 83
- Northeast: 35
- Midwest: 0
- South: 35
- West: 11
95.2% of Lykens residents lived in the same house 1 years ago.
Out of people who lived in different houses, 28.3% lived in this county.
Out of people who lived in different counties, 45.1% lived in Pennsylvania.
| Lykens: | 95.2% |
| State average: | 89.3% |
Education attainment for males 25 years and older:
- No schooling: 5
- Nursery to 4th grade: 3
- 5th and 6th grade: 0
- 7th and 8th grade: 12
- 9th grade: 3
- 10th grade: 4
- 11th grade: 28
- 12th grade, no diploma: 10
- High school graduate (or equivalency): 367
- Less than 1 year of college: 13
- Some college more than 1 year, no degree: 88
- Associate degree: 30
- Bachelor's degree: 39
- Master's degree: 47
- Professional school degree: 0
- Doctorate degree: 0

Education attainment for females 25 years and older:
- No schooling: 4
- Nursery to 4th grade: 9
- 5th and 6th grade: 0
- 7th and 8th grade: 13
- 9th grade: 19
- 10th grade: 2
- 11th grade: 5
- 12th grade, no diploma: 14
- High school graduate (or equivalency): 191
- Less than 1 year of college: 34
- Some college more than 1 year, no degree: 109
- Associate degree: 75
- Bachelor's degree: 48
- Master's degree: 3
- Professional school degree: 0
- Doctorate degree: 0


Housing units in structures:
- One, detached: 513
- One, attached: 164
- Two: 61
- 3 or 4: 72
- 5 to 9: 3
- 20 to 49: 43
- 50 or more: 7
- Mobile homes: 48
Median worth of mobile homes: $57,978
Housing units lacking complete kitchen facilities in 2022: 8.8%
House/condo owner moved in on average 16 years ago
Renter moved in on average 12 years ago

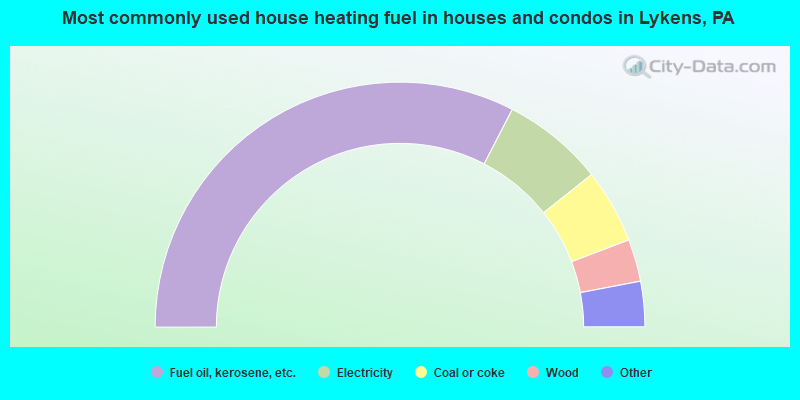
- 65.5%Fuel oil, kerosene, etc.
- 13.5%Electricity
- 9.9%Coal or coke
- 5.6%Wood
- 3.9%Utility gas
- 1.1%Bottled, tank, or LP gas
- 0.6%Other fuel
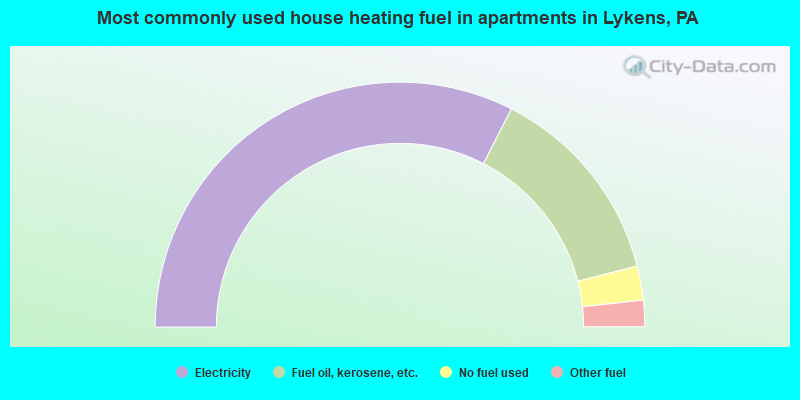
- 65.1%Electricity
- 27.0%Fuel oil, kerosene, etc.
- 4.5%No fuel used
- 3.5%Other fuel
Private vs. public school enrollment:
| Here: | 9.0% |
| Pennsylvania: | 15.7% |
| Here: | 0.0% |
| Pennsylvania: | 13.4% |
| Here: | 0.0% |
| Pennsylvania: | 39.8% |


