Lynbrook, NY (New York) Houses and Residents
Estimated median house or condo value in 2022: $606,058 (it was $219,500 in 2000 )
Lynbrook:
$606,058New York:
$400,400
Lower value quartile - upper value quartile: $500,054 - $715,459Mean price in 2022: Detached houses: $639,399 Here:
$639,399State:
$476,719
Townhouses or other attached units: $459,593 Here:
$459,593State:
$699,270
In 2-unit structures: $648,768 Here:
$648,768State:
$713,077
In 3-to-4-unit structures: $367,566 Here:
$367,566State:
$764,568
In 5-or-more-unit structures: $430,112 Here:
$430,112State:
$912,009
Total population: 19,558 (All urban)
Houses: 7,459 (7,064 occupied: 5,215 owner occupied, 1,836 renter occupied )
% of renters here:
26%State:
46%
Housing density: 3,731 houses/condos per square mile
Median price asked for vacant for-sale houses and condos in 2022: $377,307.
Median contract rent in 2022: $1,795 (lower quartile is $1,408, upper quartile is over $2,000)
Median rent asked for vacant for-rent units in 2022: $3,876
Median gross rent in Lynbrook, NY in 2022: $1,895
Housing units in Lynbrook with a mortgage: 3,342 (335 second mortgage, 0 home equity loan, 269 both second mortgage and home equity loan )Houses without a mortgage: 51
Median household income for houses/condos with a mortgage: $176,132
Median household income for apartments without a mortgage: $101,053
Median monthly housing costs: $2,314
Data:
Median house or condo value ($)
Median house or condo value ($ change since 2000)
Median house or condo value ($) - White
Median house or condo value ($) - Black or African American
Median house or condo value ($) - Asian
Median house or condo value ($) - Hispanic or Latino
Median house or condo value ($) - American Indian and Alaska Native
Median house or condo value ($) - Multirace
Median house or condo value ($) - Other Race
Median price asked for mobile homes ($)
Household density (households per square mile)
Mean house or condo value by units in structure - 1, detached ($)
Mean house or condo value by units in structure - 1, attached ($)
Mean house or condo value by units in structure - 2 ($)
Mean house or condo value by units in structure by units in structure - 3 or 4 ($)
Mean house or condo value by units in structure - 5 or more ($)
Mean house or condo value by units in structure - Boat, RV, van, etc. ($)
Mean house or condo value by units in structure - Mobile home ($)
Median contract rent ($)
Median contract rent - Lower quartile ($)
Median contract rent - Upper quartile ($)
Median gross rent ($)
Urban houses (%)
Rural houses (%)
Houses occupied (%)
Houses occupied (% change since 2000)
Houses owner occupied (%)
Houses owner occupied (% change since 2000)
Houses renter occupied (%)
Houses renter occupied (% change since 2000)
Vacant housing units - For rent (%)
Vacant housing units - For rent (% change since 2000)
Vacant housing units - For sale only (%)
Vacant housing units - For sale only (% change since 2000)
Vacant housing units - Rented or sold, not occupied (%)
Vacant housing units - Rented or sold, not occupied (% change since 2000)
Vacant housing units - For seasonal, recreational, or occasional use (%)
Vacant housing units - For seasonal, recreational, or occasional use (% change since 2000)
Vacant housing units - For migrant workers (%)
Vacant housing units - For migrant workers (% change since 2000)
Vacant housing units - Other vacant (%)
Vacant housing units - Other vacant (% change since 2000)
Median monthly housing costs ($)
Median household income for houses/condos with a mortgage ($)
Median household income for houses/condos without a mortgage ($)
Median household income ($)
Median household income ($) - White
Median household income ($) - Black or African American
Median household income ($) - Asian
Median household income ($) - Hispanic or Latino
Median household income ($) - American Indian and Alaska Native
Median household income ($) - Multirace
Median household income ($) - Other Race
Mortgage status - with mortgage (%)
Mortgage status - with second mortgage (%)
Mortgage status - with home equity loan (%)
Mortgage status - with both second mortgage and home equity loan (%)
Mortgage status - without a mortgage (%)
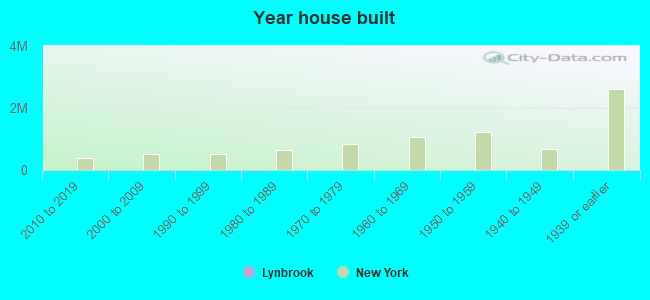
Median year house/condo built
Median year apartment built
Household type by relationship - Male householder living alone (%)
Household type by relationship - Male householder not living alone (%)
Household type by relationship - Female householder living alone (%)
Household type by relationship - Female householder not living alone (%)
Household type by relationship - Opposite-Sex spouse (%)
Household type by relationship - Same-Sex spouse (%)
Household type by relationship - Opposite-Sex unmarried partner (%)
Household type by relationship - Same-Sex unmarried partner (%)
Household type by relationship - In group quarters (%)
Size of family households - 2-person household (%)
Size of family households - 3-person household (%)
Size of family households - 4-person household (%)
Size of family households - 5-person household (%)
Size of family households - 6-person household (%)
Size of family households - 7-or-more-person household (%)
Size of nonfamily households - 1-person household (%)
Size of nonfamily households - 2-person household (%)
Size of nonfamily households - 3-person household (%)
Size of nonfamily households - 4-person household (%)
Size of nonfamily households - 5-person household (%)
Size of nonfamily households - 6-person household (%)
Size of nonfamily households - 7-or-moreperson household (%)
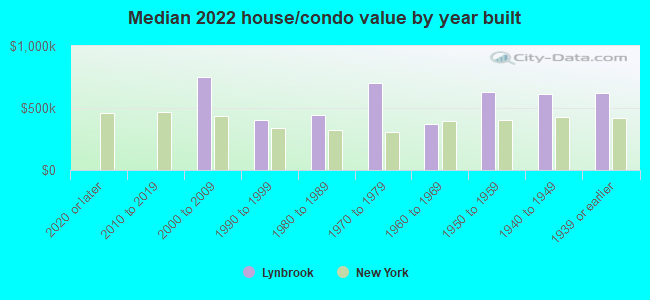
Year house built - Built 2010 or later (%)
Year house built - Built 2000 to 2009 (%)
Year house built - Built 1990 to 1999 (%)
Year house built - Built 1980 to 1989 (%)
Year house built - Built 1970 to 1979 (%)
Year house built - Built 1960 to 1969 (%)
Year house built - Built 1950 to 1959 (%)
Year house built - Built 1940 to 1949 (%)
Year house built - Built 1939 or earlier (%)
Median number of rooms in houses and condos
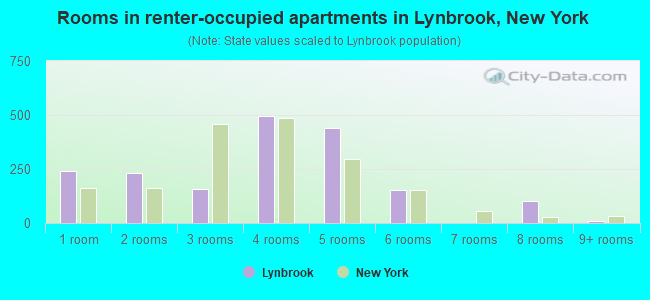
Median number of rooms in apartments
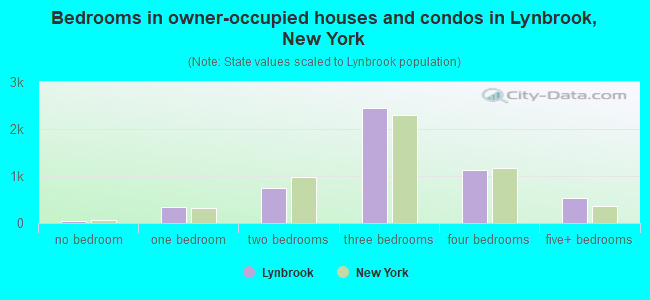
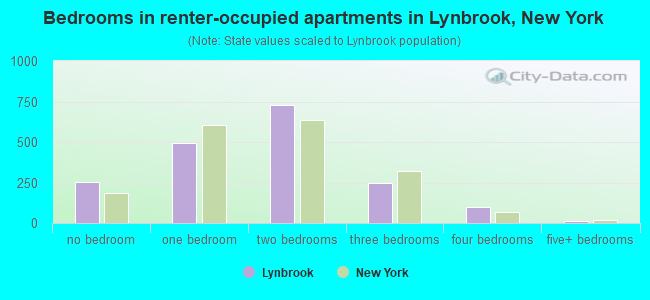
Median number of bedrooms in owner occupied houses
Mean number of bedrooms in owner occupied houses
Median number of bedrooms in renter occupied houses
Mean number of bedrooms in renter occupied houses
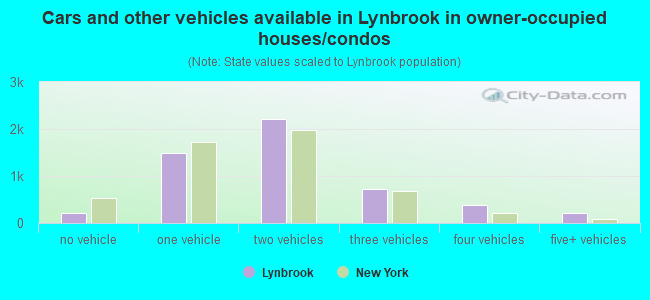
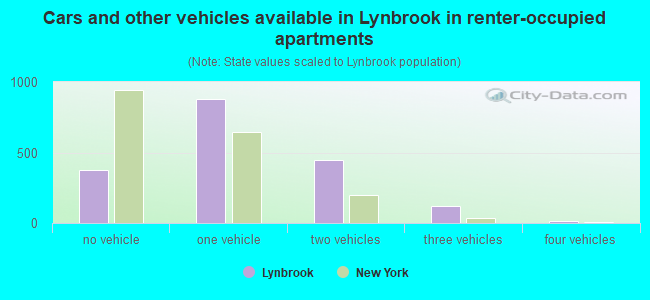
Median number of vehichles in owner occupied houses
Mean number of vehichles in owner occupied houses
Median number of vehichles in renter occupied houses
Mean number of vehichles in renter occupied houses
Rooms in owner-occupied houses - 1 room (%)
Rooms in owner-occupied houses - 2 rooms (%)
Rooms in owner-occupied houses - 3 rooms (%)
Rooms in owner-occupied houses - 4 rooms (%)
Rooms in owner-occupied houses - 5 rooms (%)
Rooms in owner-occupied houses - 6 rooms (%)
Rooms in owner-occupied houses - 7 rooms (%)
Rooms in owner-occupied houses - 8 rooms (%)
Rooms in owner-occupied houses - 9+ rooms (%)
Rooms in renter-occupied houses - 1 room (%)
Rooms in renter-occupied houses - 2 rooms (%)
Rooms in renter-occupied houses - 3 rooms (%)
Rooms in renter-occupied houses - 4 rooms (%)
Rooms in renter-occupied houses - 5 rooms (%)
Rooms in renter-occupied houses - 6 rooms (%)
Rooms in renter-occupied houses - 7 rooms (%)
Rooms in renter-occupied houses - 8 rooms (%)
Rooms in renter-occupied houses - 9+ rooms (%)
Bedrooms in owner-occupied houses - no bedrooms (%)
Bedrooms in owner-occupied houses - 1 bedroom (%)
Bedrooms in owner-occupied houses - 2 bedrooms (%)
Bedrooms in owner-occupied houses - 3 bedrooms (%)
Bedrooms in owner-occupied houses - 4 bedrooms (%)
Bedrooms in owner-occupied houses - 5+ bedrooms (%)
Bedrooms in renter-occupied houses - no bedrooms (%)
Bedrooms in renter-occupied houses - 1 bedroom (%)
Bedrooms in renter-occupied houses - 2 bedrooms (%)
Bedrooms in renter-occupied houses - 3 bedrooms (%)
Bedrooms in renter-occupied houses - 4 bedrooms (%)
Bedrooms in renter-occupied houses - 5+ bedrooms (%)
Vehicles available in owner-occupied houses - no vehicle available (%)
Vehicles available in owner-occupied houses - 1 vehicle available(%)
Vehicles available in owner-occupied houses - 2 Vehicles available (%)
Vehicles available in owner-occupied houses - 3 Vehicles available (%)
Vehicles available in owner-occupied houses - 4 Vehicles available (%)
Vehicles available in owner-occupied houses - 5+ Vehicles available (%)
Vehicles available in renter-occupied houses - no vehicle available (%)
Vehicles available in renter-occupied houses - 1 vehicle available (%)
Vehicles available in renter-occupied houses - 2 Vehicles available (%)
Vehicles available in renter-occupied houses - 3 Vehicles available (%)
Vehicles available in renter-occupied houses - 4 Vehicles available (%)
Vehicles available in renter-occupied houses - 5+ Vehicles available (%)
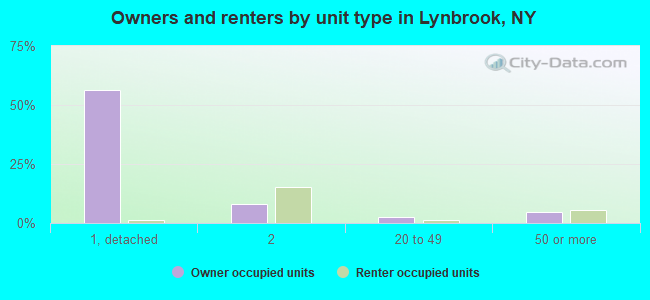
Housing units in structures - 1, detached (%)
Housing units in structures - 1, attached (%)
Housing units in structures - 2 (%)
Housing units in structures - 3 or 4 (%)
Housing units in structures - 5 to 9 (%)
Housing units in structures - 10 to 19 (%)
Housing units in structures - 20 to 49 (%)
Housing units in structures - 50 or more (%)
Housing units in structures - Mobile home (%)
Housing units in structures - Boat, RV, van, etc. (%)
Housing units in structures - Owners - 1, detached (%)
Housing units in structures - Owners - 1, attached (%)
Housing units in structures - Owners - 2 (%)
Housing units in structures - Owners - 3 or 4 (%)
Housing units in structures - Owners - 5 to 9 (%)
Housing units in structures - Owners - 10 to 19 (%)
Housing units in structures - Owners - 20 to 49 (%)
Housing units in structures - Owners - 50 or more (%)
Housing units in structures - Owners - Mobile home (%)
Housing units in structures - Owners - Boat, RV, van, etc. (%)
Housing units in structures - Renters - 1, detached (%)
Housing units in structures - Renters - 1, attached (%)
Housing units in structures - Renters - 2 (%)
Housing units in structures - Renters - 3 or 4 (%)
Housing units in structures - Renters - 5 to 9 (%)
Housing units in structures - Renters - 10 to 19 (%)
Housing units in structures - Renters - 20 to 49 (%)
Housing units in structures - Renters - 50 or more (%)
Housing units in structures - Renters - Mobile home (%)
Housing units in structures - Renters - Boat, RV, van, etc. (%)
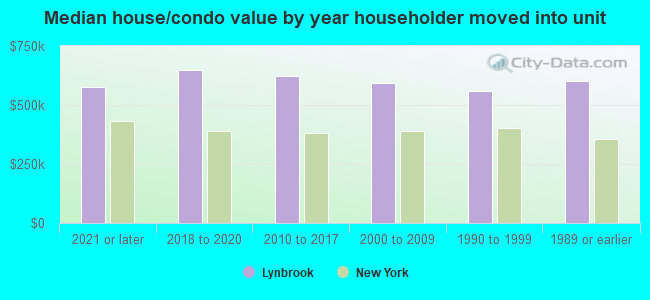
House/condo owner moved in on average (years ago)
Renter moved in on average (years ago)
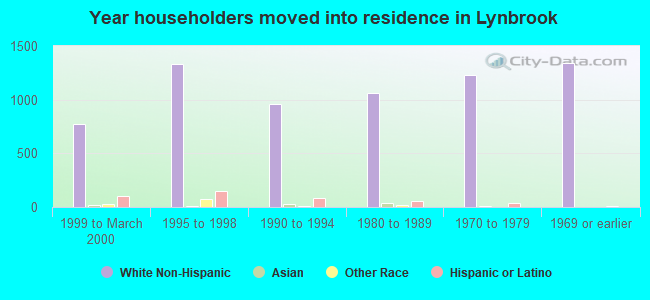
Year householder moved into unit - Moved in 1999 to March 2000 (%)
Year householder moved into unit - Moved in 1999 to March 2000 (%) - White
Year householder moved into unit - Moved in 1999 to March 2000 (%) - Black or African American
Year householder moved into unit - Moved in 1999 to March 2000 (%) - Asian
Year householder moved into unit - Moved in 1999 to March 2000 (%) - Hispanic or Latino
Year householder moved into unit - Moved in 1999 to March 2000 (%) - American Indian and Alaska Native
Year householder moved into unit - Moved in 1999 to March 2000 (%) - Multirace
Year householder moved into unit - Moved in 1999 to March 2000 (%) - Other Race
Year householder moved into unit - Moved in 1995 to 1998 (%)
Year householder moved into unit - Moved in 1995 to 1998 (%) - White
Year householder moved into unit - Moved in 1995 to 1998 (%) - Black or African American
Year householder moved into unit - Moved in 1995 to 1998 (%) - Asian
Year householder moved into unit - Moved in 1995 to 1998 (%) - Hispanic or Latino
Year householder moved into unit - Moved in 1995 to 1998 (%) - American Indian and Alaska Native
Year householder moved into unit - Moved in 1995 to 1998 (%) - Multirace
Year householder moved into unit - Moved in 1995 to 1998 (%) - Other Race
Year householder moved into unit - Moved in 1990 to 1994 (%)
Year householder moved into unit - Moved in 1990 to 1994 (%) - White
Year householder moved into unit - Moved in 1990 to 1994 (%) - Black or African American
Year householder moved into unit - Moved in 1990 to 1994 (%) - Asian
Year householder moved into unit - Moved in 1990 to 1994 (%) - Hispanic or Latino
Year householder moved into unit - Moved in 1990 to 1994 (%) - American Indian and Alaska Native
Year householder moved into unit - Moved in 1990 to 1994 (%) - Multirace
Year householder moved into unit - Moved in 1990 to 1994 (%) - Other Race
Year householder moved into unit - Moved in 1980 to 1989 (%)
Year householder moved into unit - Moved in 1980 to 1989 (%) - White
Year householder moved into unit - Moved in 1980 to 1989 (%) - Black or African American
Year householder moved into unit - Moved in 1980 to 1989 (%) - Asian
Year householder moved into unit - Moved in 1980 to 1989 (%) - Hispanic or Latino
Year householder moved into unit - Moved in 1980 to 1989 (%) - American Indian and Alaska Native
Year householder moved into unit - Moved in 1980 to 1989 (%) - Multirace
Year householder moved into unit - Moved in 1980 to 1989 (%) - Other Race
Year householder moved into unit - Moved in 1970 to 1979 (%)
Year householder moved into unit - Moved in 1970 to 1979 (%) - White
Year householder moved into unit - Moved in 1970 to 1979 (%) - Black or African American
Year householder moved into unit - Moved in 1970 to 1979 (%) - Asian
Year householder moved into unit - Moved in 1970 to 1979 (%) - Hispanic or Latino
Year householder moved into unit - Moved in 1970 to 1979 (%) - American Indian and Alaska Native
Year householder moved into unit - Moved in 1970 to 1979 (%) - Multirace
Year householder moved into unit - Moved in 1970 to 1979 (%) - Other Race
Year householder moved into unit - Moved in 1969 or earlier (%)
Year householder moved into unit - Moved in 1969 or earlier (%) - White
Year householder moved into unit - Moved in 1969 or earlier (%) - Black or African American
Year householder moved into unit - Moved in 1969 or earlier (%) - Asian
Year householder moved into unit - Moved in 1969 or earlier (%) - Hispanic or Latino
Year householder moved into unit - Moved in 1969 or earlier (%) - American Indian and Alaska Native
Year householder moved into unit - Moved in 1969 or earlier (%) - Multirace
Year householder moved into unit - Moved in 1969 or earlier (%) - Other Race
Housing units lacking complete plumbing facilities (%)
Housing units lacking complete kitchen facilities (%)
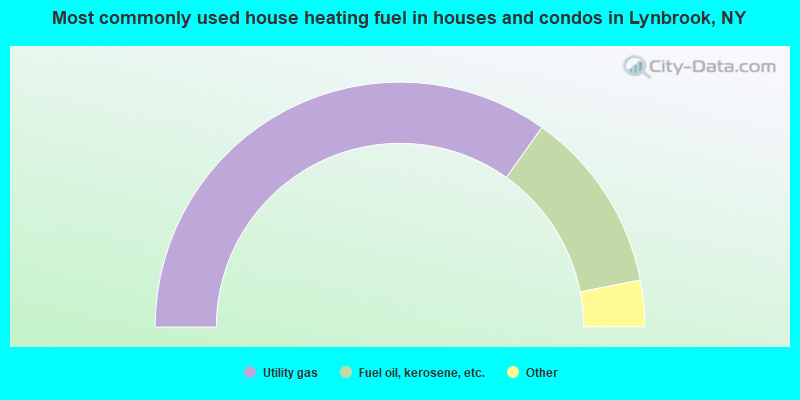
House heating fuel used in houses and condos - Utility gas (%)
House heating fuel used in houses and condos - Bottled, tank, or LP gas (%)
House heating fuel used in houses and condos - Electricity (%)
House heating fuel used in houses and condos - Fuel oil, kerosene, etc. (%)
House heating fuel used in houses and condos - Coal or coke (%)
House heating fuel used in houses and condos - Wood (%)
House heating fuel used in houses and condos - Solar energy (%)
House heating fuel used in houses and condos - Other fuel (%)
House heating fuel used in houses and condos - No fuel used (%)
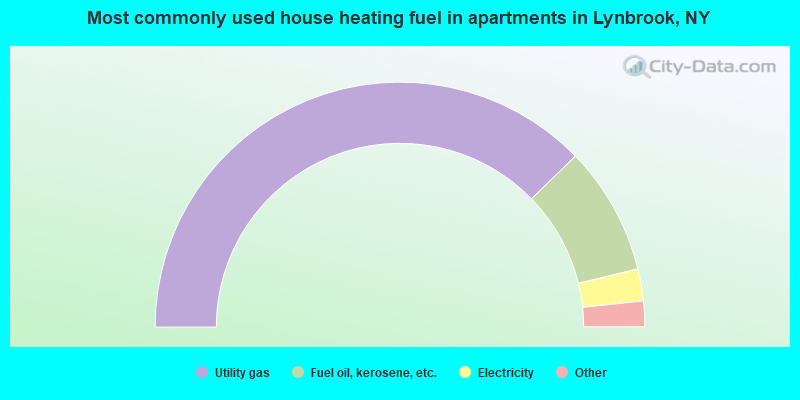
House heating fuel used in apartments - Utility gas (%)
House heating fuel used in apartments - Bottled, tank, or LP gas (%)
House heating fuel used in apartments - Electricity (%)
House heating fuel used in apartments - Fuel oil, kerosene, etc. (%)
House heating fuel used in apartments - Coal or coke (%)
House heating fuel used in apartments - Wood (%)
House heating fuel used in apartments - Solar energy (%)
House heating fuel used in apartments - Other fuel (%)
House heating fuel used in apartments - No fuel used (%)
Latest news about housing in Lynbrook, NY collected exclusively by city-data.com from local newspapers, TV, and radio stations
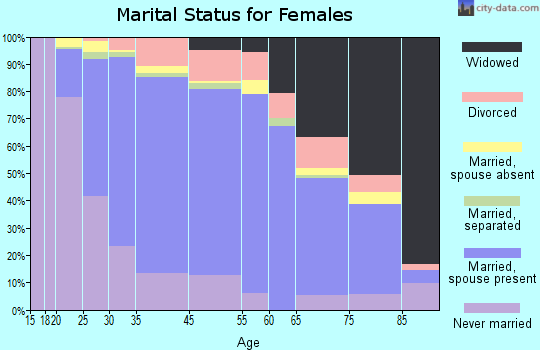
Median year house/condo built: 1938Median year apartment built: 1960Household type by relationship:
Households: 20,219
Male householders: 3,688 (651 living alone ), Female householders: 3,314 (1,008 living alone )4,126 spouses (4,109 opposite-sex spouses ), 244 unmarried partners , (230 opposite-sex unmarried partners ), 6,378 children (6,036 natural , 84 adopted , 257 stepchildren ), 242 grandchildren , 264 brothers or sisters , 716 parents , 0 foster children , 663 other relatives , 502 non-relatives In group quarters: 77
Size of family households: 1,764 2-persons , 1,374 3-persons , 1,076 4-persons , 547 5-persons , 312 6-persons , 83 7-or-more-persons .
Size of nonfamily households: 1,730 1-person , 132 2-persons , 5 3-persons , 17 4-persons .
2,977 married couples with children. single-parent households (92 men , 528 women ).
73.6% of residents of Lynbrook speak English at home. of residents speak Spanish at home (77% speak English very well , 9% speak English well , 10% speak English not well , 4% don't speak English at all ).of residents speak other Indo-European language at home (51% speak English very well , 13% speak English well , 14% speak English not well , 22% don't speak English at all ).of residents speak Asian or Pacific Island language at home (74% speak English very well , 19% speak English well , 7% speak English not well ).of residents speak other language at home (71% speak English very well , 8% speak English well , 21% speak English not well ).
Foreign born population: 3,597 (17.8%)of them are naturalized citizens )
Median number of rooms in houses and condos:
Median number of rooms in apartments
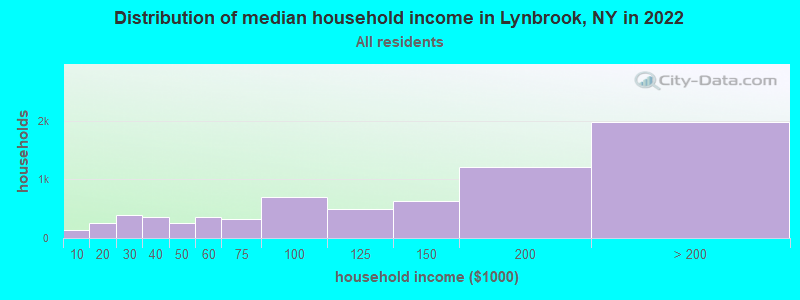
Lynbrook, NY household income distribution 137 Less than $10,000248 $10,000 to $19,999384 $20,000 to $29,999357 $30,000 to $39,999260 $40,000 to $49,999355 $50,000 to $59,999325 $60,000 to $74,999700 $75,000 to $99,999491 $100,000 to $124,999629 $125,000 to $149,9991,203 $150,000 to $199,9991,975 $200,000 or more
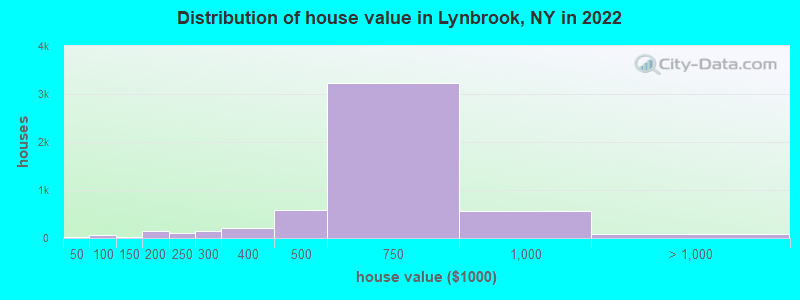
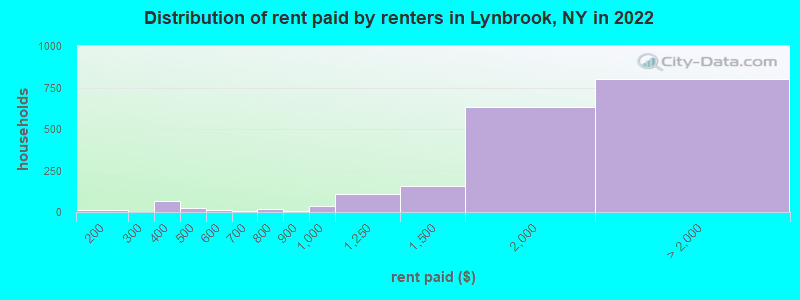
Home value of owner - occupied houses in 2022 in Lynbrook, NY 24 Less than $10,0007 $25,000 to $29,9991 $50,000 to $59,99933 $60,000 to $69,99911 $70,000 to $79,9999 $80,000 to $89,9991 $100,000 to $124,99918 $125,000 to $149,99927 $150,000 to $174,999110 $175,000 to $199,99997 $200,000 to $249,999140 $250,000 to $299,999198 $300,000 to $399,999588 $400,000 to $499,9993,228 $500,000 to $749,999567 $750,000 to $999,99920 $1,000,000 to $1,499,99972 $2,000,000 or moreRent paid by renters in 2022 in Lynbrook, NY 9 $150 to $19913 $300 to $34954 $350 to $39926 $400 to $44915 $550 to $5995 $650 to $69921 $700 to $7498 $800 to $89936 $900 to $999109 $1,000 to $1,249154 $1,250 to $1,499634 $1,500 to $1,999296 $2,000 to $2,499272 $2,500 to $2,999108 $3,500 or more124 No cash rent
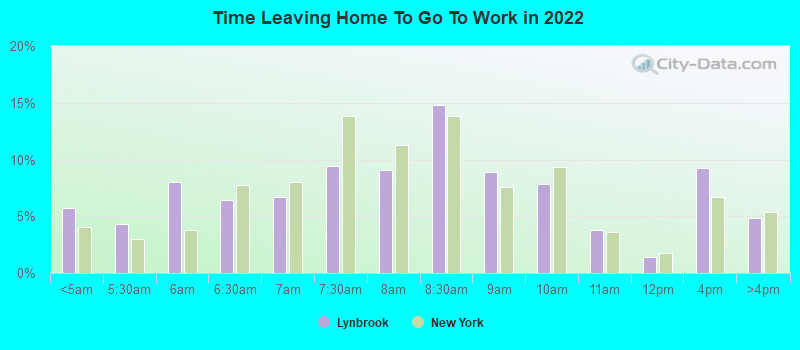
Percentage of workers working in this county: 58.5%Number of people working at home: 1,683 (16.0% of all workers )
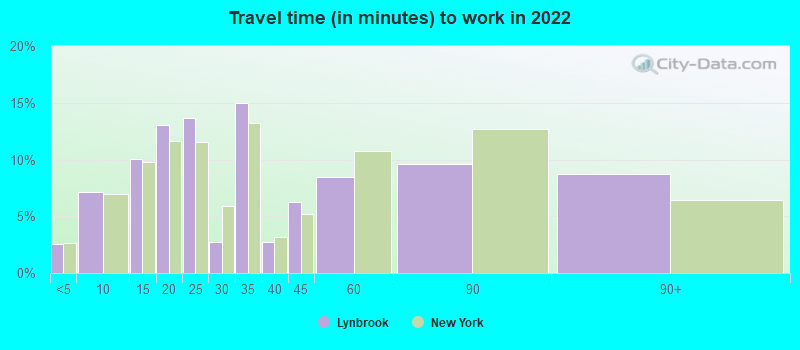
Travel time to work (commute)
Less than 5 minutes: 1015 to 9 minutes: 40310 to 14 minutes: 88115 to 19 minutes: 92620 to 24 minutes: 1,02525 to 29 minutes: 46330 to 34 minutes: 1,09735 to 39 minutes: 20940 to 44 minutes: 20145 to 59 minutes: 1,22060 to 89 minutes: 1,62490 or more minutes: 743
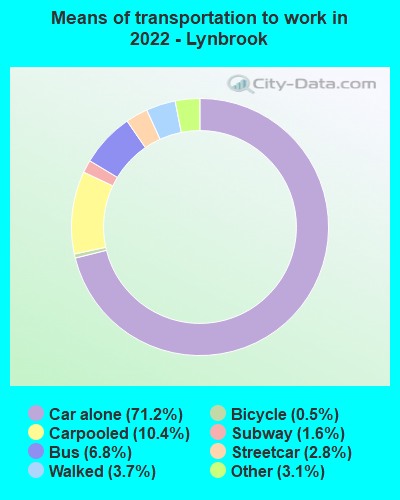
Means of transportation to work:
Drove a car alone: 5,010 (57.5%)Carpooled: 713 (8.2%)Bus : 462 (5.3%)Subway or elevated rail : 171 (2.0%)Long-distance train or commuter rail : 97 (1.1%)Taxi: 317 (3.6%)Bicycle: 52 (0.6%)Walked: 279 (3.2%)Worked at home: 1,683 (19.3%)
Unemployment by race in 2022
Unemployment rate for White non-Hispanic residents 2.4% Males6.5% FemalesUnemployment rate for Black residents 2.0% FemalesUnemployment rate for Asian residents 3.5% MalesUnemployment rate for two or more race residents 8.3% FemalesUnemployment rate for Hispanic or Latino residents 3.1% Females
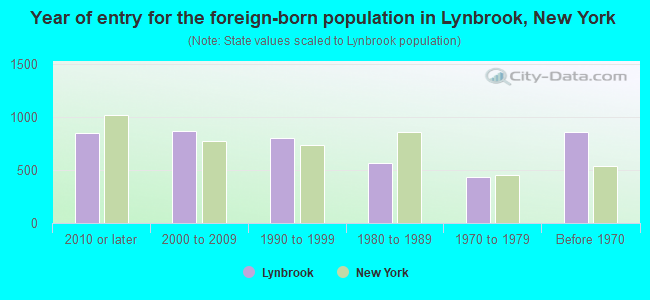
Year of entry for the foreign-born population in Lynbrook, New York
853 2010 or later 871 2000 to 2009 804 1990 to 1999 570 1980 to 1989 431 1970 to 1979 862 Before 1970
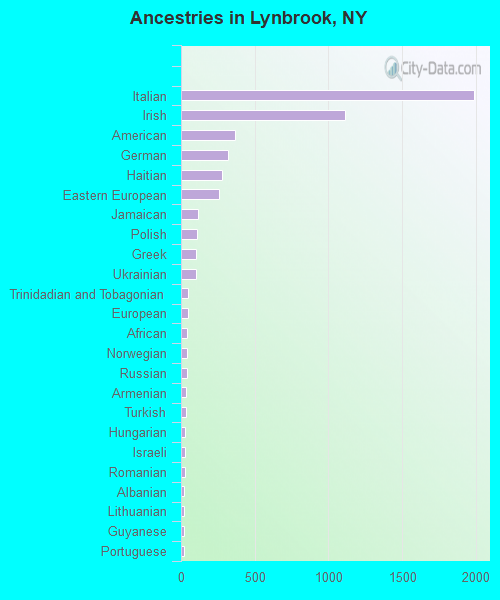
First ancestries reported:
Italian: 1,990 (21.5%)
Irish: 1,112 (12.0%)
American: 364 (3.9%)
German: 316 (3.4%)
Haitian: 277 (3.0%)
Eastern European: 261 (2.8%)
Jamaican: 116 (1.3%)
Polish: 110 (1.2%)
Greek: 103 (1.1%)
Ukrainian: 99 (1.1%)
Trinidadian and Tobagonian: 50 (0.5%)
European: 46 (0.5%)
African: 44 (0.5%)
Norwegian: 39 (0.4%)
Russian: 38 (0.4%)
Armenian: 34 (0.4%)
Turkish: 34 (0.4%)
Hungarian: 29 (0.3%)
Israeli: 28 (0.3%)
Romanian: 26 (0.3%)
Albanian: 21 (0.2%)
Lithuanian: 20 (0.2%)
Guyanese: 19 (0.2%)
Portuguese: 19 (0.2%)
Finnish: 13 (0.1%)
Belizean: 9 (0.10%)
Austrian: 7 (0.08%)
British: 5 (0.05%)
Czech: 5 (0.05%) Most common places of birth for foreign-born residents (%): Pakistan Lynbrook:
17.9% (623)New York:
1.4% (62,442)
Italy Lynbrook:
7.8% (272)New York:
1.8% (81,374)
Peru Lynbrook:
6.5% (227)New York:
1.2% (54,759)
Uruguay Lynbrook:
5.3% (184)New York:
0.1% (5,566)
Chile Lynbrook:
4.9% (171)New York:
0.3% (11,831)
Haiti Lynbrook:
4.8% (166)New York:
2.8% (126,936)
Philippines Lynbrook:
4.7% (162)New York:
2.0% (91,070)
India Lynbrook:
3.1% (107)New York:
3.5% (158,432)
Colombia Lynbrook:
2.9% (100)New York:
2.5% (111,920)
Ireland Lynbrook:
2.8% (99)New York:
0.6% (26,772)
South Africa Lynbrook:
2.8% (98)New York:
0.2% (8,010)
China, excluding Hong Kong and Taiwan Lynbrook:
2.7% (95)New York:
9.1% (410,910)
Trinidad and Tobago Lynbrook:
2.7% (94)New York:
2.0% (91,428)
Ecuador Lynbrook:
2.1% (72)New York:
3.9% (177,448)
Poland Lynbrook:
2.0% (70)New York:
1.4% (65,102)
Honduras Lynbrook:
1.9% (65)New York:
1.2% (55,571)
Jamaica Lynbrook:
1.6% (54)New York:
5.0% (227,557)
Place of birth for U.S.-born residents:
This state: 14,966Other state: 1,046Northeast: 332Midwest: 206South: 285West: 233 89.7% of Lynbrook residents lived in the same house 1 years ago.
Out of people who lived in different houses, 22.2% lived in this county.
Out of people who lived in different counties, 87.4% lived in New York.
Lynbrook:
89.7%State average:
89.6%
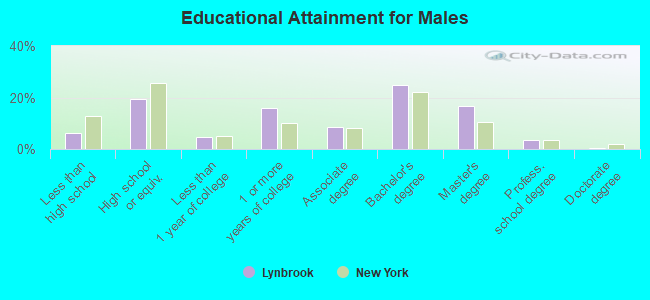
Education attainment for males 25 years and older:
No schooling: 75Nursery to 4th grade: 1355th and 6th grade: 597th and 8th grade: 319th grade: 1610th grade: 2511th grade: 1712th grade, no diploma: 75High school graduate (or equivalency): 1,344Less than 1 year of college: 310Some college more than 1 year, no degree: 1,086Associate degree: 601Bachelor's degree: 1,727Master's degree: 1,150Professional school degree: 234Doctorate degree: 17
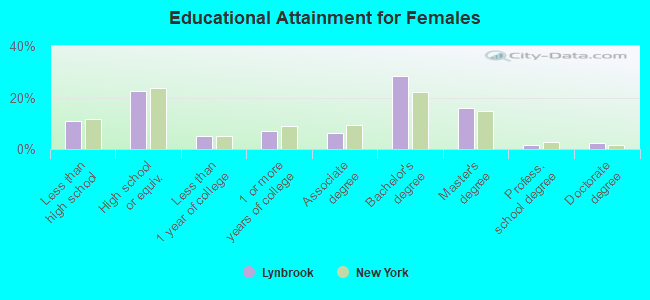
Education attainment for females 25 years and older:
No schooling: 343Nursery to 4th grade: 305th and 6th grade: 337th and 8th grade: 489th grade: 010th grade: 011th grade: 12512th grade, no diploma: 294High school graduate (or equivalency): 1,786Less than 1 year of college: 388Some college more than 1 year, no degree: 543Associate degree: 485Bachelor's degree: 2,259Master's degree: 1,276Professional school degree: 138Doctorate degree: 174
Housing units in structures:
One, detached: 4,267One, attached: 192Two: 1,6253 or 4: 995 to 9: 8010 to 19: 11420 to 49: 20950 or more: 848Mobile homes: 21Housing units lacking complete plumbing facilities in 2022: 0.4%Housing units lacking complete kitchen facilities in 2022: 5.1%House/condo owner moved in on average 14 years ago
Renter moved in on average 3 years ago
Private vs. public school enrollment:
Students in private schools in grades 1 to 8 (elementary and middle school): 82 Students in private schools in grades 9 to 12 (high school): 211 Students in private undergraduate colleges: 172