Lynchburg, SC (South Carolina) Houses and Residents
| Lynchburg: | $103,041 |
| South Carolina: | $254,600 |
Mean price in 2022:
Detached houses: $157,281
Here: $157,281 State: $368,255 Mobile homes: $57,802
Here: $57,802 State: $102,531
Total population: 358 (Urban population: 0, Rural population: 562 (21 farm, 541 nonfarm))
Houses: 150 (98 occupied: 63 owner occupied, 36 renter occupied)
| % of renters here: | 36% |
| State: | 28% |
Housing density: 133 houses/condos per square mile
Median price asked for vacant for-sale houses and condos in 2022 in this county: $74,356.
Median contract rent in 2022: $393 (lower quartile is $164, upper quartile is $488)
Median rent asked for vacant for-rent units in 2022: $363
Median gross rent in Lynchburg, SC in 2022: $577
Housing units in Lynchburg with a mortgage: 3 (0 second mortgage, 0 home equity loan, 0 both second mortgage and home equity loan)
Houses without a mortgage: 0
Median household income for apartments without a mortgage: $26,308
Median monthly housing costs: $388
Compare current foreclosures near Lynchburg, SC:
| Photo | Address | Area | Beds / Baths | Price | Details |
|---|---|---|---|---|---|

|
#1
Mt Sinai Church Rd
Lynchburg, SC 29080
|
- sq. feet
|
- baths 3 beds |
show details | |

|
#2
Hwy 301
Gable, SC 29051
|
1,348 sq. feet
|
1 baths 3 beds |
$200,000
|
show details |

|
#3
Red Top Rd
Lynchburg, SC 29080
|
- sq. feet
|
- baths - beds |
show details | |

|
#4
Red Top Rd
Lynchburg, SC 29080
|
- sq. feet
|
- baths - beds |
show details | |

|
#5
Nero Cir
Lynchburg, SC 29080
|
- sq. feet
|
- baths - beds |
show details | |

|
#6
Tram Rd
Lynchburg, SC 29080
|
- sq. feet
|
- baths - beds |
show details | |

|
#7
Narrow Paved Rd
Lynchburg, SC 29080
|
- sq. feet
|
- baths - beds |
show details | |

|
#8
Wanda Cv
Florence, SC 29501
|
2,478 sq. feet
|
2 baths 3 beds |
show details | |

|
#9
Banbury Cir
Florence, SC 29501
|
2,602 sq. feet
|
2 baths 4 beds |
show details | |

|
#10
Chalmers Row
Florence, SC 29501
|
1,979 sq. feet
|
3 baths 4 beds |
show details |
| Photo | Address | Area | Beds / Baths | Price | Details |
|---|---|---|---|---|---|

|
#11
Pheasant Rd
Effingham, SC 29541
|
1,767 sq. feet
|
3 baths 3 beds |
show details | |

|
#12
Petal Path
Effingham, SC 29541
|
1,281 sq. feet
|
2 baths 3 beds |
show details | |

|
#13
Trotwood Dr
Florence, SC 29501
|
2,046 sq. feet
|
2 baths 3 beds |
show details | |

|
#14
Rucker Dr
Timmonsville, SC 29161
|
1,708 sq. feet
|
2 baths 3 beds |
show details | |

|
#15
Wisdom Ln
Effingham, SC 29541
|
1,831 sq. feet
|
2 baths 3 beds |
show details | |

|
#16
Lakeshore Dr
Florence, SC 29501
|
3,592 sq. feet
|
3 baths 4 beds |
show details | |

|
#17
Tillers Plow Row
Effingham, SC 29541
|
1,432 sq. feet
|
2 baths 3 beds |
show details | |

|
#18
Trotwood Dr
Florence, SC 29501
|
1,814 sq. feet
|
2 baths 3 beds |
show details | |

|
#19
Prince Alston Cv
Florence, SC 29501
|
2,814 sq. feet
|
3 baths 4 beds |
show details | |

|
#20
Kristens Channel
Florence, SC 29501
|
4,415 sq. feet
|
4 baths 4 beds |
show details |
| Photo | Address | Area | Beds / Baths | Price | Details |
|---|---|---|---|---|---|

|
#21
Farm Quarter Rd
Florence, SC 29501
|
1,670 sq. feet
|
2 baths 3 beds |
show details | |

|
#22
Bingham Ave
Olanta, SC 29114
|
3,056 sq. feet
|
3 baths 4 beds |
show details | |

|
#23
W Pelican Ln
Florence, SC 29501
|
2,028 sq. feet
|
2 baths 3 beds |
show details | |

|
#24
Deschamps Dr
Florence, SC 29501
|
1,404 sq. feet
|
2 baths 3 beds |
show details | |

|
#25
Darlington St
Timmonsville, SC 29161
|
1,271 sq. feet
|
1 baths 3 beds |
show details | |

|
#26
Left Bank Dr
Florence, SC 29501
|
2,224 sq. feet
|
2 baths 3 beds |
show details | |

|
#27
Dominion Ct
Florence, SC 29501
|
1,533 sq. feet
|
2 baths 3 beds |
show details | |

|
#28
N Brockington St
Timmonsville, SC 29161
|
915 sq. feet
|
1 baths 3 beds |
show details | |

|
#29
Corbett Pl
Florence, SC 29501
|
1,500 sq. feet
|
2 baths 3 beds |
show details | |

|
#30
Brock Cir
Florence, SC 29501
|
2,300 sq. feet
|
2 baths 3 beds |
show details |
| Photo | Address | Area | Beds / Baths | Price | Details |
|---|---|---|---|---|---|

|
#31
Lamar Hwy
Timmonsville, SC 29161
|
1,025 sq. feet
|
1 baths 3 beds |
show details | |

|
#32
Stratton Dr
Florence, SC 29501
|
2,269 sq. feet
|
2 baths 3 beds |
show details | |

|
#33
Cove Pointe Dr
Florence, SC 29501
|
2,100 sq. feet
|
2 baths 3 beds |
show details | |

|
#34
S Cartersville Hwy
Timmonsville, SC 29161
|
1,827 sq. feet
|
2 baths 3 beds |
show details | |

|
#35
Parkland Dr
Florence, SC 29501
|
1,718 sq. feet
|
2 baths 3 beds |
show details | |

|
#36
E Twin Church Rd
Timmonsville, SC 29161
|
1,891 sq. feet
|
2 baths 3 beds |
show details | |

|
#37
Player St
Timmonsville, SC 29161
|
1,240 sq. feet
|
1 baths 2 beds |
show details | |

|
#38
Laufer Dr
Florence, SC 29501
|
1,363 sq. feet
|
2 baths 3 beds |
show details | |

|
#39
N Warren St
Timmonsville, SC 29161
|
1,296 sq. feet
|
1 baths 4 beds |
show details | |

|
#40
Quail Pointe Dr
Florence, SC 29501
|
1,815 sq. feet
|
2 baths 3 beds |
show details |
| Photo | Address | Area | Beds / Baths | Price | Details |
|---|---|---|---|---|---|

|
#41
Johnson Rd
Timmonsville, SC 29161
|
- sq. feet
|
2 baths 4 beds |
show details | |

|
#42
Legion Rd
Olanta, SC 29114
|
2,432 sq. feet
|
- baths - beds |
show details | |

|
#43
Pratt Ave
Sumter, SC 29153
|
- sq. feet
|
- baths - beds |
show details | |

|
#44
W Council St
Bishopville, SC 29010
|
- sq. feet
|
- baths - beds |
show details | |

|
#45
Dominion Ct
Florence, SC 29501
|
- sq. feet
|
- baths - beds |
show details | |

|
#46
Sneed Rd Apt D
Florence, SC 29501
|
- sq. feet
|
- baths - beds |
show details | |

|
#47
W Old Number 4 Hwy
Scranton, SC 29591
|
- sq. feet
|
- baths - beds |
show details | |

|
#48
N Main St
Sumter, SC 29153
|
- sq. feet
|
- baths 4 beds |
show details | |

|
#49
Alligator Rd
Effingham, SC 29541
|
- sq. feet
|
- baths - beds |
show details | |

|
Check over 1 million property listings on Foreclosure.com!
|
browse all offers | |||

Latest news about housing in Lynchburg, SC collected exclusively by city-data.com from local newspapers, TV, and radio stations

 | Specific area to focus on time limited home search Spartanburg (23 replies) |
| Possible move to upstate SC from Virginia, family friendly towns? (14 replies) |
| MiLB dominoes start to drop, which league will the Fireflies end up in? (40 replies) |
| :::Southern Appreciation Thread (56 replies) |
| USC-Campus/Area (5 replies) |
| Frequency of mandatory evacuations on Hilton Head Island (52 replies) |

Median year apartment built: 1987
Household type by relationship:
Households: 253- Male householders: 26 (9 living alone), Female householders: 70 (23 living alone)
28 spouses (28 opposite-sex spouses), 0 unmarried partners, (0 opposite-sex unmarried partners), 51 children (51 natural, 0 adopted, 0 stepchildren), 21 grandchildren, 26 brothers or sisters, 8 parents, 0 foster children, 17 other relatives, 2 non-relatives
Size of family households: 44 2-persons, 12 4-persons, 8 5-persons.
Size of nonfamily households: 33 1-person, 2 2-persons.
16 married couples with children.
0 single-parent households (0 men, 0 women).
98.0% of residents of Lynchburg speak English at home.
0.8% of residents speak Spanish at home (100% speak English very well).
1.2% of residents speak Asian or Pacific Island language at home (67% speak English very well, 33% speak English well).
Foreign born population: 4 (1.6%)
(0.0% of them are naturalized citizens)
| Here: | 6.3 |
| State: | 6.4 |
| Here: | 4.2 |
| State: | 4.5 |

- Bedrooms in owner-occupied houses and condos in Lynchburg, South Carolina
- 0no bedroom
- 01 bedroom
- 162 bedrooms
- 413 bedrooms
- 54 bedrooms
- 15+ bedrooms

- Bedrooms in renter-occupied apartments in Lynchburg, South Carolina
- 0no bedroom
- 61 bedroom
- 262 bedrooms
- 43 bedrooms
- 04 bedrooms
- 05+ bedrooms

- Cars and other vehicles available in Lynchburg in owner-occupied houses/condos
- 2no vehicle
- 201 vehicle
- 342 vehicles
- 73 vehicles
- 04 vehicles
- 05+ vehicles

- Cars and other vehicles available in Lynchburg in renter-occupied apartments
- 16no vehicle
- 191 vehicle
- 22 vehicles
- 03 vehicles
- 04 vehicles
- 05+ vehicles

- Rooms in owner-occupied houses in Lynchburg, South Carolina
- 01 room
- 02 rooms
- 03 rooms
- 04 rooms
- 125 rooms
- 256 rooms
- 27 rooms
- 148 rooms
- 119+ rooms

- Rooms in renter-occupied apartments in Lynchburg, South Carolina
- 01 room
- 02 rooms
- 53 rooms
- 194 rooms
- 105 rooms
- 26 rooms
- 07 rooms
- 18 rooms
- 09+ rooms


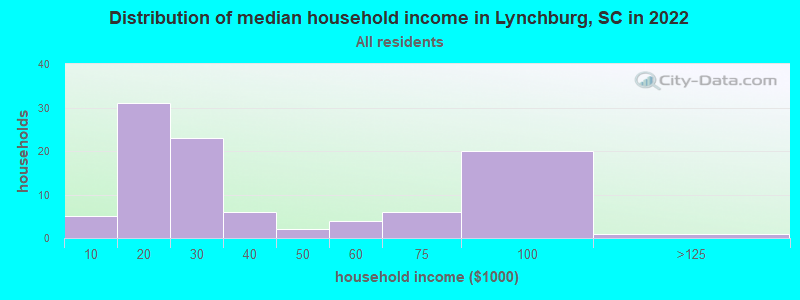
Lynchburg, SC household income distribution

- 5Less than $10,000
- 31$10,000 to $19,999
- 23$20,000 to $29,999
- 6$30,000 to $39,999
- 2$40,000 to $49,999
- 4$50,000 to $59,999
- 6$60,000 to $74,999
- 20$75,000 to $99,999
- 1$100,000 to $124,999
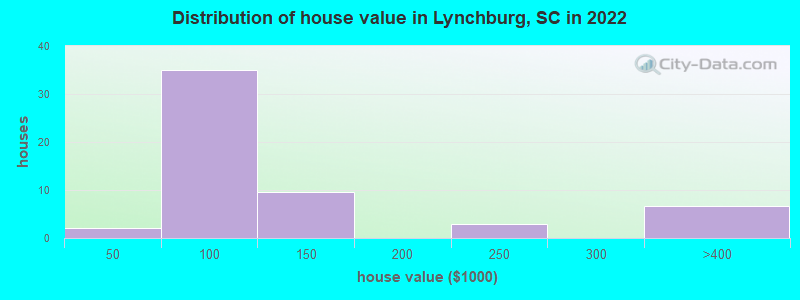
Home value of owner - occupied houses in 2022 in Lynchburg, SC
-
- 1Less than $10,000
- 0$20,000 to $24,999
- 6$60,000 to $69,999
- 17$70,000 to $79,999
- 5$80,000 to $89,999
- 4$90,000 to $99,999
- 6$100,000 to $124,999
- 3$125,000 to $149,999
- 2$200,000 to $249,999
- 6$300,000 to $399,999
Rent paid by renters in 2022 in Lynchburg, SC
-
- 0Less than $100
- 6$100 to $149
- 4$150 to $199
- 2$200 to $249
- 0$300 to $349
- 6$400 to $449
- 6$450 to $499
- 1$800 to $899
- 4No cash rent


Percentage of workers working in this county: 38.5%
Number of people working at home: 0 (0.0% of all workers)
Travel time to work (commute)
- Less than 5 minutes: 0
- 5 to 9 minutes: 0
- 10 to 14 minutes: 0
- 15 to 19 minutes: 1
- 20 to 24 minutes: 6
- 25 to 29 minutes: 2
- 30 to 34 minutes: 13
- 35 to 39 minutes: 0
- 40 to 44 minutes: 6
- 45 to 59 minutes: 5
- 60 to 89 minutes: 1
- 90 or more minutes: 2
Means of transportation to work:
- Drove a car alone: 134 (48.0%)
- Carpooled: 135 (48.4%)
- Bus or trolley bus: 1 (0.4%)
- Walked: 6 (2.2%)
- Other means: 1 (0.4%)
- Worked at home: 2 (0.7%)

- Unemployment by race in 2022
- Unemployment rate for Black residents
- 49.2%Males
- 26.7%Females

- Year of entry for the foreign-born population in Lynchburg, South Carolina
- 42010 or later
- 02000 to 2009
- 01990 to 1999
- 01980 to 1989
- 01970 to 1979
- 2Before 1970

First ancestries reported:
- Dutch: 4 (1.9%)
- Irish: 4 (1.9%)
Most common places of birth for foreign-born residents (%):
| Lynchburg: | 75.0% (3) |
| South Carolina: | 4.1% (11,031) |
Place of birth for U.S.-born residents:
- This state: 209
- Other state: 35
- Northeast: 11
- Midwest: 0
- South: 22
- West: 0
94.1% of Lynchburg residents lived in the same house 1 years ago.
Out of people who lived in different houses, 0.0% lived in this county.
Out of people who lived in different counties, 100.0% lived in South Carolina.
| Lynchburg: | 94.1% |
| State average: | 86.5% |
Education attainment for males 25 years and older:
- No schooling: 0
- Nursery to 4th grade: 0
- 5th and 6th grade: 0
- 7th and 8th grade: 0
- 9th grade: 0
- 10th grade: 0
- 11th grade: 3
- 12th grade, no diploma: 6
- High school graduate (or equivalency): 73
- Less than 1 year of college: 3
- Some college more than 1 year, no degree: 2
- Associate degree: 2
- Bachelor's degree: 0
- Master's degree: 0
- Professional school degree: 0
- Doctorate degree: 0

Education attainment for females 25 years and older:
- No schooling: 0
- Nursery to 4th grade: 12
- 5th and 6th grade: 0
- 7th and 8th grade: 0
- 9th grade: 2
- 10th grade: 0
- 11th grade: 0
- 12th grade, no diploma: 3
- High school graduate (or equivalency): 34
- Less than 1 year of college: 15
- Some college more than 1 year, no degree: 26
- Associate degree: 1
- Bachelor's degree: 3
- Master's degree: 10
- Professional school degree: 0
- Doctorate degree: 2


Housing units in structures:
- One, detached: 98
- Two: 14
- 5 to 9: 4
- 10 to 19: 2
- Mobile homes: 31
Median worth of mobile homes: $69,928
Housing units lacking complete kitchen facilities in 2022: 8.3%
House/condo owner moved in on average 31 years ago
Renter moved in on average 7 years ago

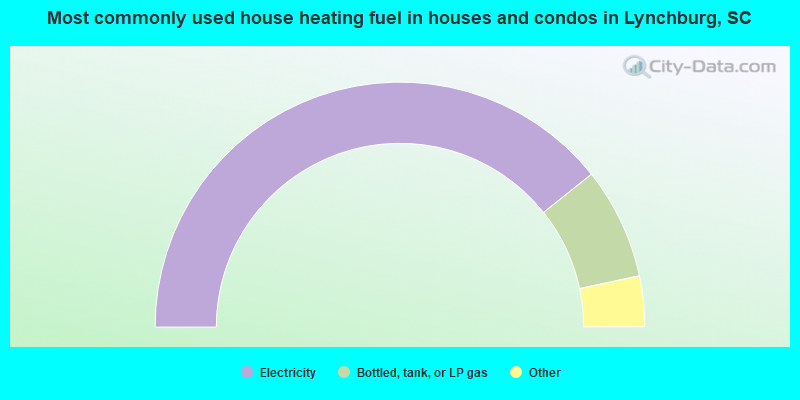
- 80.0%Electricity
- 15.0%Bottled, tank, or LP gas
- 3.3%Utility gas
- 1.7%Fuel oil, kerosene, etc.
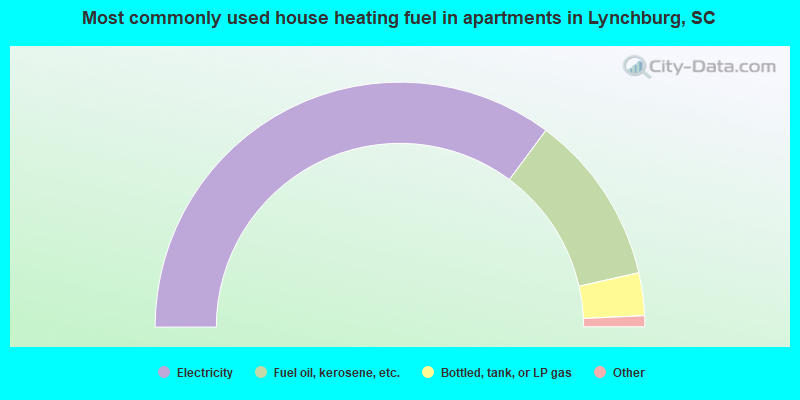
- 71.4%Electricity
- 22.9%Fuel oil, kerosene, etc.
- 5.7%Bottled, tank, or LP gas
Private vs. public school enrollment:
| Here: | 0.0% |
| South Carolina: | 14.4% |
| Here: | 0.0% |
| South Carolina: | 11.1% |
| Here: | 0.0% |
| South Carolina: | 21.9% |


