Lynchburg, TN (Tennessee) Houses and Residents
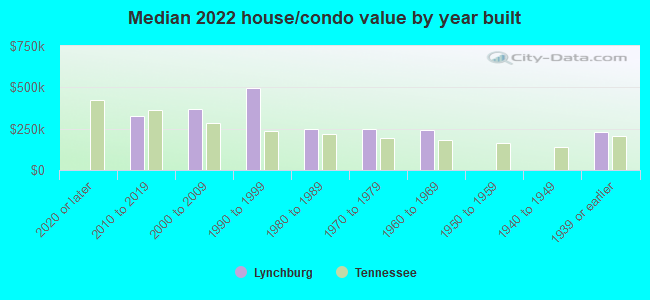
| Lynchburg: | $314,986 |
| Tennessee: | $284,800 |
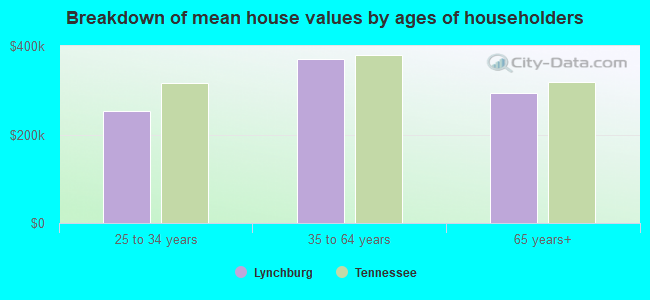
Mean price in 2022:
Detached houses: $318,808
Here: $318,808 State: $374,382 Mobile homes: $102,637
Here: $102,637 State: $101,421
Total population: 6,313 (Urban population: 0, Rural population: 5,740 (629 farm, 5,111 nonfarm))
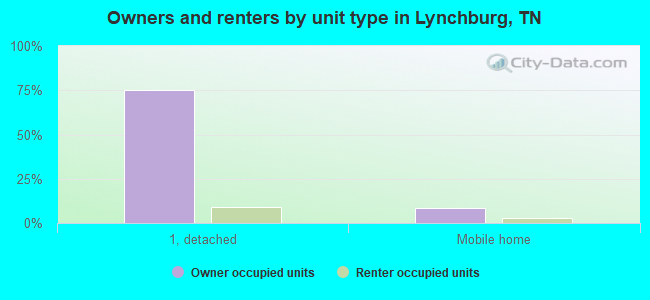
Houses: 3,072 (2,636 occupied: 2,264 owner occupied, 418 renter occupied)
| % of renters here: | 16% |
| State: | 33% |
Housing density: 24 houses/condos per square mile
Median price asked for vacant for-sale houses and condos in 2022: $119,069.
Median contract rent in 2022: $578 (lower quartile is $379, upper quartile is $687)
Median rent asked for vacant for-rent units in 2022: $294
Median gross rent in Lynchburg, TN in 2022: $804
Housing units in Lynchburg with a mortgage: 1,200 (68 second mortgage, 0 home equity loan, 69 both second mortgage and home equity loan)
Houses without a mortgage: 51
Median household income for houses/condos with a mortgage: $88,746
Median household income for apartments without a mortgage: $64,689
Median monthly housing costs: $840


Latest news about housing in Lynchburg, TN collected exclusively by city-data.com from local newspapers, TV, and radio stations

 | 11 Most Picturesque Towns in Tennessee (23 replies) |
| Time to move,considering NE Tenn (55 replies) |
| Algood Liquor Vote (30 replies) |
| Hi relocating to possibly Liberty Tennessee, McEwen area or Lynchburg. (16 replies) |
| So much rain (14 replies) |
| Road trip from N.CA thru Nashville.. (9 replies) |

Median year apartment built: 1981
Household type by relationship:
Households: 6,678- Male householders: 1,309 (321 living alone), Female householders: 1,295 (341 living alone)
1,564 spouses (1,554 opposite-sex spouses), 87 unmarried partners, (87 opposite-sex unmarried partners), 1,561 children (1,410 natural, 38 adopted, 112 stepchildren), 121 grandchildren, 0 brothers or sisters, 86 parents, 0 foster children, 325 other relatives, 230 non-relatives
- In group quarters: 96
Size of family households: 973 2-persons, 427 3-persons, 346 4-persons, 49 5-persons, 69 6-persons, 30 7-or-more-persons.
Size of nonfamily households: 674 1-person, 85 2-persons, 20 3-persons.
850 married couples with children.
180 single-parent households (52 men, 128 women).
98.7% of residents of Lynchburg speak English at home.
0.5% of residents speak Spanish at home (82% speak English very well, 6% speak English well, 12% speak English not well).
0.5% of residents speak other Indo-European language at home (100% speak English very well).
0.3% of residents speak Asian or Pacific Island language at home (100% speak English very well).
Foreign born population: 173 (2.6%)
(91.9% of them are naturalized citizens)
| Here: | 6.6 |
| State: | 6.5 |
| Here: | 5.4 |
| State: | 4.4 |
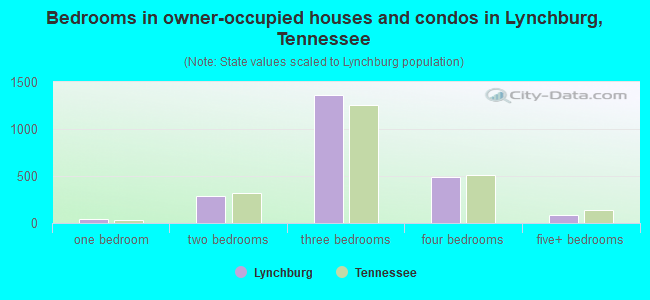
- Bedrooms in owner-occupied houses and condos in Lynchburg, Tennessee
- 0no bedroom
- 391 bedroom
- 2912 bedrooms
- 1,3673 bedrooms
- 4864 bedrooms
- 835+ bedrooms
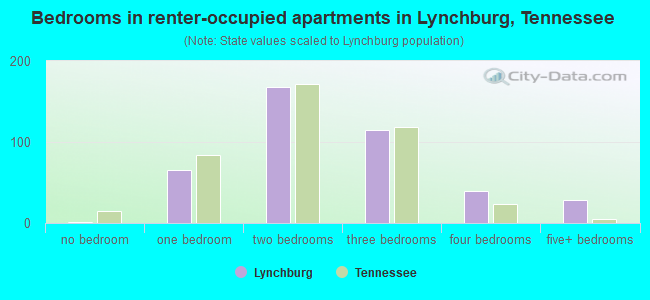
- Bedrooms in renter-occupied apartments in Lynchburg, Tennessee
- 1no bedroom
- 661 bedroom
- 1682 bedrooms
- 1153 bedrooms
- 404 bedrooms
- 285+ bedrooms
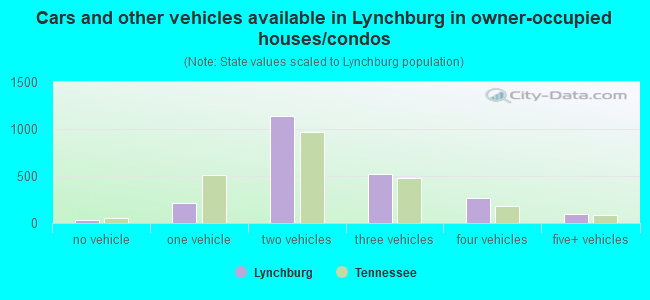
- Cars and other vehicles available in Lynchburg in owner-occupied houses/condos
- 35no vehicle
- 2171 vehicle
- 1,1382 vehicles
- 5213 vehicles
- 2624 vehicles
- 915+ vehicles
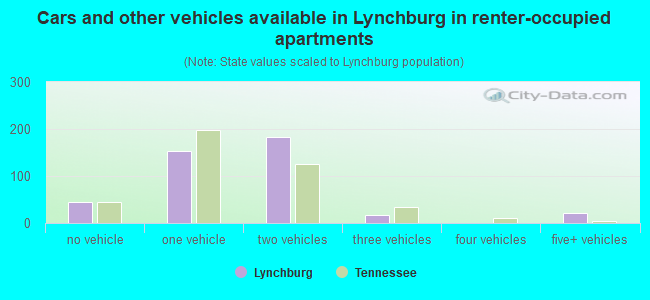
- Cars and other vehicles available in Lynchburg in renter-occupied apartments
- 44no vehicle
- 1531 vehicle
- 1842 vehicles
- 173 vehicles
- 04 vehicles
- 215+ vehicles
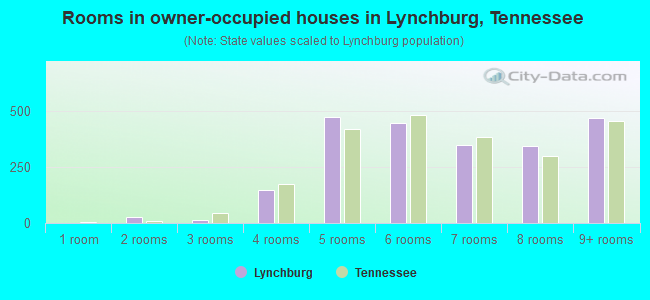
- Rooms in owner-occupied houses in Lynchburg, Tennessee
- 01 room
- 272 rooms
- 153 rooms
- 1494 rooms
- 4715 rooms
- 4476 rooms
- 3477 rooms
- 3428 rooms
- 4679+ rooms
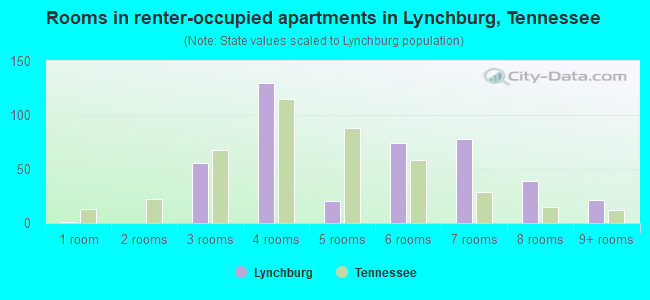
- Rooms in renter-occupied apartments in Lynchburg, Tennessee
- 11 room
- 02 rooms
- 563 rooms
- 1304 rooms
- 205 rooms
- 746 rooms
- 787 rooms
- 398 rooms
- 219+ rooms
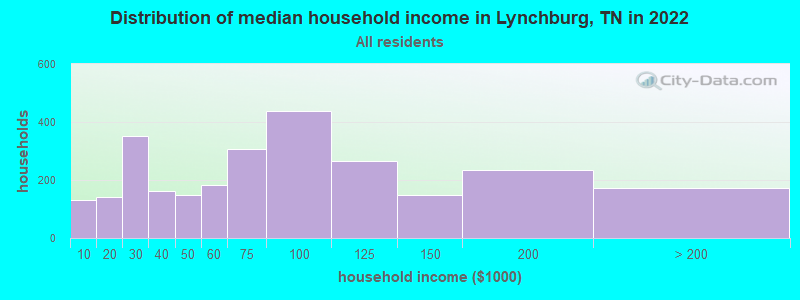
Lynchburg, TN household income distribution

- 131Less than $10,000
- 141$10,000 to $19,999
- 352$20,000 to $29,999
- 163$30,000 to $39,999
- 147$40,000 to $49,999
- 183$50,000 to $59,999
- 308$60,000 to $74,999
- 437$75,000 to $99,999
- 267$100,000 to $124,999
- 147$125,000 to $149,999
- 235$150,000 to $199,999
- 173$200,000 or more
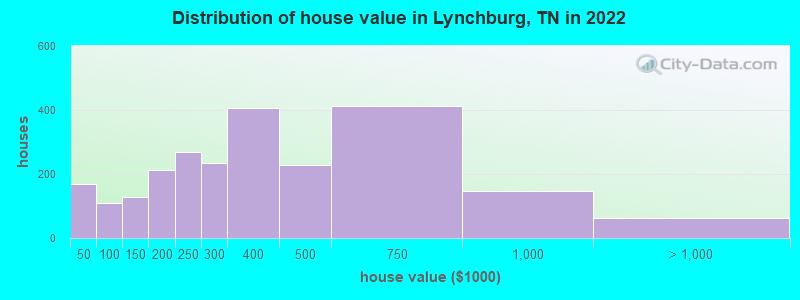
Home value of owner - occupied houses in 2022 in Lynchburg, TN
-
- 47Less than $10,000
- 24$10,000 to $14,999
- 60$15,000 to $19,999
- 11$20,000 to $24,999
- 14$25,000 to $29,999
- 5$30,000 to $34,999
- 6$40,000 to $49,999
- 43$50,000 to $59,999
- 8$60,000 to $69,999
- 26$70,000 to $79,999
- 3$80,000 to $89,999
- 17$90,000 to $99,999
- 70$100,000 to $124,999
- 57$125,000 to $149,999
- 89$150,000 to $174,999
- 124$175,000 to $199,999
- 270$200,000 to $249,999
- 234$250,000 to $299,999
- 405$300,000 to $399,999
- 227$400,000 to $499,999
- 413$500,000 to $749,999
- 147$750,000 to $999,999
- 62$1,000,000 to $1,499,999
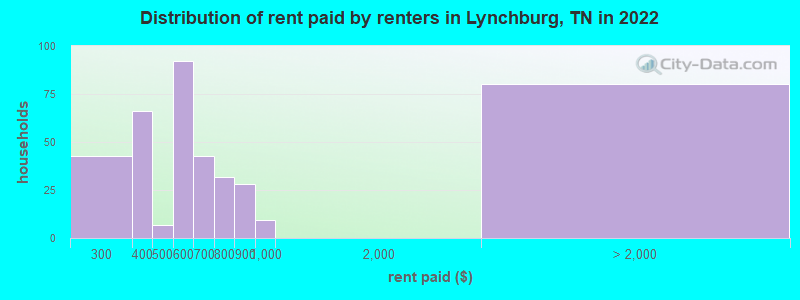
Rent paid by renters in 2022 in Lynchburg, TN
-
- 34$200 to $249
- 8$250 to $299
- 38$300 to $349
- 27$350 to $399
- 6$450 to $499
- 68$500 to $549
- 24$550 to $599
- 42$600 to $649
- 31$700 to $749
- 28$800 to $899
- 9$900 to $999
- 80No cash rent
Percentage of workers working in this county: 39.9%
Number of people working at home: 218 (7.3% of all workers)
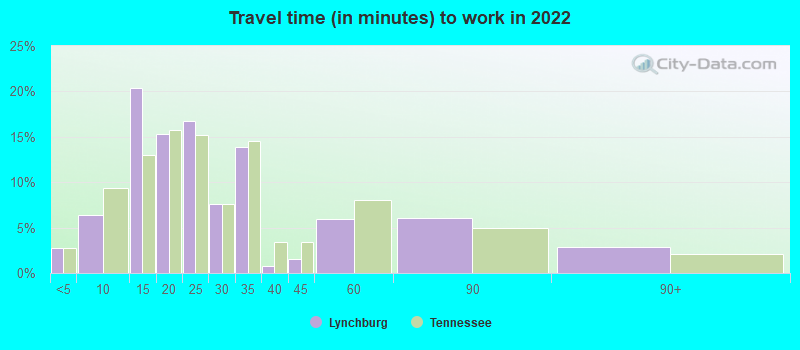
Travel time to work (commute)
- Less than 5 minutes: 61
- 5 to 9 minutes: 124
- 10 to 14 minutes: 538
- 15 to 19 minutes: 415
- 20 to 24 minutes: 430
- 25 to 29 minutes: 152
- 30 to 34 minutes: 603
- 35 to 39 minutes: 66
- 40 to 44 minutes: 87
- 45 to 59 minutes: 85
- 60 to 89 minutes: 81
- 90 or more minutes: 82
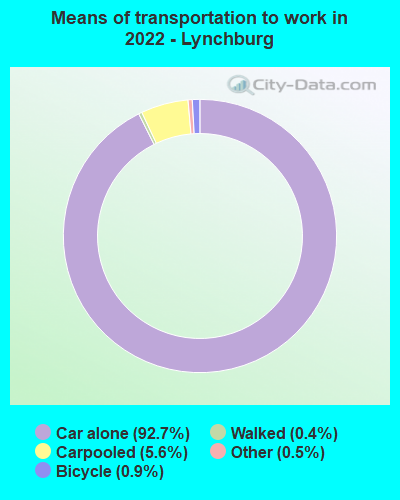
Means of transportation to work:
- Drove a car alone: 2,039 (82.6%)
- Carpooled: 130 (5.3%)
- Taxi: 12 (0.5%)
- Bicycle: 21 (0.9%)
- Walked: 8 (0.3%)
- Worked at home: 218 (8.8%)
- Unemployment by race in 2022
- Unemployment rate for White non-Hispanic residents
- 3.2%Males
- 2.4%Females
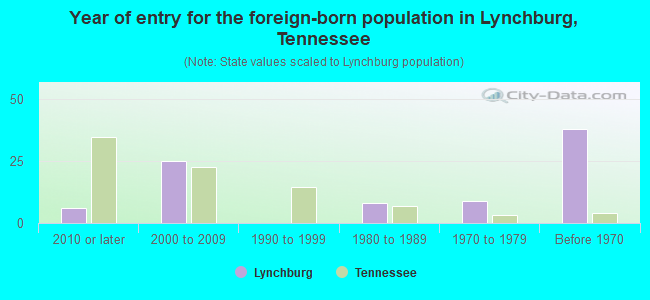
- Year of entry for the foreign-born population in Lynchburg, Tennessee
- 62010 or later
- 252000 to 2009
- 01990 to 1999
- 81980 to 1989
- 91970 to 1979
- 38Before 1970
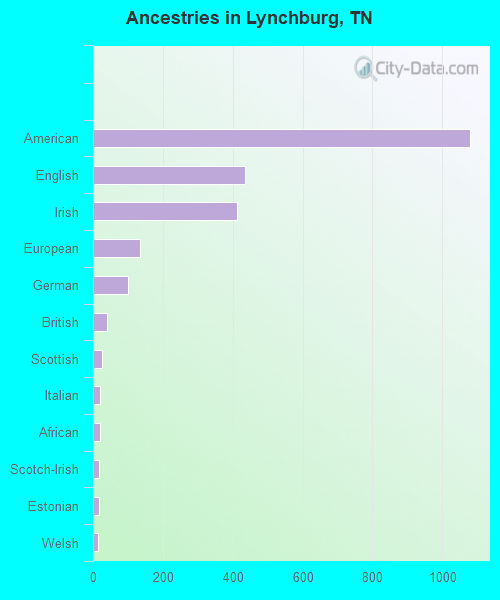
First ancestries reported:
- American: 1,080 (37.4%)
- English: 434 (15.0%)
- Irish: 412 (14.3%)
- European: 135 (4.7%)
- German: 100 (3.5%)
- British: 41 (1.4%)
- Scottish: 27 (0.9%)
- Italian: 21 (0.7%)
- African: 19 (0.7%)
- Scotch-Irish: 18 (0.6%)
- Estonian: 16 (0.6%)
- Welsh: 13 (0.5%)
- Swiss: 7 (0.2%)
- Polish: 5 (0.2%)
Most common places of birth for foreign-born residents (%):
| Lynchburg: | 34.1% (59) |
| Tennessee: | 3.1% (11,640) |
| Lynchburg: | 26.0% (45) |
| Tennessee: | 1.2% (4,587) |
| Lynchburg: | 18.5% (32) |
| Tennessee: | 2.2% (8,261) |
| Lynchburg: | 10.4% (18) |
| Tennessee: | 23.0% (86,435) |
| Lynchburg: | 6.4% (11) |
| Tennessee: | 5.7% (21,286) |
| Lynchburg: | 4.0% (7) |
| Tennessee: | 0.3% (1,173) |
Place of birth for U.S.-born residents:
- This state: 4,726
- Other state: 1,713
- Northeast: 196
- Midwest: 483
- South: 800
- West: 234
94.7% of Lynchburg residents lived in the same house 1 years ago.
Out of people who lived in different houses, 22.9% lived in this county.
Out of people who lived in different counties, 57.4% lived in Tennessee.
| Lynchburg: | 94.7% |
| State average: | 87.0% |
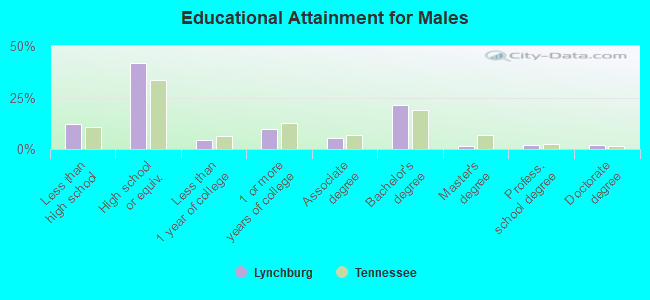
Education attainment for males 25 years and older:
- No schooling: 24
- Nursery to 4th grade: 2
- 5th and 6th grade: 29
- 7th and 8th grade: 55
- 9th grade: 12
- 10th grade: 69
- 11th grade: 56
- 12th grade, no diploma: 44
- High school graduate (or equivalency): 991
- Less than 1 year of college: 99
- Some college more than 1 year, no degree: 228
- Associate degree: 123
- Bachelor's degree: 506
- Master's degree: 33
- Professional school degree: 51
- Doctorate degree: 45
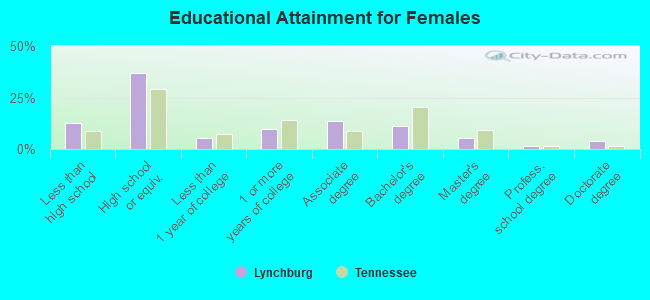
Education attainment for females 25 years and older:
- No schooling: 9
- Nursery to 4th grade: 9
- 5th and 6th grade: 76
- 7th and 8th grade: 40
- 9th grade: 42
- 10th grade: 32
- 11th grade: 50
- 12th grade, no diploma: 50
- High school graduate (or equivalency): 915
- Less than 1 year of college: 137
- Some college more than 1 year, no degree: 236
- Associate degree: 332
- Bachelor's degree: 279
- Master's degree: 134
- Professional school degree: 41
- Doctorate degree: 95


Housing units in structures:
- One, detached: 2,647
- One, attached: 7
- Two: 7
- 5 to 9: 72
- 20 to 49: 10
- Mobile homes: 316
- Boats, RVs, vans, etc.: 11
Housing units lacking complete kitchen facilities in 2022: 5.6%
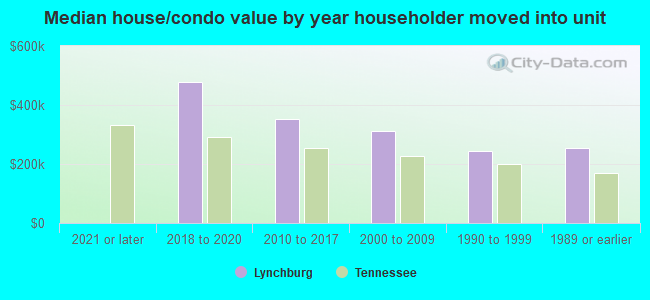
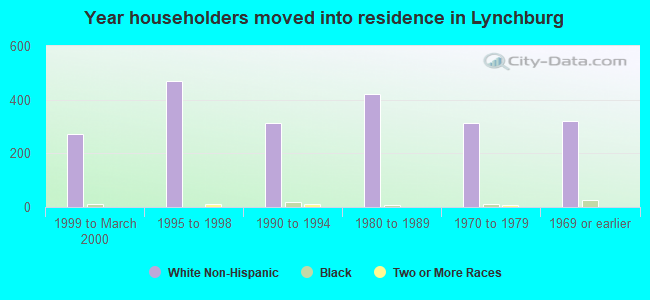
House/condo owner moved in on average 14 years ago
Renter moved in on average 8 years ago
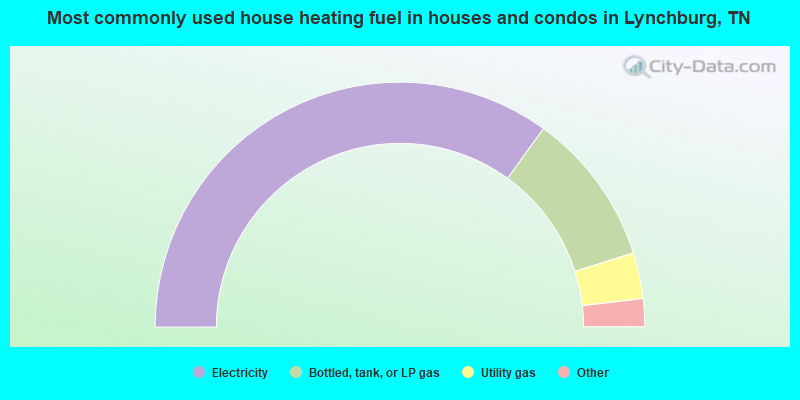
- 70.1%Electricity
- 20.3%Bottled, tank, or LP gas
- 6.1%Utility gas
- 2.4%Wood
- 0.8%No fuel used
- 0.4%Fuel oil, kerosene, etc.
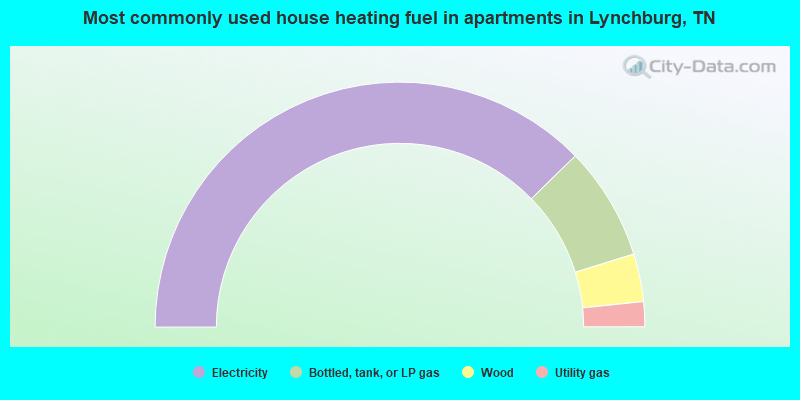
- 75.4%Electricity
- 15.0%Bottled, tank, or LP gas
- 6.3%Wood
- 3.3%Utility gas
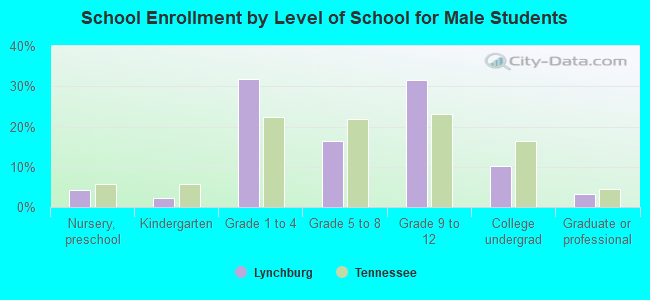
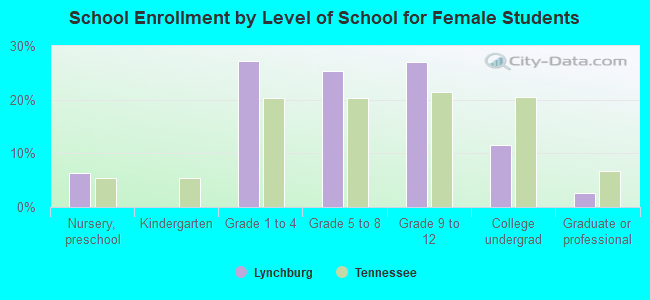
Private vs. public school enrollment:
| Here: | 11.7% |
| Tennessee: | 15.0% |
| Here: | 11.4% |
| Tennessee: | 16.2% |
| Here: | 11.1% |
| Tennessee: | 23.5% |